


Gold News: Fed Decision and ETF Flows Shape Precious Metals Outlook
Fundamentals for gold and silver are heading towards probably the most significant week in the quarter as traders gear up for the US Federal Reserve’s rate decision on 29-30 July and a batch of US economic data as well as results from big tech companies. The Fed will almost certainly hold rates in its next announcement but traders will be listening for the direction of the central bank on the potential path to cutting rates, and when.
In particular, US central bank chair Jerome Powell’s press conference will be in focus as markets await an update from policymakers who are looking likely to maintain a cautious stance despite easing inflation as recent economic data including strong consumer spending and a tight labour market suggest inflation remains under control.
Gold longer-term demand is also likely to be supported by central banks. Central bank purchases reached 41 tonnes for May on a net basis, per the World Gold Council, with Poland at the top of the list having taken in 18 tonnes, followed by China with 10. Poland has accumulated 64 tonnes so far this year and China has added 25 tonnes in official reserves on a year-to-date basis. In June, global, physical-backed, gold ETFs recorded a third-month straight of net inflows, with total funds reaching levels not seen since early 2024, according to the World Gold Council.
Silver fundamentals remain healthy thanks to robust industrial demand. The Silver Institute expects total industrial demand in 2026 will be more than 700 million ounces as global investment in solar, as well as AI and consumer electronics, continues.
Despite expectations that the Fed will keep rates steady for an extended period which could dampen investment demand for precious metals, central bank demand remains strong, and ETFs continue to see inflows, while silver’s industrial demand remains supportive for both gold and silver.
Gold Prices Forecast: Technical Analysis
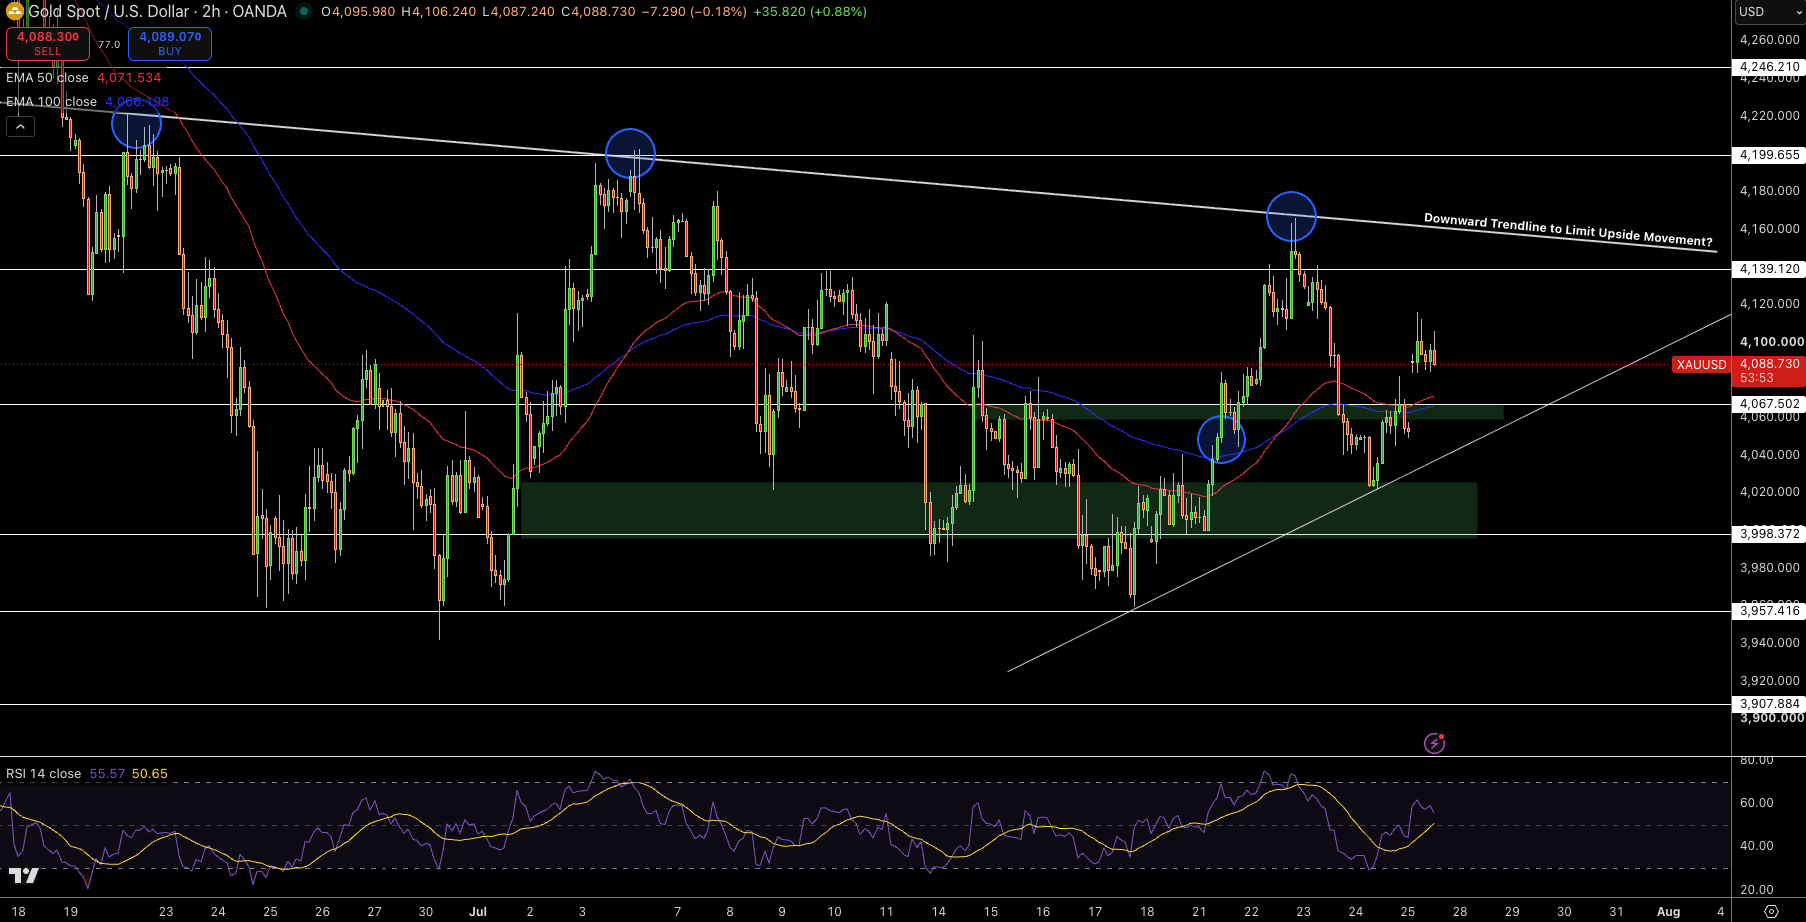
Gold has rebounded strongly from the rising trendline and reclaimed both the 50-EMA ($4,072) and 100-EMA ($4,066), signalling improving short-term momentum. The current Gold price sits at $4,103. The RSI is well above 60 levels, showing the momentum is positive but not yet overbought.
The trendline resistance for the entire move has been a challenge for the bulls for several times this month. The initial resistance zone starts at $4,139 and follows up at $4,200, then $4,246 levels. On the downside, the first support level is at $4,067, followed at $3,998.
The break above $4,139 zone will keep up the bullish breakout and target up at $4,200 levels. However, the failure below the descending trend line can push the prices back towards the $4,067-$3,998 support zone, before buyers try to bounce again.
Gold Price Forecast
Every new Gold analysis as it publishes, today's technical signal and key levels, live price — on one page.
See all Gold forecastsSilver Technical Analysis: Recovery Faces Major Trendline Barrier
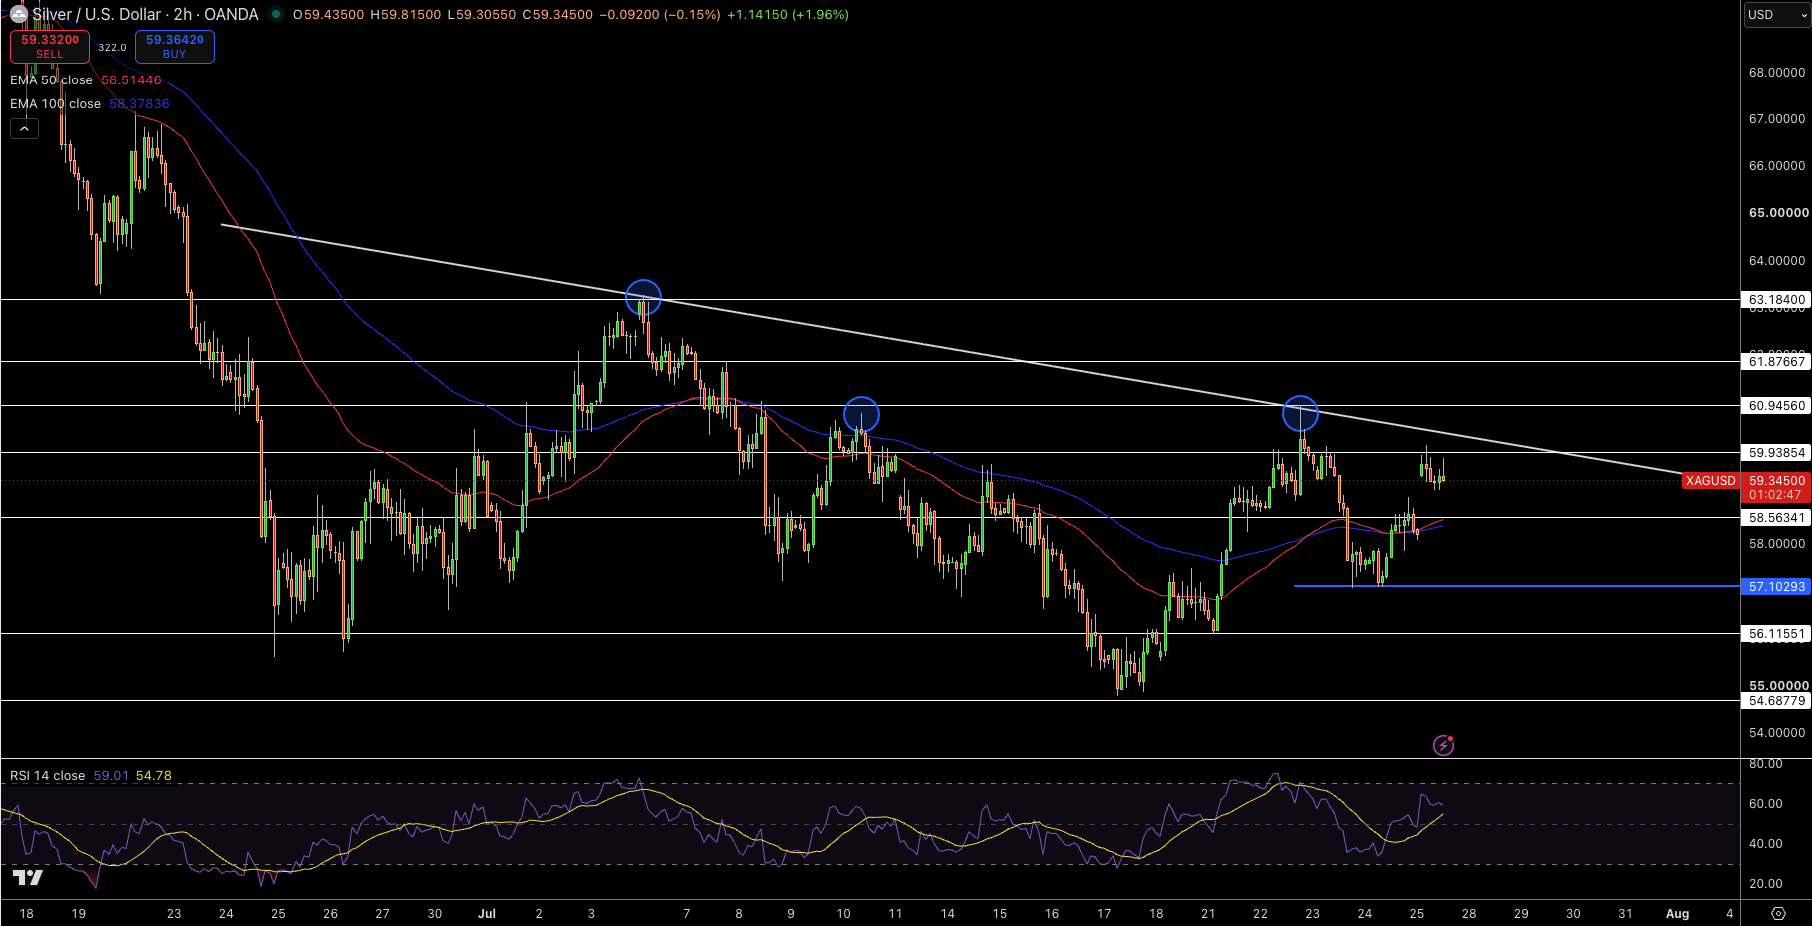
Silver is trying to recover back from the support at $57.10 while the current silver price stands at $59.34 above the 50-EMA ($58.51) and 100-EMA ($58.38). The RSI is back in 59 levels, showing the bullish momentum is positive but not overbought.
The price is still below the descending trendline and the trend line resistance is a key level for the Silver price action. Initial resistance for the price is $59.94, followed up by $60.95, $61.88 levels. Immediate support zone is seen at $58.56 followed up at $57.10.
If Silver holds back above the $58.56 level in the short term, the bulls will have an edge over the bears. In case the price sustains above the $59.94 resistance zone, the price may head towards the descending trend line at $60.95. But a sustained fall below $58.56 may lead silver back towards the $57.10 level in the short term.