Hyperliquid (HYPE) has experienced a 12% drop in the past 7 days, as the crypto market has taken a breather from the latest rally it experienced in late September.
Investors are preparing to digest Wednesday’s U.S. inflation report covering September. The consensus estimate favors a 10 basis point decline in the month-on-month variation of the Core CPI, along with a 20 basis point increase in the annual inflation print.
Higher oil prices continue to be a pressing factor for prices across the globe, as a persistent conflict in the Middle East has managed to keep crude above $80 for months.
These tensions have probably slowed down the pace at which cryptocurrencies have managed to recover from their 2026 lows. However, the overall macro backdrop has been relatively stable, supporting the continuation of the rally that started in August.
Odds of a Rate Hike Could Change Depending On This Week’s Inflation Report
Right now, the odds of a rate hike in October sit below 20%, as market participants expect that the U.S. Federal Reserve will delay its next decision on interest rates until December.
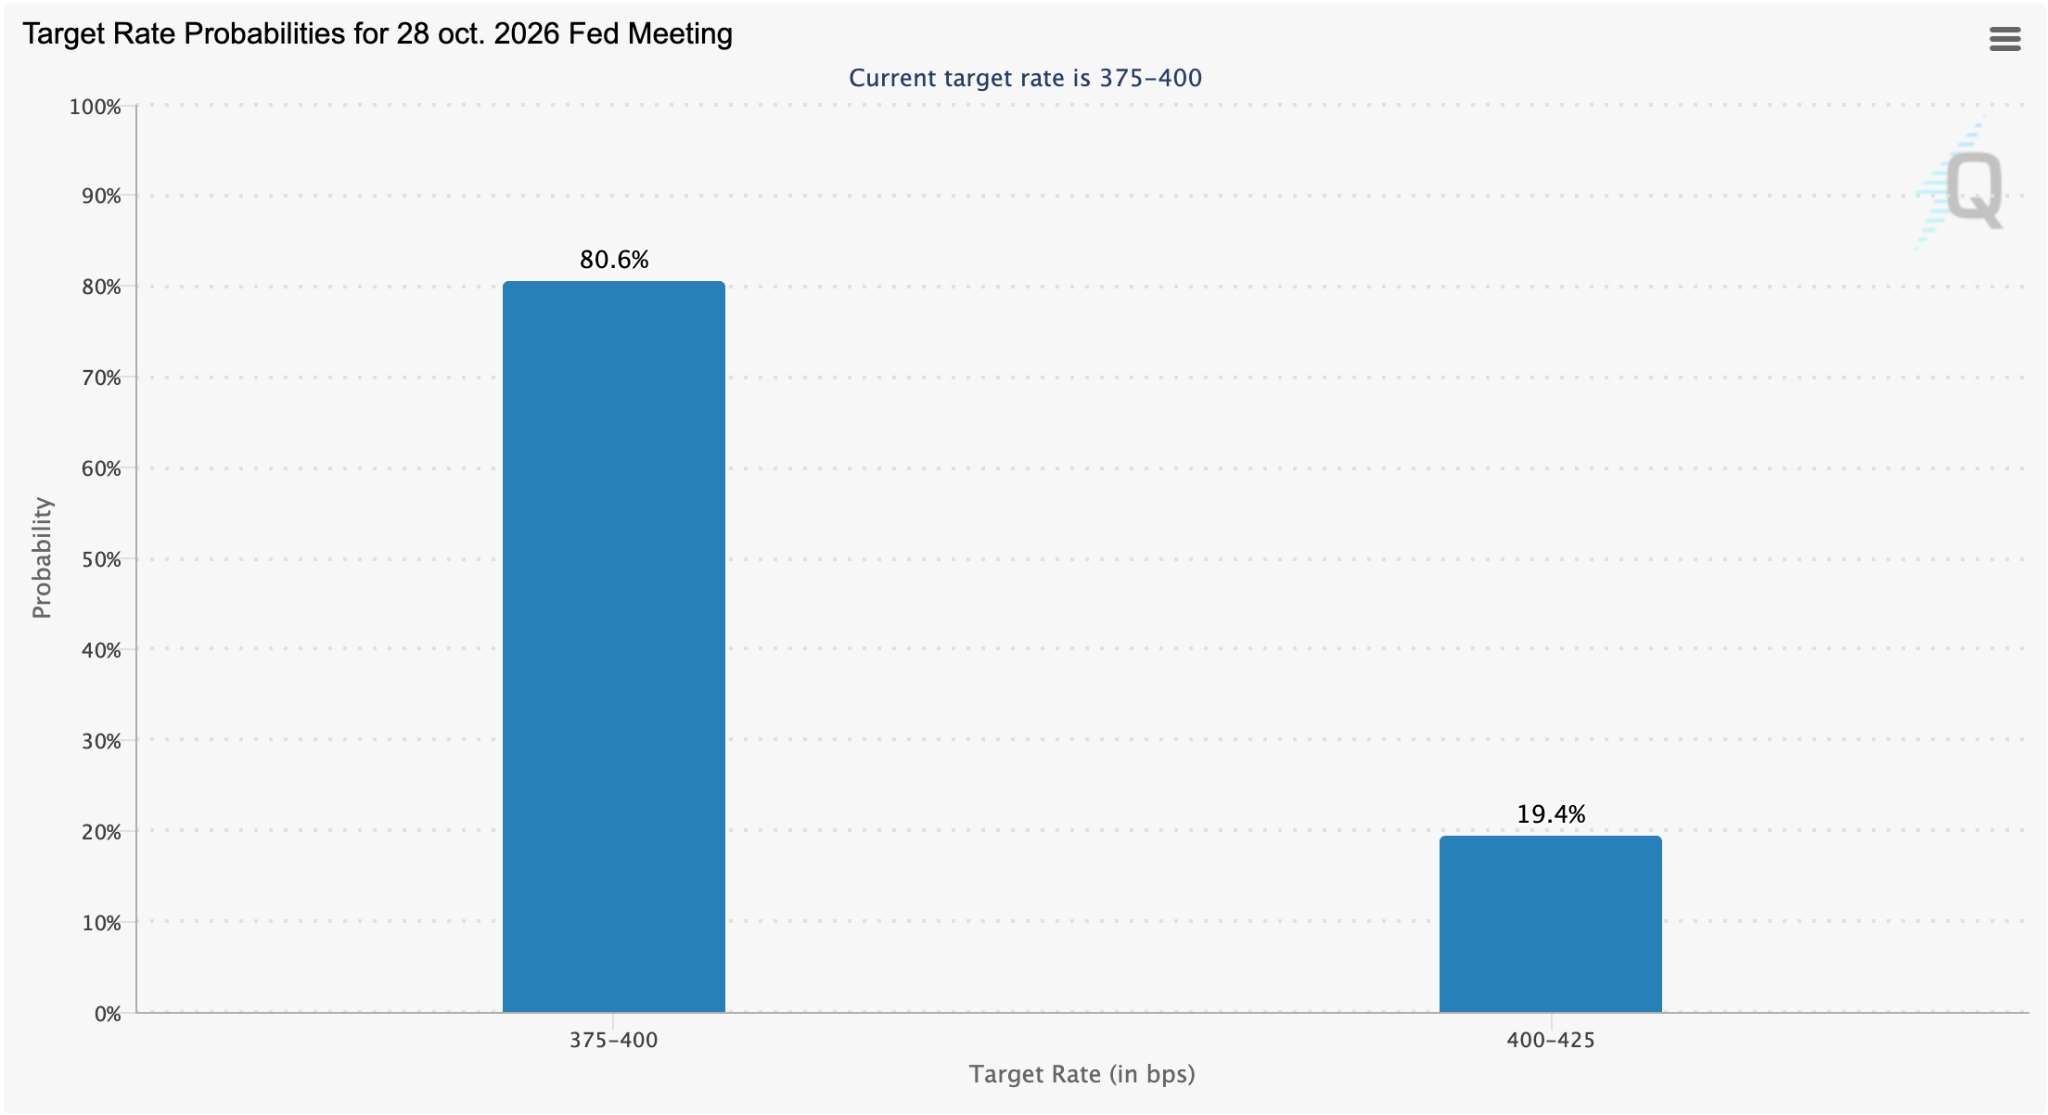
Higher-than-expected inflation could change that, which makes tomorrow’s report relevant for the price action of cryptocurrencies, including altcoins like HYPE.
For this project, a bullish narrative concerning increased adoption of decentralized solutions, tokenization, and on-chain finance has managed to push HYPE to its latest all-time high at nearly $98 per token.
The launch of real-world assets on the HIP-3 version of the blockchain has been critical to boosting open interest and volumes for this decentralized exchange, as traders can now open positions on oil, gold, multiple stock indexes, and more through protocols like trade.xyz.
Transaction Volumes on Hyperliquid Dropped Sharply Last Week
Open interest (OI) experienced a mild decline last week, dropping from $8.9 billion to $8 billion as the price of most crypto assets retreated. Meanwhile, the number of trades executed on Hyperliquid dropped dramatically last week, indicating weaker activity among traders.
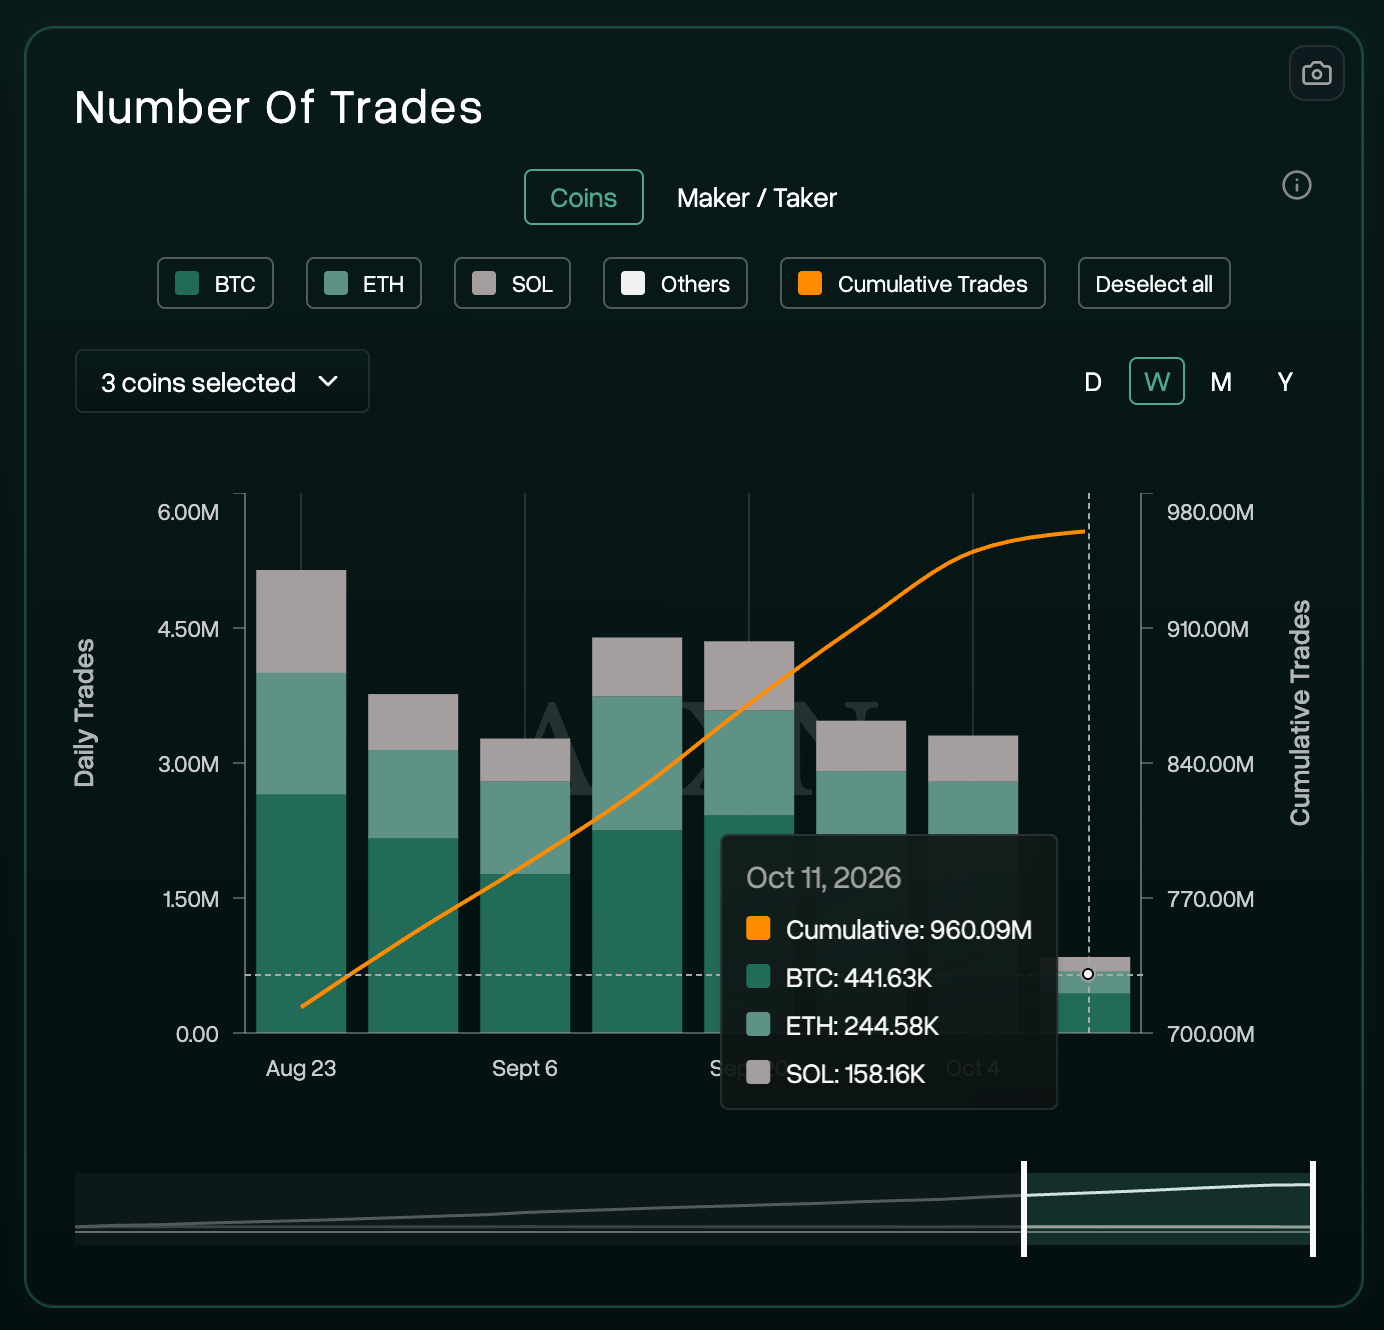
The number of BTC and ETH trades declined by 75% compared to the week before, as traders wait for concrete evidence that the crypto market has found a floor.
These metrics deteriorate a bit the fundamentals that have been driving the price of HYPE to higher levels, but do not change the overall bullish narrative that has pushed its valuation to current levels.
We expect the release of additional pieces of regulation from the U.S. Securities and Exchange Commission (SEC) and the U.S. Commodity Futures Trading Commission (CFTC) that pave the way for the increased adoption of this layer-one blockchain and its trading platform in this key market.
HYPE Could Drop to $76 Before Bouncing Back to $90
Turning to the 4-hour chart, the selling pressure seems to have accelerated at around $94. In this lower time frame, a sell signal has already popped up in the Relative Strength Index (RSI), as this momentum indicator dropped below 40.
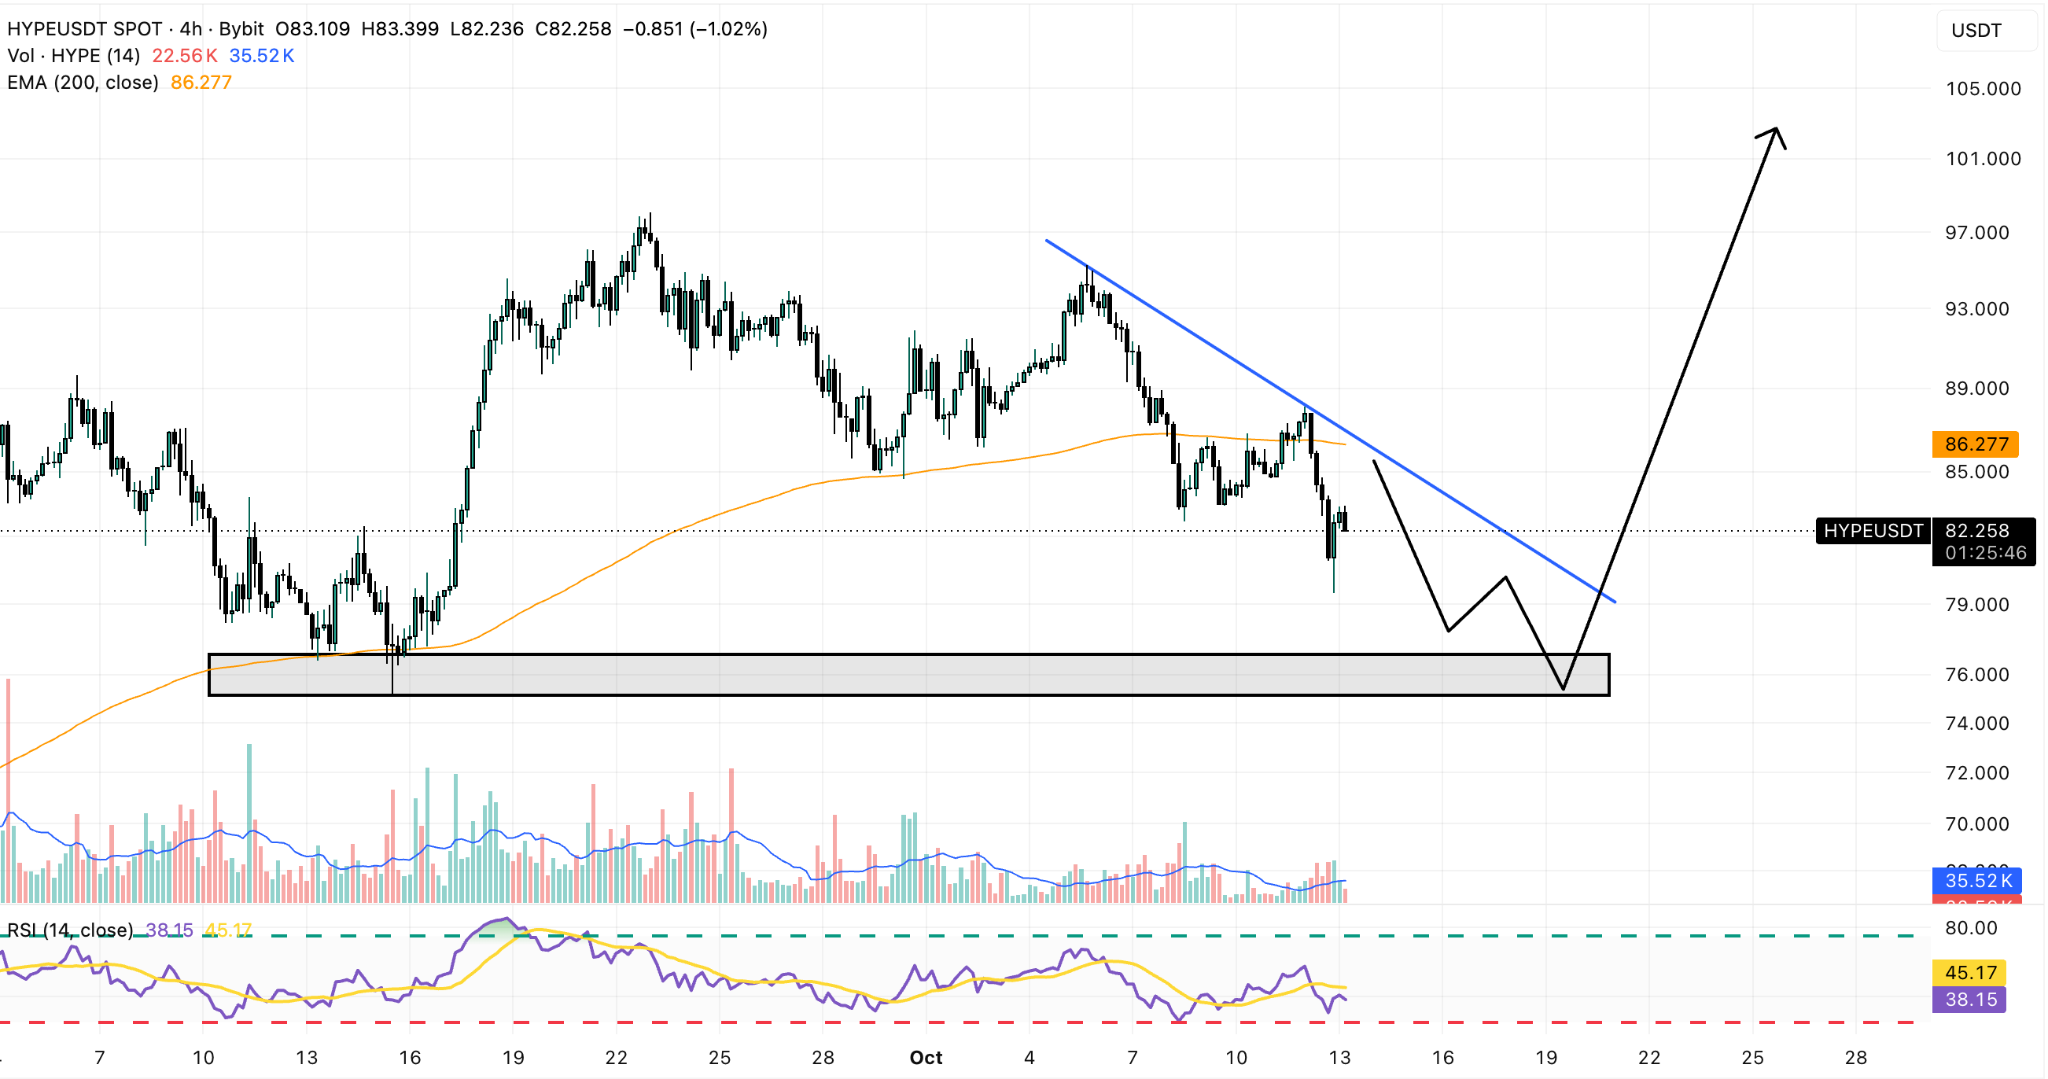
It is highly likely that the decline will continue toward the nearest area of liquidity for the token, which, according to the chart, is the $76 level. The demand for HYPE at that level was strong enough to catalyze the latest move to a new all-time high the last time the price action hit that mark.
A lower-than-expected inflation print in the U.S. may push HYPE back to $90 faster than we anticipate. However, if the market reacts negatively to this report and the price action breaks below $76, the downside risk for the token would be much higher, as it could drop to the low 60s.