


NASDAQ 100 Technical Analysis
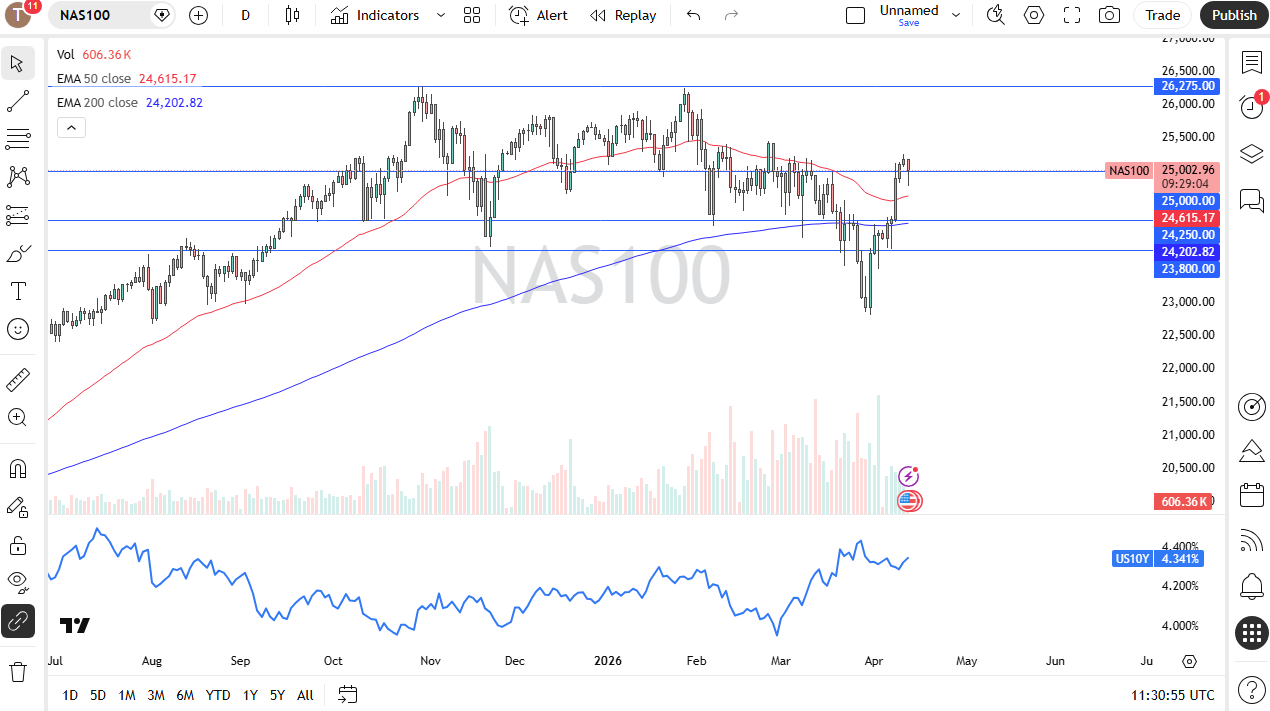
The Nasdaq 100 has shown itself to be pretty weak right off the bat on Monday, but we have bounced a bit from the extreme lows, so we’ll have to see how this plays out. This, of course, is in reaction to the idea that the peace talks failed to bring any substantial gains in trying to end the war, but the ceasefire is still in effect, so we’ll have to wait and see.
If we can break above the highs of the trading session on Friday, that would be an extraordinarily bullish sign. Right now, though, I think this market is probably more apt to go sideways in this general vicinity more than anything else right around this crucial 25,000 level.
Dow Jones 30 Technical Analysis
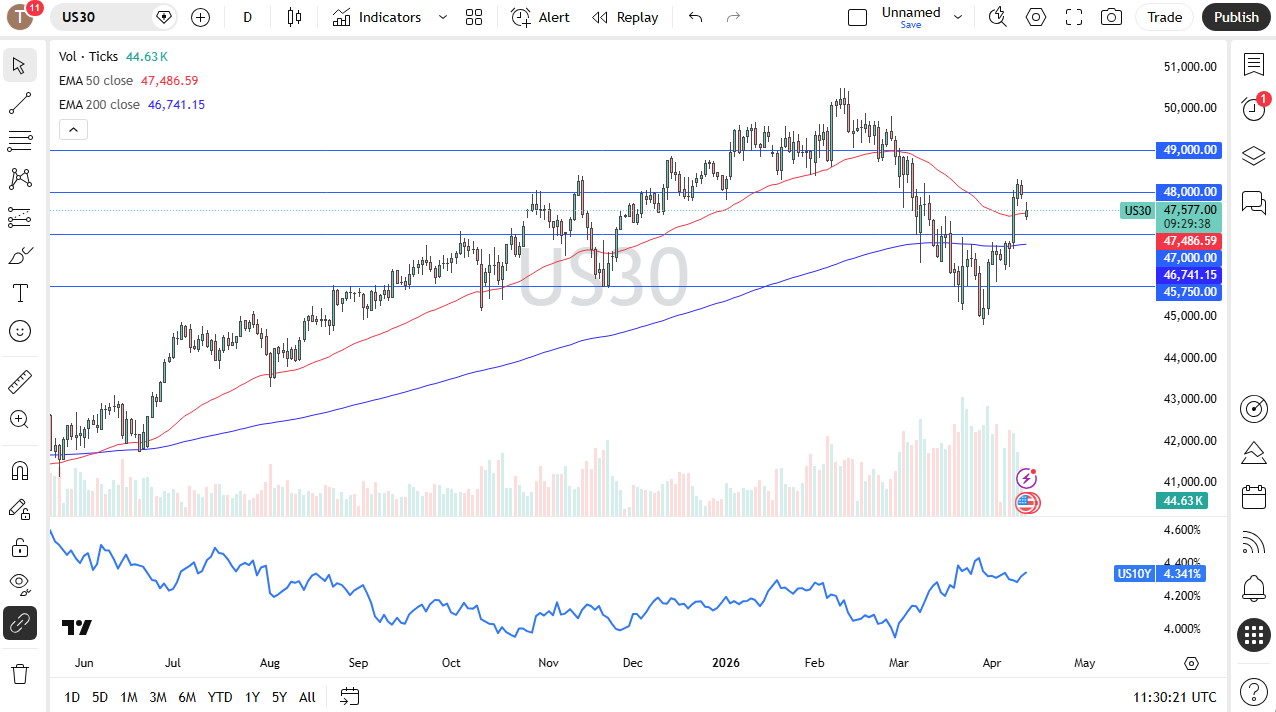
The Dow Jones 30 gapped lower, but right now seems like it’s just hanging around the 50-day EMA. The Dow Jones 30, of course, might be a safer bet than some of the other indices available to you, but right now, I think this is just more sideways action. I don’t think that it is a market that is easy to get long of, but I don’t necessarily want to short either.
The 200-day EMA sits just below the crucial 47,000 level, offering a bit of a floor. I think it is more of a situation where you’re buying dips, trying to take advantage of value.
S&P 500 Technical Analysis
NASDAQ 100 Price Forecast
Every new NASDAQ 100 analysis as it publishes, today's technical signal and key levels, live price — on one page.
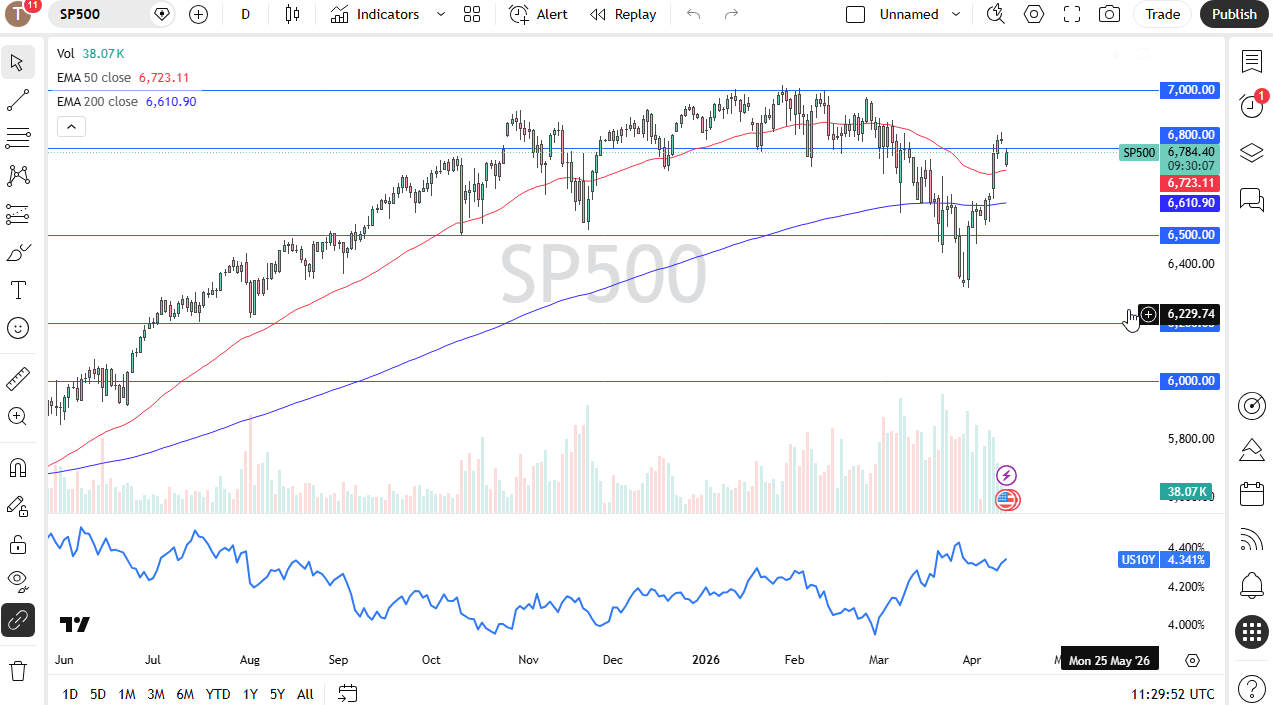
See all NASDAQ 100 forecastsThe S&P 500 fell to the 50-day EMA immediately, but it has rallied since then. We’ve seen a little bit of pressure at the crucial 6,800 level, and this, to me, all things being equal, looks like a market that’s getting ready to form some type of tighter range. The 6,800 level is an area where we’ve seen a lot of people interested in previously, so I think it makes a certain amount of sense that they may still be somewhat interested in both directions. We’ve seen a pretty nasty bounce here, I think working off some of that froth makes a lot of sense.
If you’d like to know more about chart patterns and how to trade them, please visit our educational area.