


NASDAQ 100 Technical Analysis
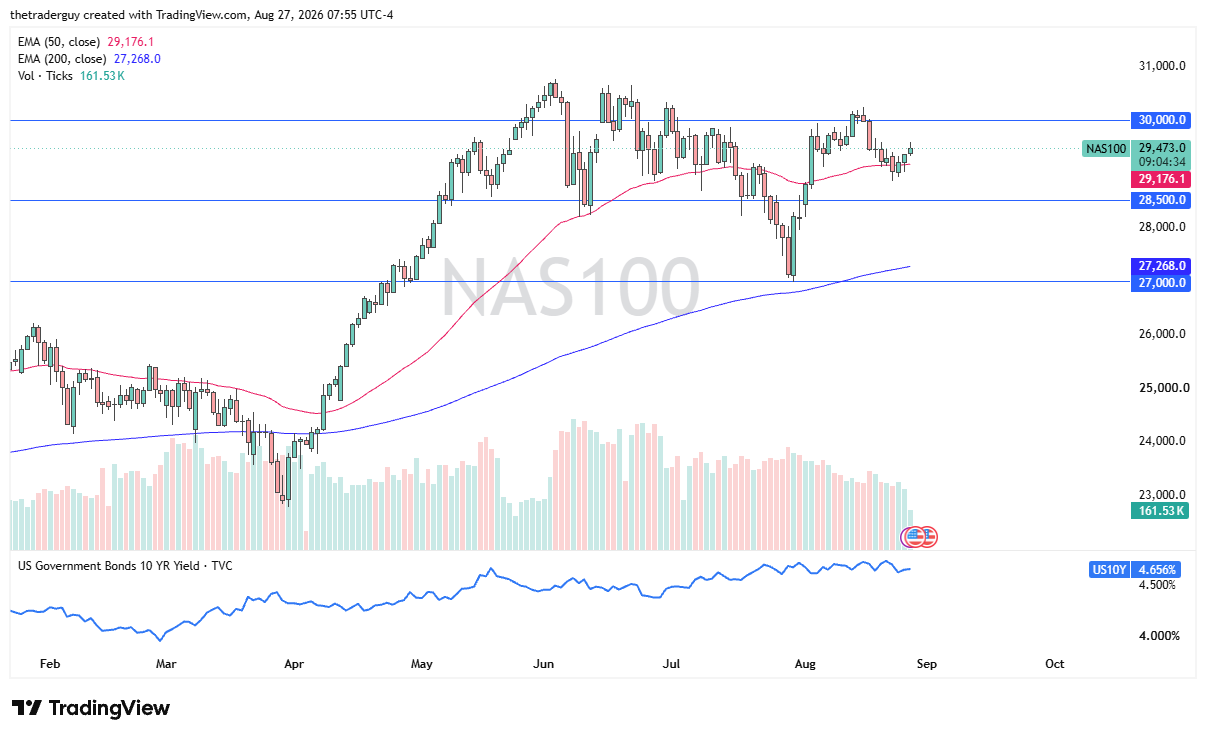
The Nasdaq 100 rallied slightly during the early part of the trading session in premarket trading on Thursday, as it is mainly in reaction to Nvidia having a great earnings call, which, of course, is a major part of the market.
Ultimately, though, this is a market that still has to deal with a lot of external issues, such as interest rates, Kevin Warsh and his speech on Friday, the Strait of Hormuz, etc.
Ultimately, this is a market is one that, although it’s positive, there are plenty of things that could rattle it at the moment. Nonetheless, this looks like a positive shift in momentum.
Dow Jones 30 Technical Analysis
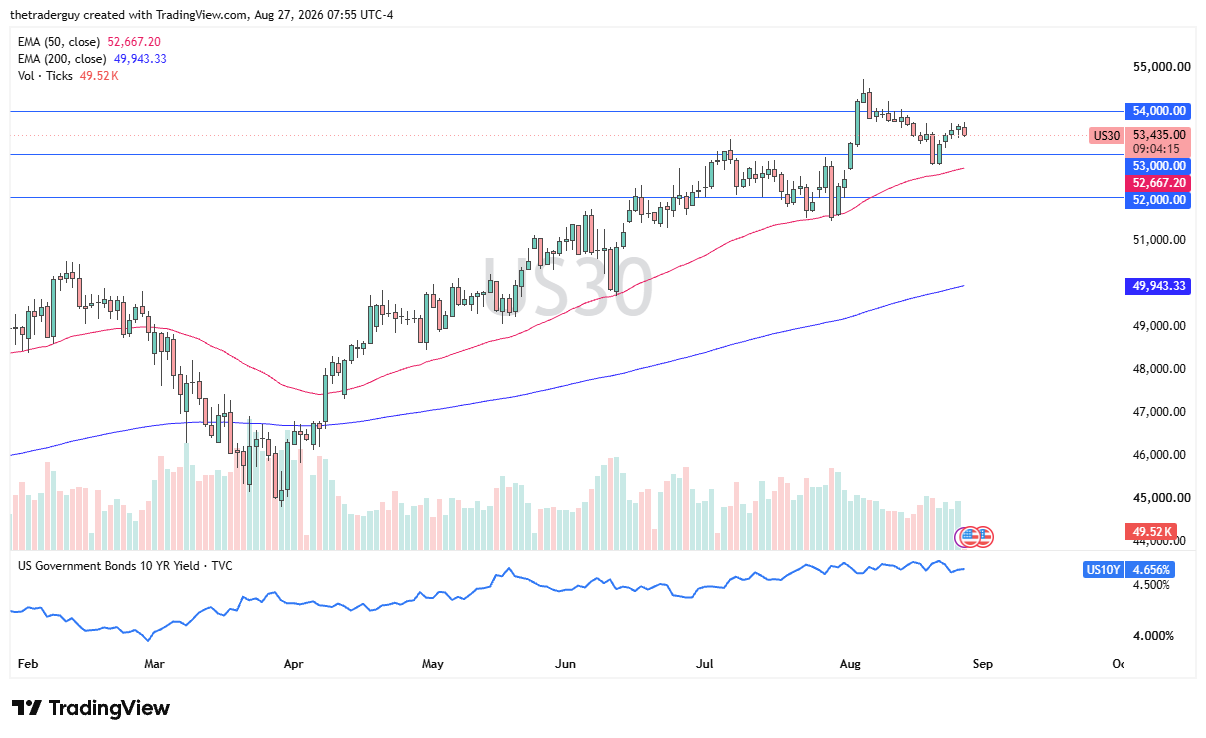
The Dow Jones 30 is negative early in the session, which is probably not a huge surprise, as money seems to be running over to Nvidia at the moment. The Nasdaq is favored over the Dow Jones 30 in that scenario, but the Dow Jones 30 seems to be more susceptible to geopolitics in general, as it is blue-chip multinationals.
And as long as there is an issue, for example, the trade war now flaring up between the United States and Canada again and the Strait of Hormuz being closed, some of these companies are going to be a little bit more exposed than others.
The 53,000 level underneath has been supported previously, and we have the 50-day EMA reaching toward it, so at this point, it does look like a potential area that might bring in some type of interest.
S&P 500 Technical Analysis
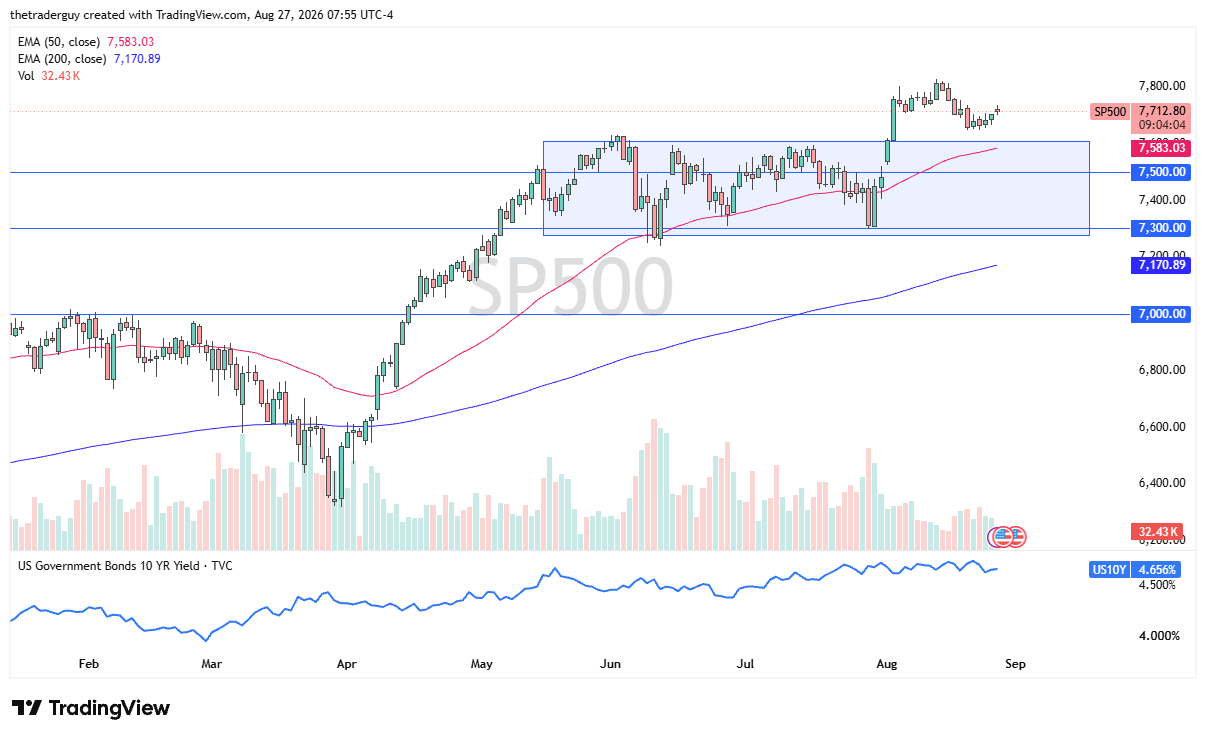
The S&P 500 gapped higher to kick off the session, has gone back and forth in premarket trading, and now just seems like it’s willing to hang out in this area. With so many of the major components in the S&P 500 and the Nasdaq 100 crossing these days, it makes sense that it will move in the same manner as the Nasdaq 100.
NASDAQ 100 Price Forecast
Every new NASDAQ 100 analysis as it publishes, today's technical signal and key levels, live price — on one page.
See all NASDAQ 100 forecastsThe 7,600 level underneath could be a bit of a floor, as it was previous resistance, and now the 50-day EMA is racing toward it.
The 7,800 level above is a potential target. It was a swing high, and if we start to see momentum, that’s probably where I will be aiming for. Ultimately, this is still a strong-looking chart, despite the fact that it’s been a little lackluster over the last couple of weeks.
If you’d like to know more about chart patterns and how to trade them, please visit our educational area.