TSLA Technical Analysis
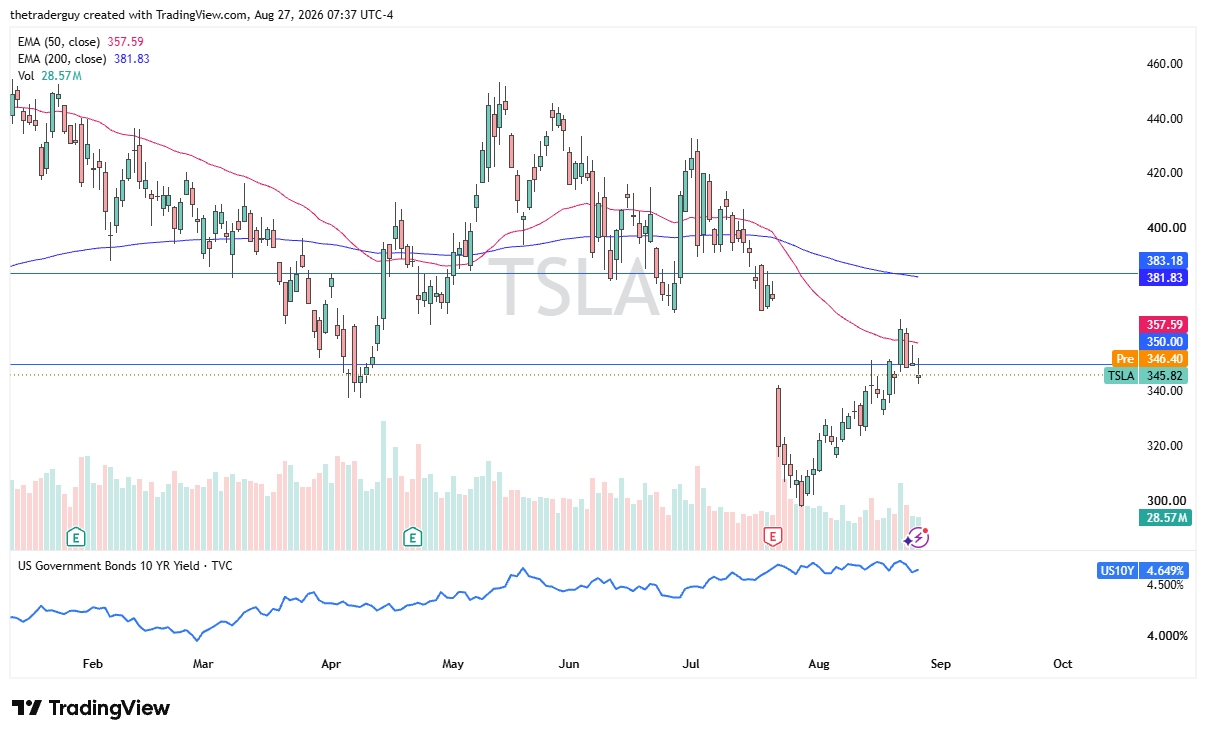
Tesla looks like it is slightly positive, really somewhat flat in early trading as the $350 level continues to be an area of interest. This is an area that previously had been support; now it looks like it’s trying to offer resistance.
But if we can push to the upside and overcome the 50-day EMA, it could be a positive sign. We gapped lower after the earnings call and now have basically filled the gap. The question is, do we continue lower?

Ford Technical Analysis
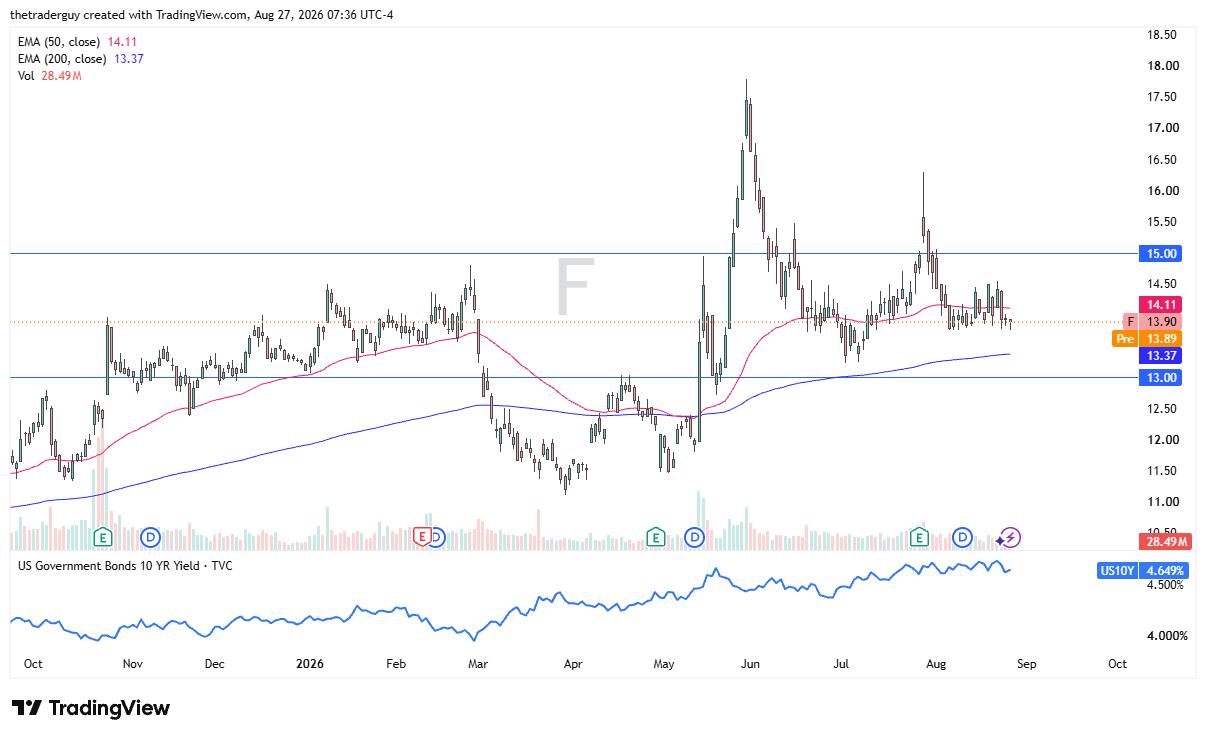
Ford looks like it is simply stuck in a short-term consolidation area, with the $13.75 level offering support, with the $14.25 level above offering resistance.
Ultimately, there’s not much going on here. It’s a pretty flat and neutral stock, although short-term traders will be interested in this type of setup, so it’s a possible sideways market that day traders could participate in using some type of range-bound system as the market is offering that kind of attitude at the moment.
General Motors Technical Analysis
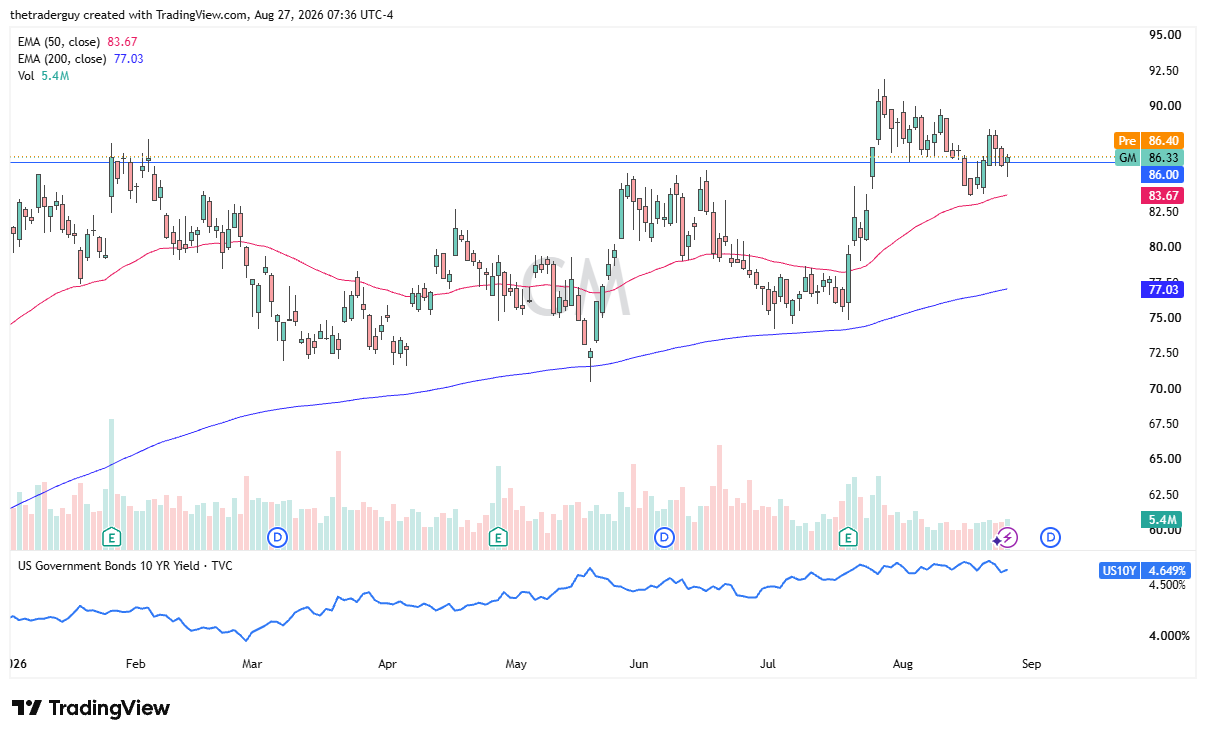
The market for General Motors is a little bit positive, ever so slightly in pre-market trading, but General Motors has been flagging in the form of a bullish flag for a while. The question is whether or not the market can break to the upside.
It’s worth noting that the $86 level has been significant resistance previously and now has offered support. The dividend date is coming up on the 4th of September, so between now and then, some people looking to get in on that ex-dividend date might get involved. Either way, it’s been in an uptrend for a while, and it is a strong-looking chart.
If you’d like to know more about technical analysis and how traders use it, please visit our educational area.