


NASDAQ 100 Technical Analysis
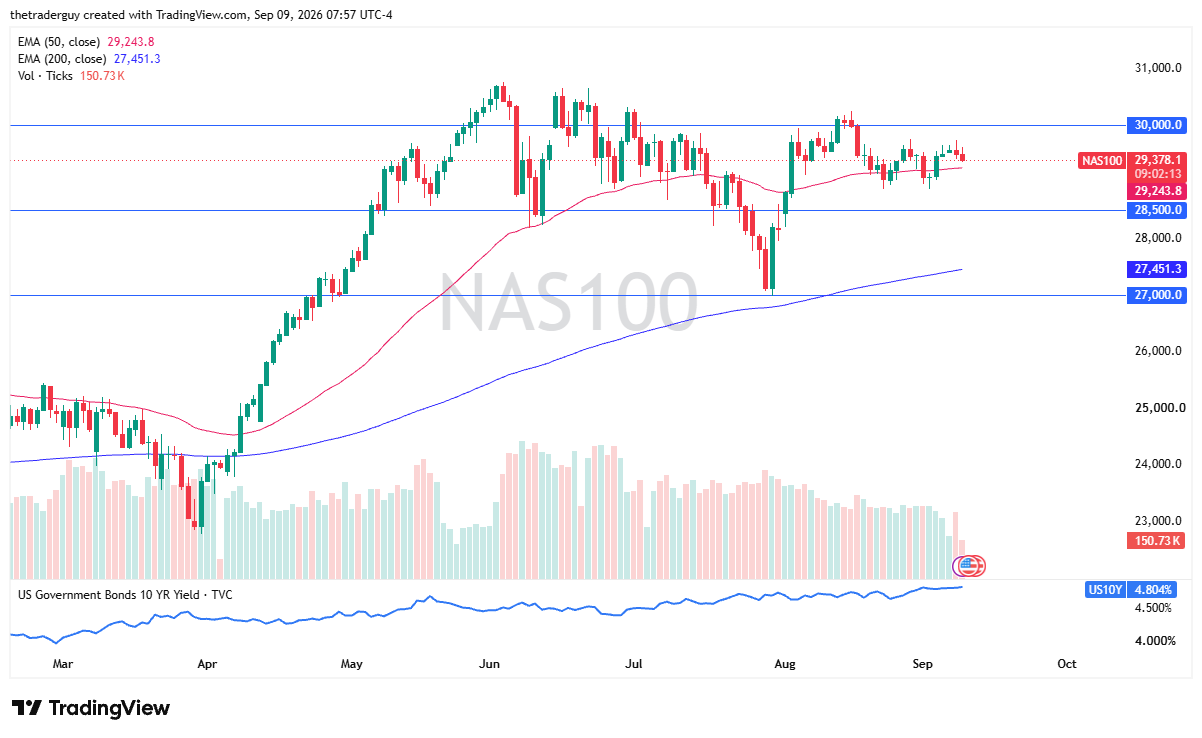
The NASDAQ 100 initially tried to rally a bit during the trading session here in pre-market trading on Wednesday, but gave back gains as we continue to consolidate overall. This is a market that looks like it’s waiting for some type of resolution, and that makes sense considering that PPI comes out on Thursday and CPI comes out on Friday, followed by an interest rate hike.
The NASDAQ 100 is fighting 10-year yields at 4.8%, and 2-year yields are rising rapidly as well. So, with all of that, it’s not a surprise to see that the market simply doesn’t have anywhere to go yet.
Dow Jones 30 Technical Analysis
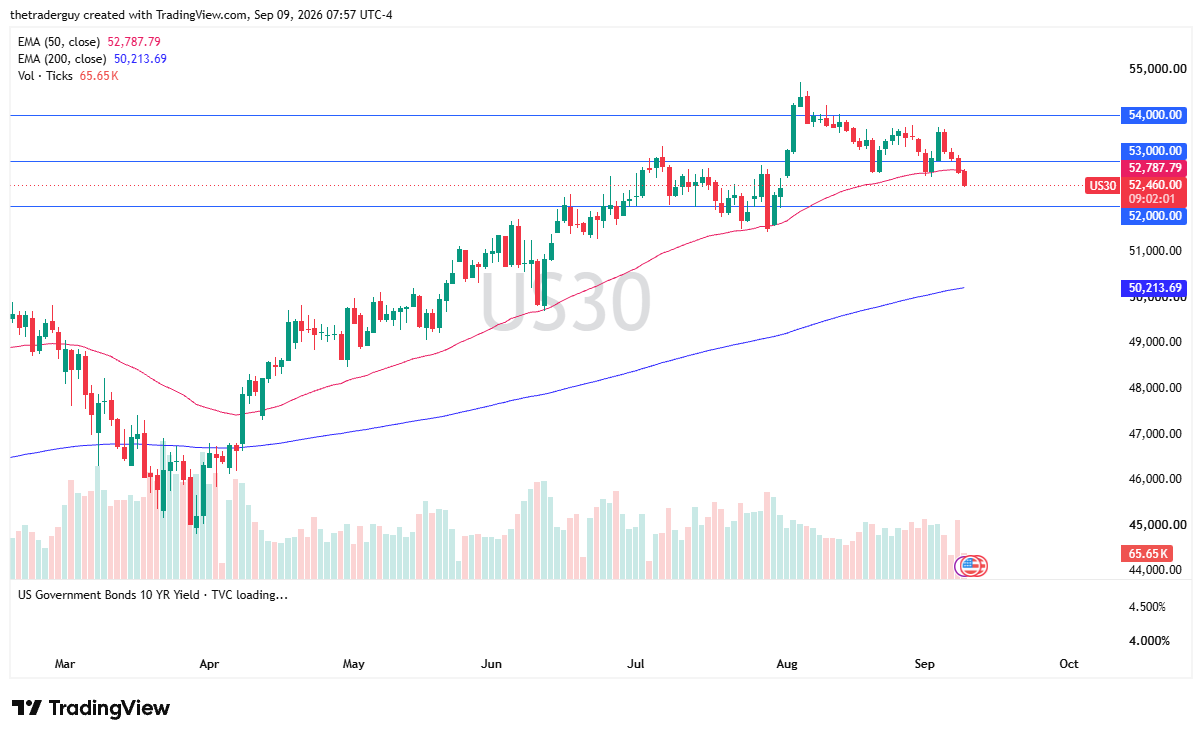
The Dow Jones 30 is the weakest of the three indices in pre-market trading. It has broken below the 50-day EMA, currently trading right around the 52,440 level and looking very weak indeed. At this point, the question isn’t so much whether or not there’s selling pressure that’s going to remain, but whether or not we are changing the overall attitude, or are we just getting ready to go sideways again?
Ultimately, it’s a little difficult to tell, but one thing’s for sure: out of the three major indices, it’s the weakest-looking one early.
S&P 500 Technical Analysis
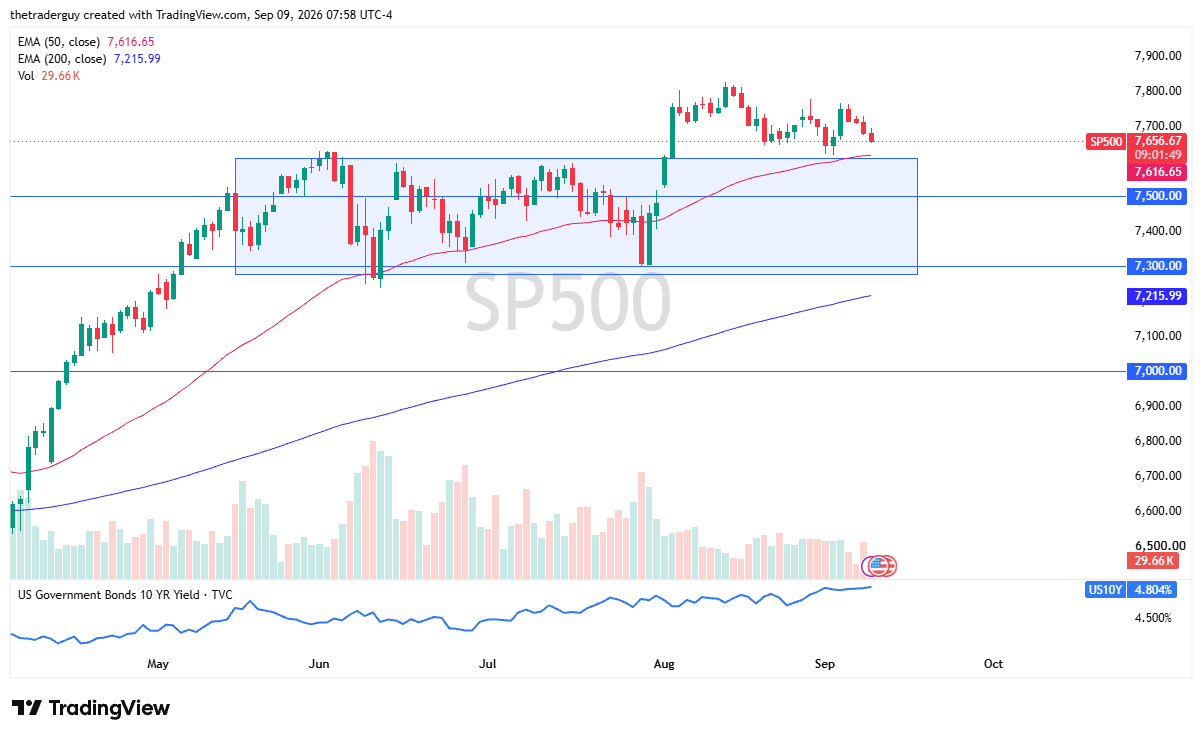
The S&P 500 is also breaking lower. It initially tried to rally. It continues to find the 7,700 level difficult to overcome. The 50-day EMA sits right at the 7,600 level. That has been the support recently. It was the previous resistance, so we’ll have to watch to see whether or not market memory comes back into play there. It would be an area that I’d be watching.
The announcements, of course, could throw everything into disarray. We’ll just have to wait and see how that plays out.
S&P 500 Price Forecast
Every new S&P 500 analysis as it publishes, today's technical signal and key levels, live price — on one page.
See all S&P 500 forecastsIf you’d like to know more about technical analysis and how traders use it, please visit our educational area.