
Fundamental Outlook
BS strategists have revised the S&P 500’s 2024 target upwards to 5,400 from 5,150, signaling an 8% potential upside and setting a new high among forecasts. They maintain a preference for the Health Care sector but see more substantial opportunities in cyclical sectors, attributing this optimism to persistent economic strength.
The financial sector is expected to benefit from higher interest rates, an uptick in M&A activities, and looser lending standards. This adjustment in the S&P 500’s outlook could indirectly influence the Nasdaq and Dow by fostering a positive market sentiment, potentially leading to broad-based gains across major indexes.

Additionally, UBS has updated its earnings forecast for 2024-2025. For now, the market will be looking for an upcoming economic indicators such as the CB Leading Index.
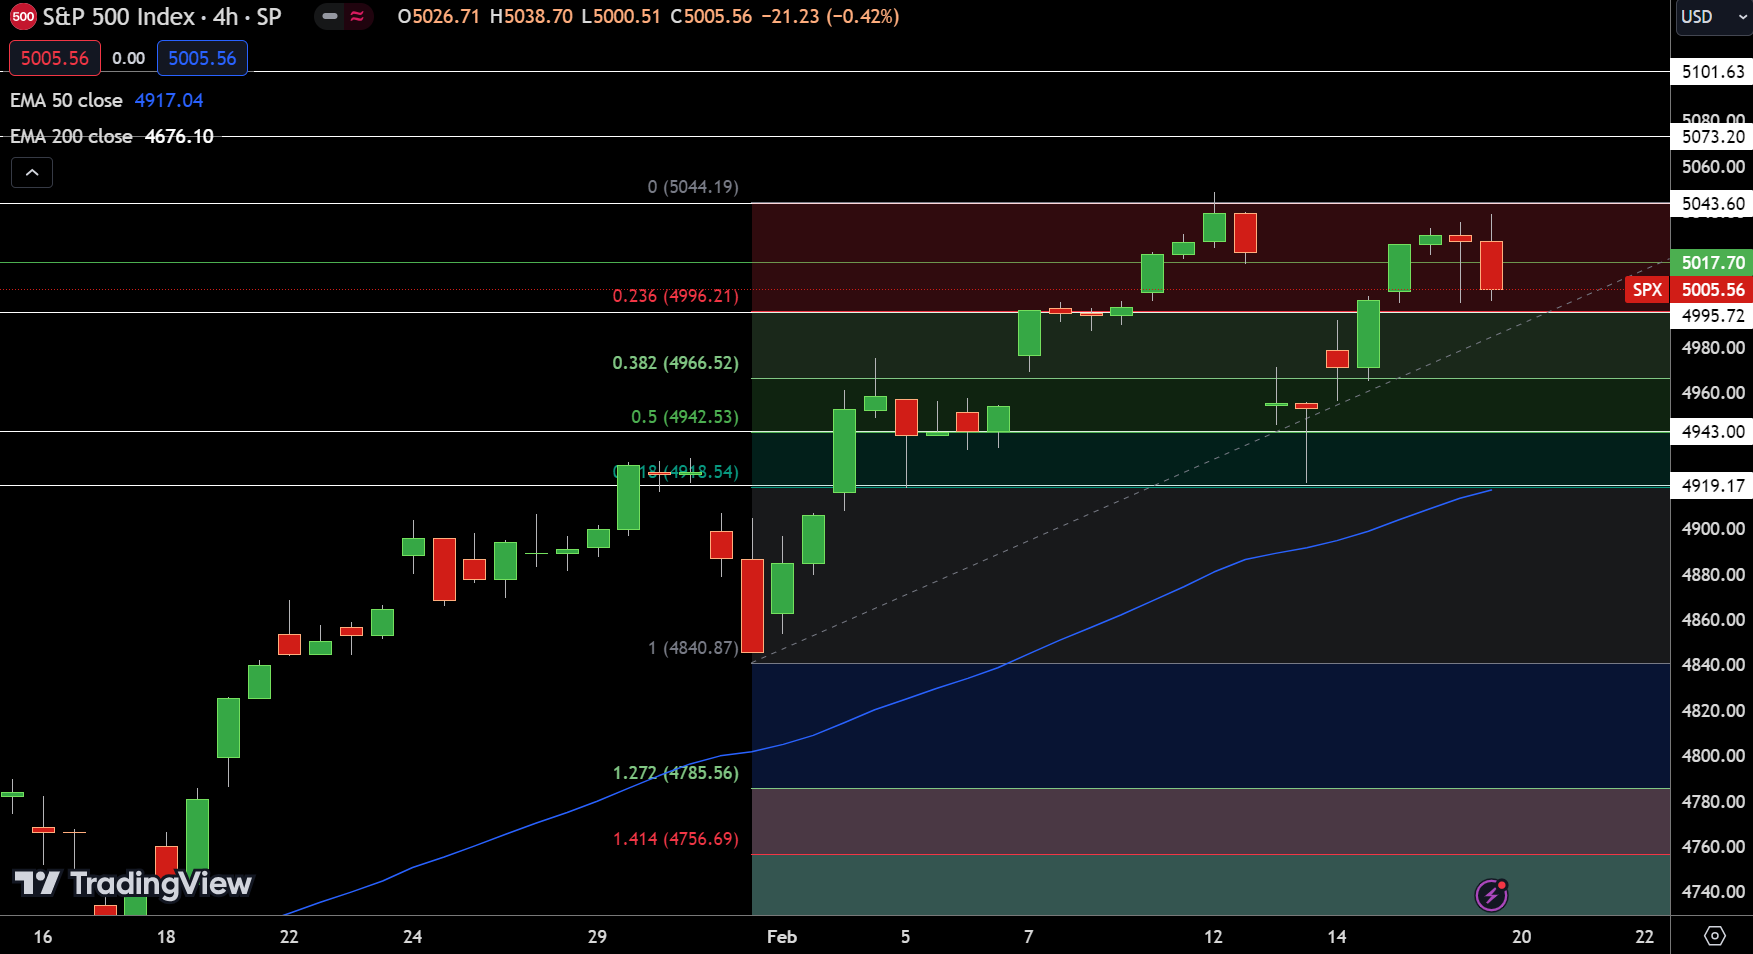
The S&P 500 index’s pivot point holds around of $5017.70 suggests a potential for bullish momentum, with resistance levels at $5043.60, $5073.20, and $5101.63 hinting at upward movement possibilities.
Support figures at $4995.72, followed by $4943.00 and $4919.17, delineate areas of buying interest.
Significantly, the SPX stands well above its 50-day and 200-day Exponential Moving Averages (EMAs) of 4917.04 and 4676.10, respectively, reinforcing a generally positive trend. This positioning indicates underlying market strength, despite short-term fluctuations.
Dow Price Forecast
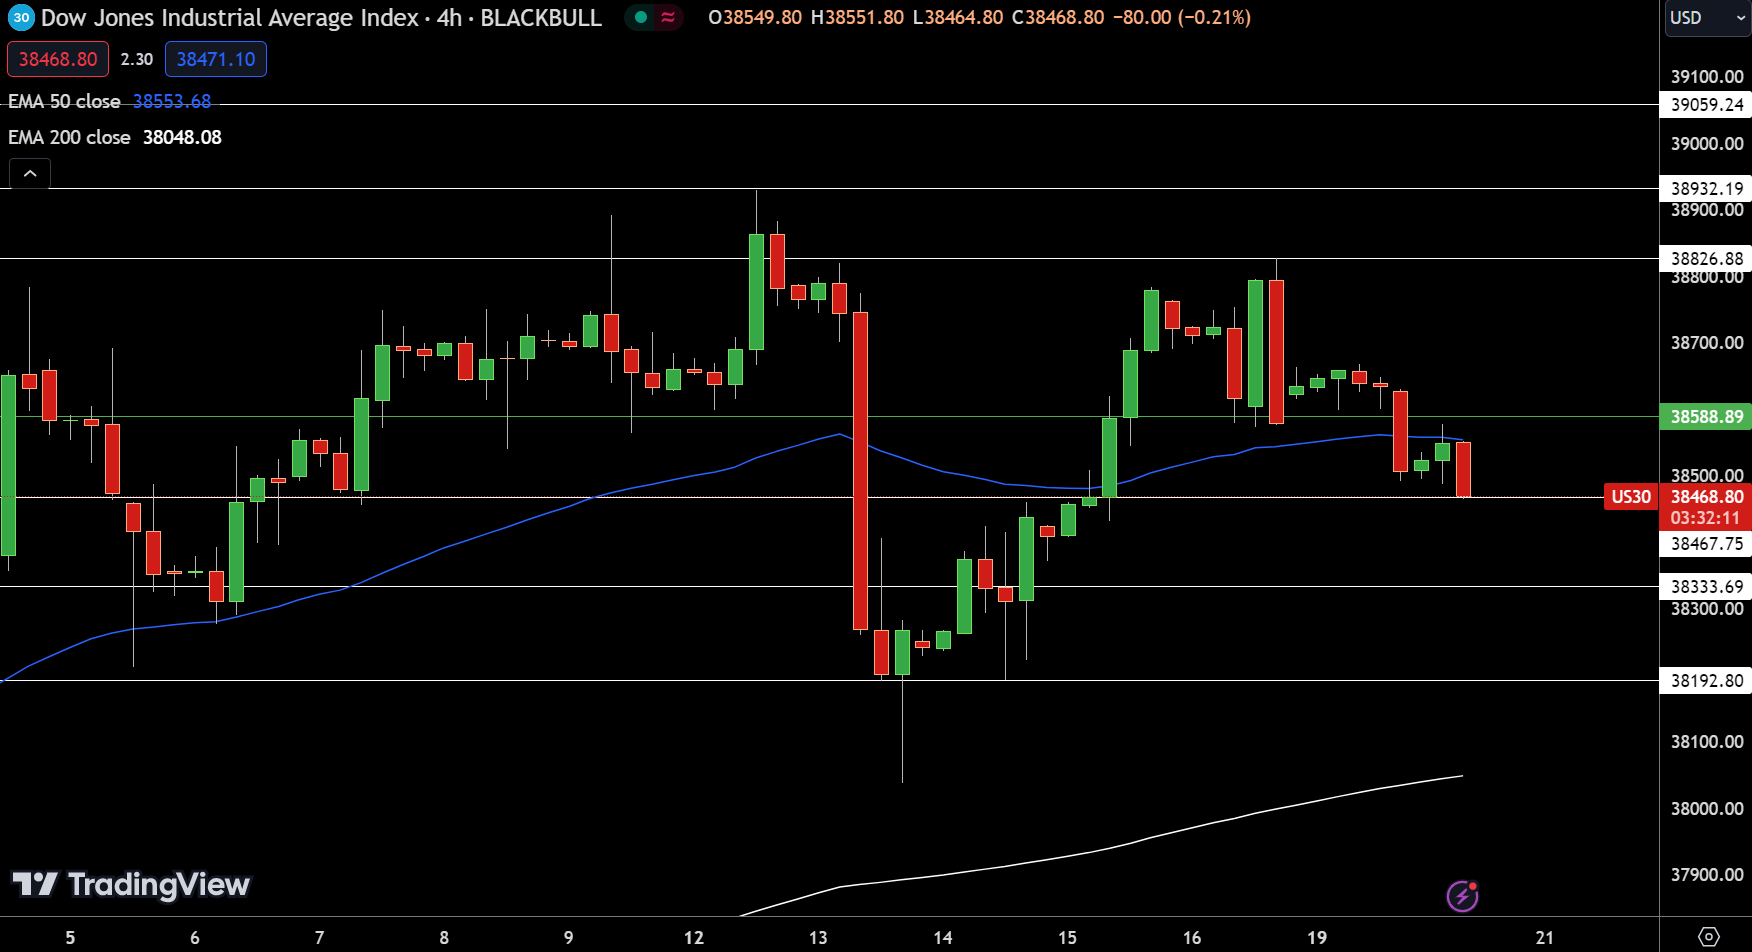
The index’s proximity to its 50-day EMA of 38553.68 and above its 200-day EMA of 38048.08 underscores a cautiously optimistic sentiment, albeit with a bearish outlook below the pivot.
This stance anticipates a testing period ahead, with the DJIA poised to challenge resistance levels, reflecting the market’s dynamic nature.
NASDAQ Price Forecast
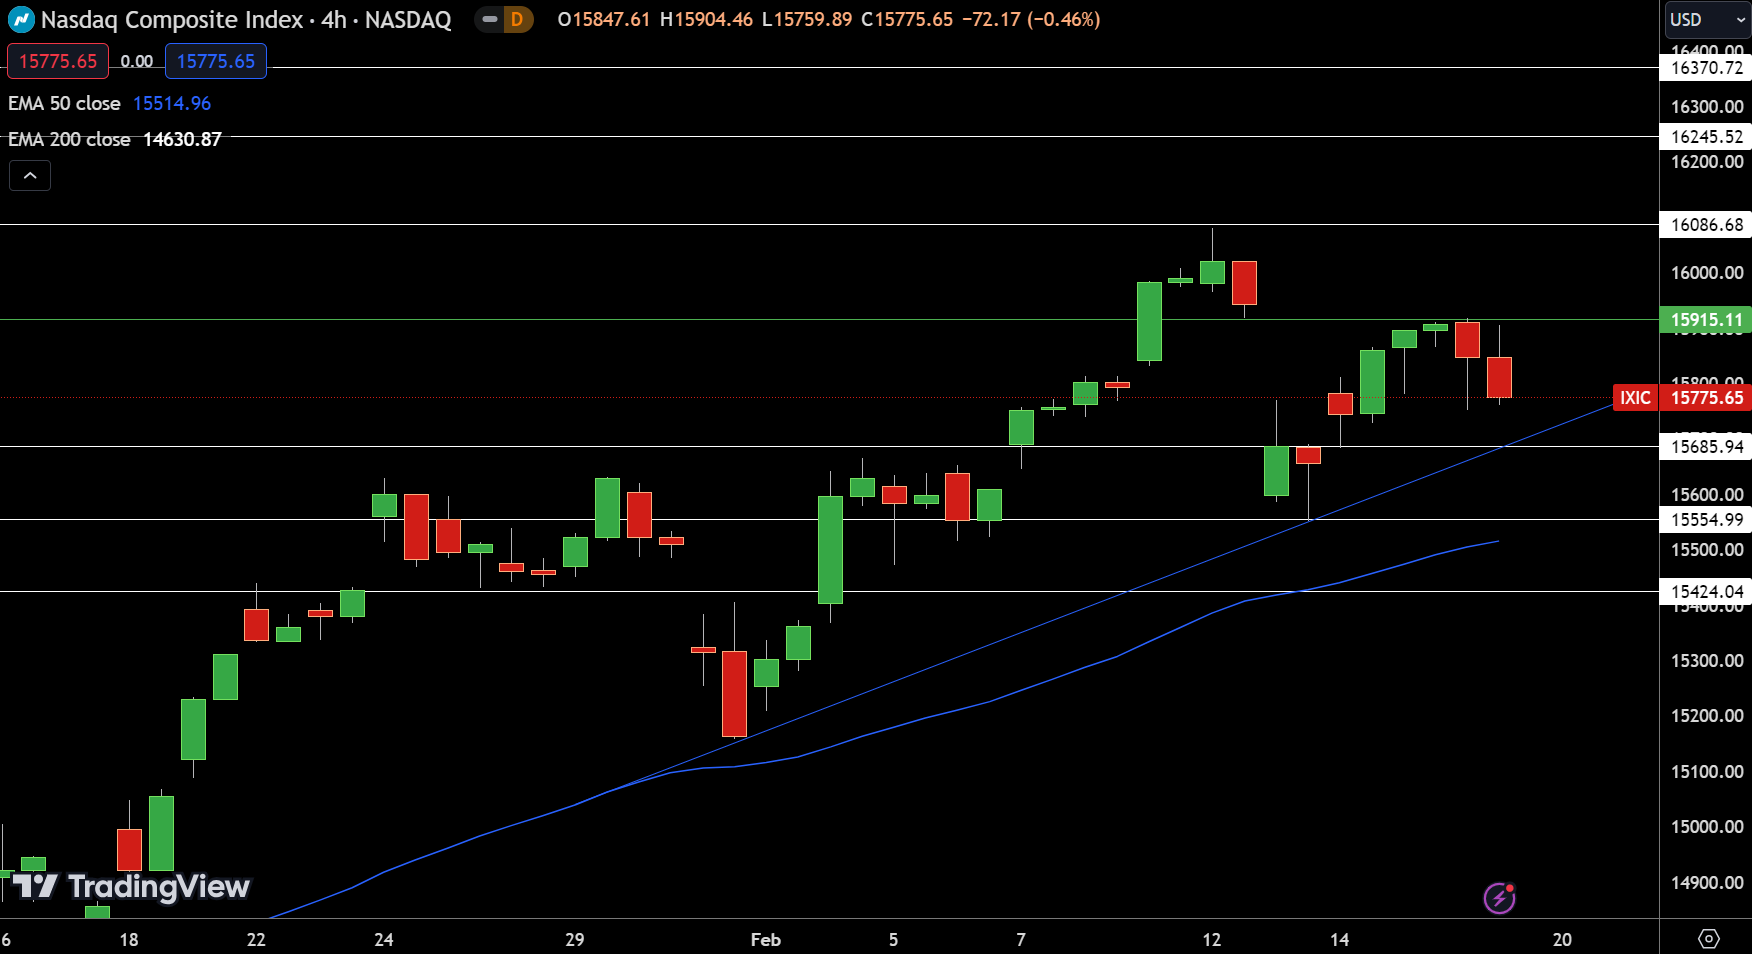
The NASDAQ stands at a pivot point of 15915.11, with immediate resistance levels mapped at 16086.68, 16245.52, and 16370.72, suggesting potential for growth if these barriers are surpassed. Conversely, support levels at 15685.94, 15554.99, and 15424.04 provide a safety net against further declines.
Notably, the NASDAQ’s position above its 50-day and 200-day Exponential Moving Averages (EMAs) of 15514.96 and 14630.87, respectively, indicates a long-term bullish trend.
However, current market sentiment is deemed bearish below the pivot point, highlighting a cautious outlook among investors. This dichotomy underscores the market’s current volatility and the critical nature of upcoming trading sessions.
For a look at all of today’s economic events, check out our economic calendar.