



Key Insights

- Middle East conflict minimally impacts oil output, driving a dip in USOIL and UKOIL prices.
- Natural Gas falls 6.19% to $2.74, with a bullish outlook above $2.72.
- Red Sea tanker disruption and Libyan protests add complexity to the oil market.
Quick Fundamental Outlook
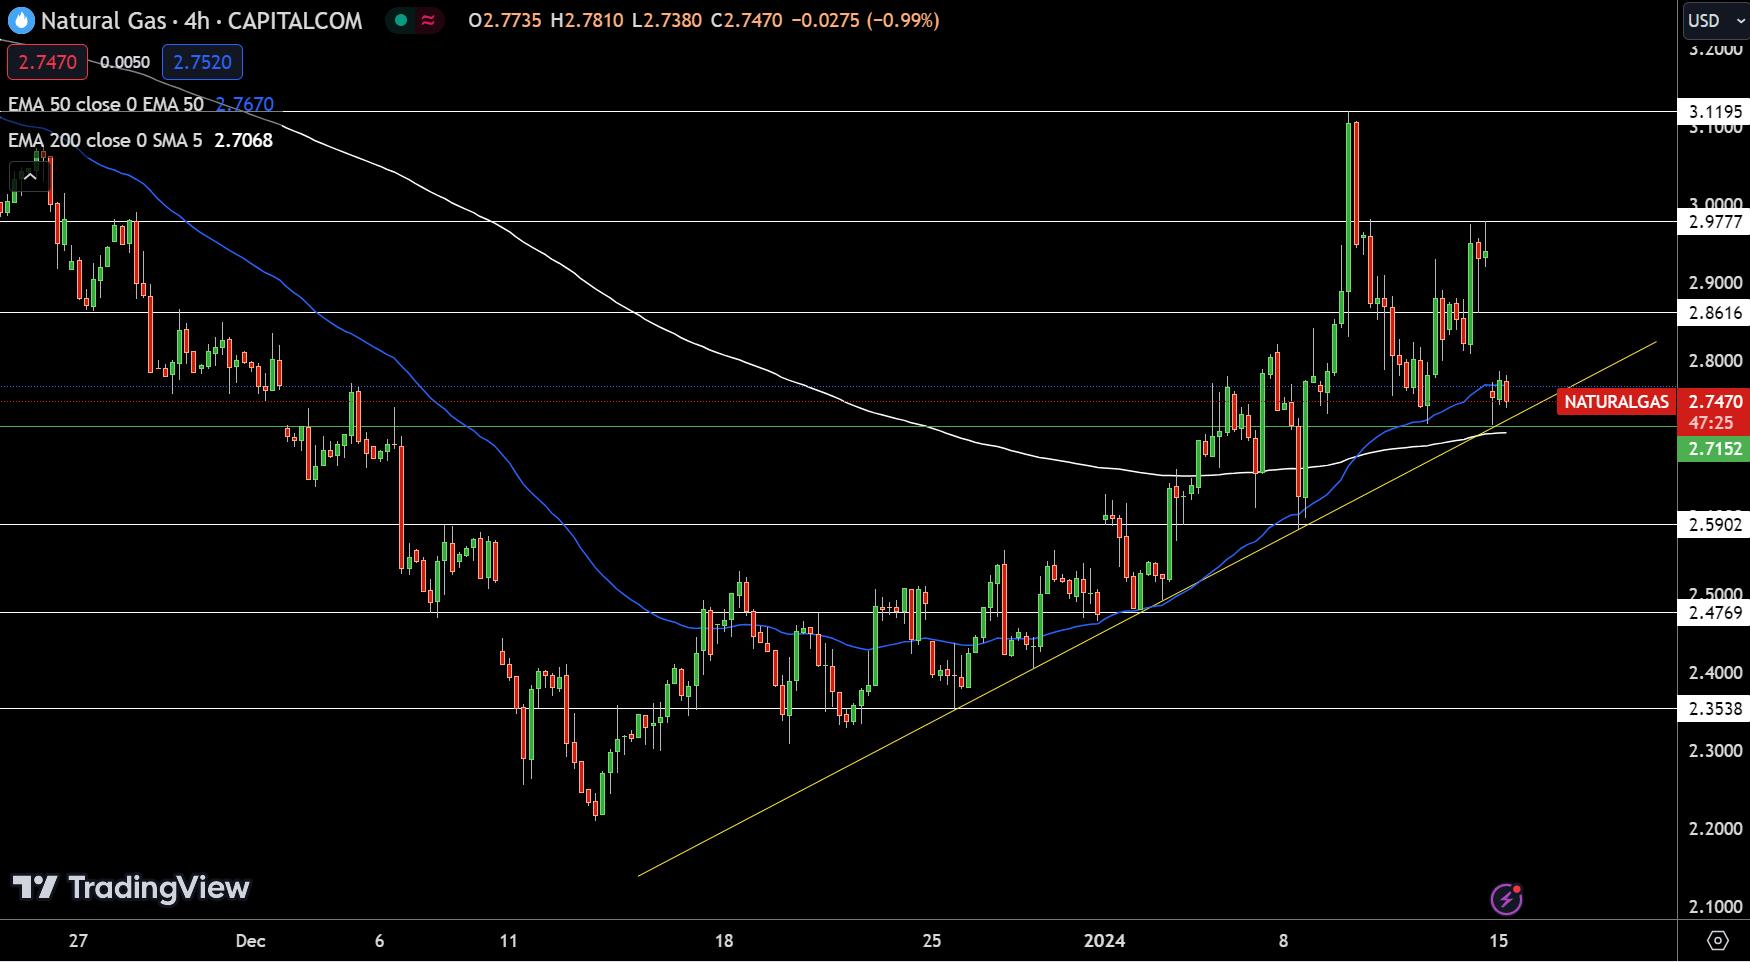
On January 15th, Natural Gas (NG) witnessed a significant decline, dropping 6.19% to $2.74. The 4-hour chart indicates a pivotal point at $2.72. Natural Gas faces resistance at $2.86, with further barriers at $2.98 and $3.12.
On the downside, support levels are found at $2.59, $2.48, and $2.35, which could offer potential relief in case of continued declines. Technical indicators show the 50-day Exponential Moving Average (EMA) at $2.77 and the 200-day EMA at $2.70.
Notably, an upward trendline is providing support near the $2.70 mark. A closure above this level could signal a shift towards a buying trend. Currently, the trend for Natural Gas is bullish above the $2.72 mark.
WTI Oil Price Forecast
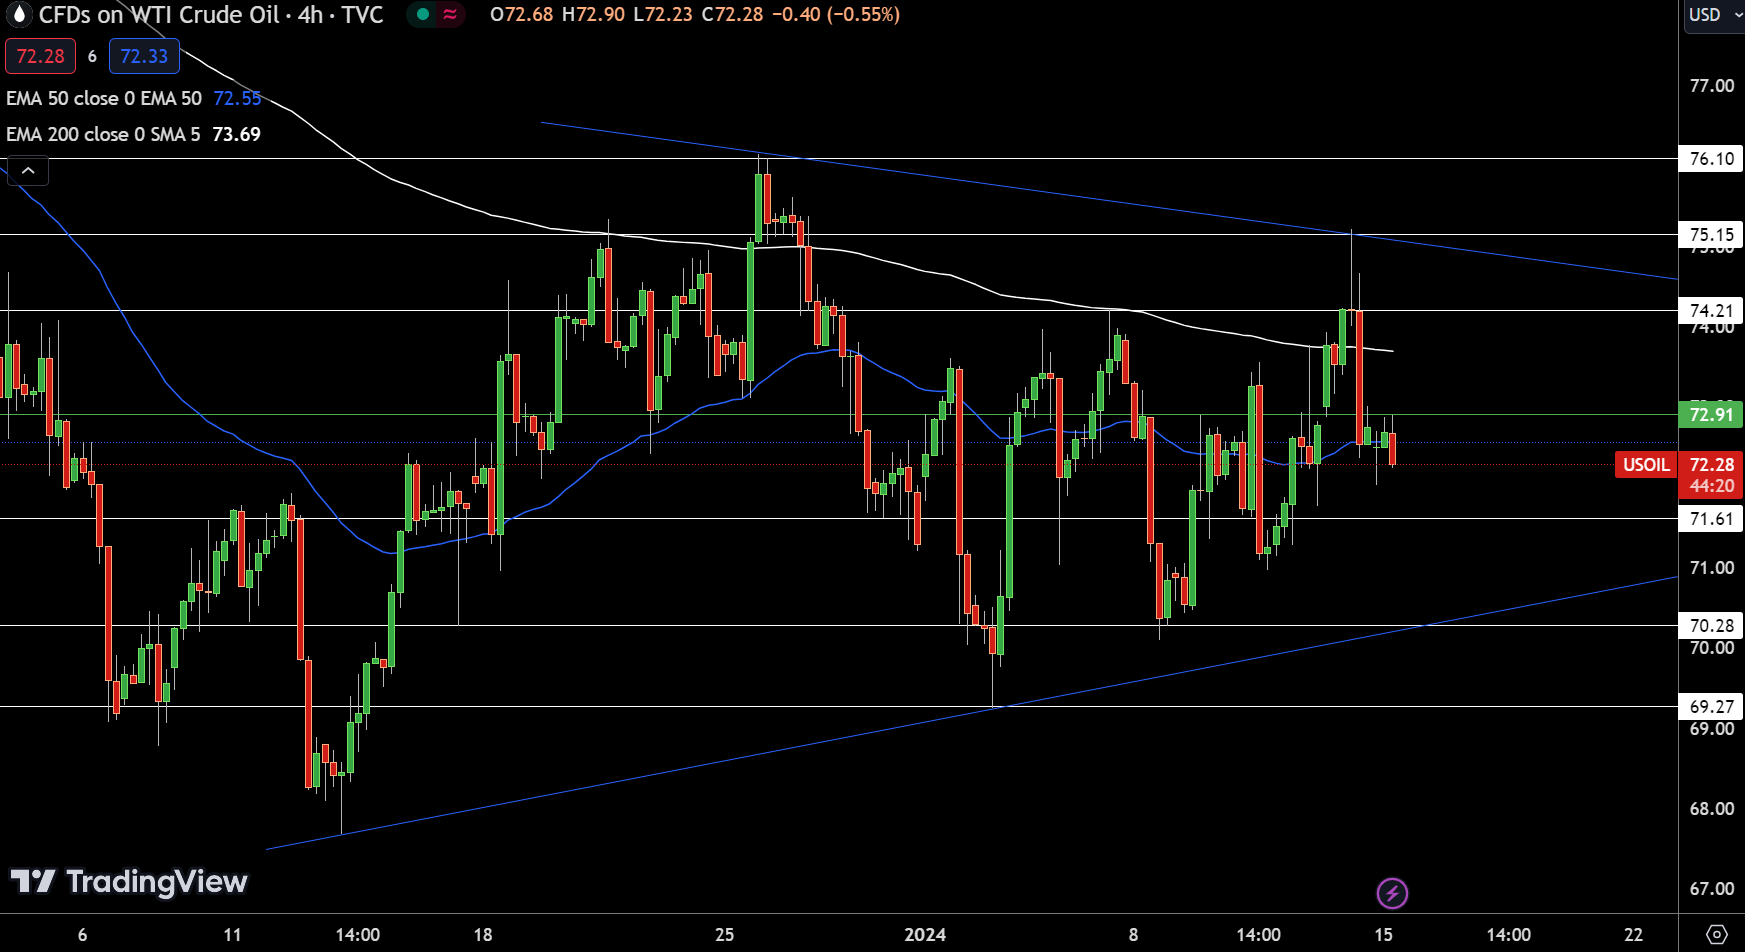
On January 15th, US Oil experienced a slight decline, closing at $72.28, down 0.57%. The 4-hour chart shows a pivot point at $72.91, with immediate resistance levels at $74.21, $75.15, and $76.10. The supports are positioned at $71.61, $70.28, and $69.27.
Technical analysis reveals that US Oil is trading below both the 50-day and 200-day Exponential Moving Averages (EMAs), currently at $72.55 and $73.69, respectively. This positioning suggests a selling bias in the market.
West Texas Intermediate (WTI) closing below these EMAs is indicative of a bearish sentiment. The trend for US Oil appears to be bearish below the $72.90 mark.
Brent Oil Price Forecast
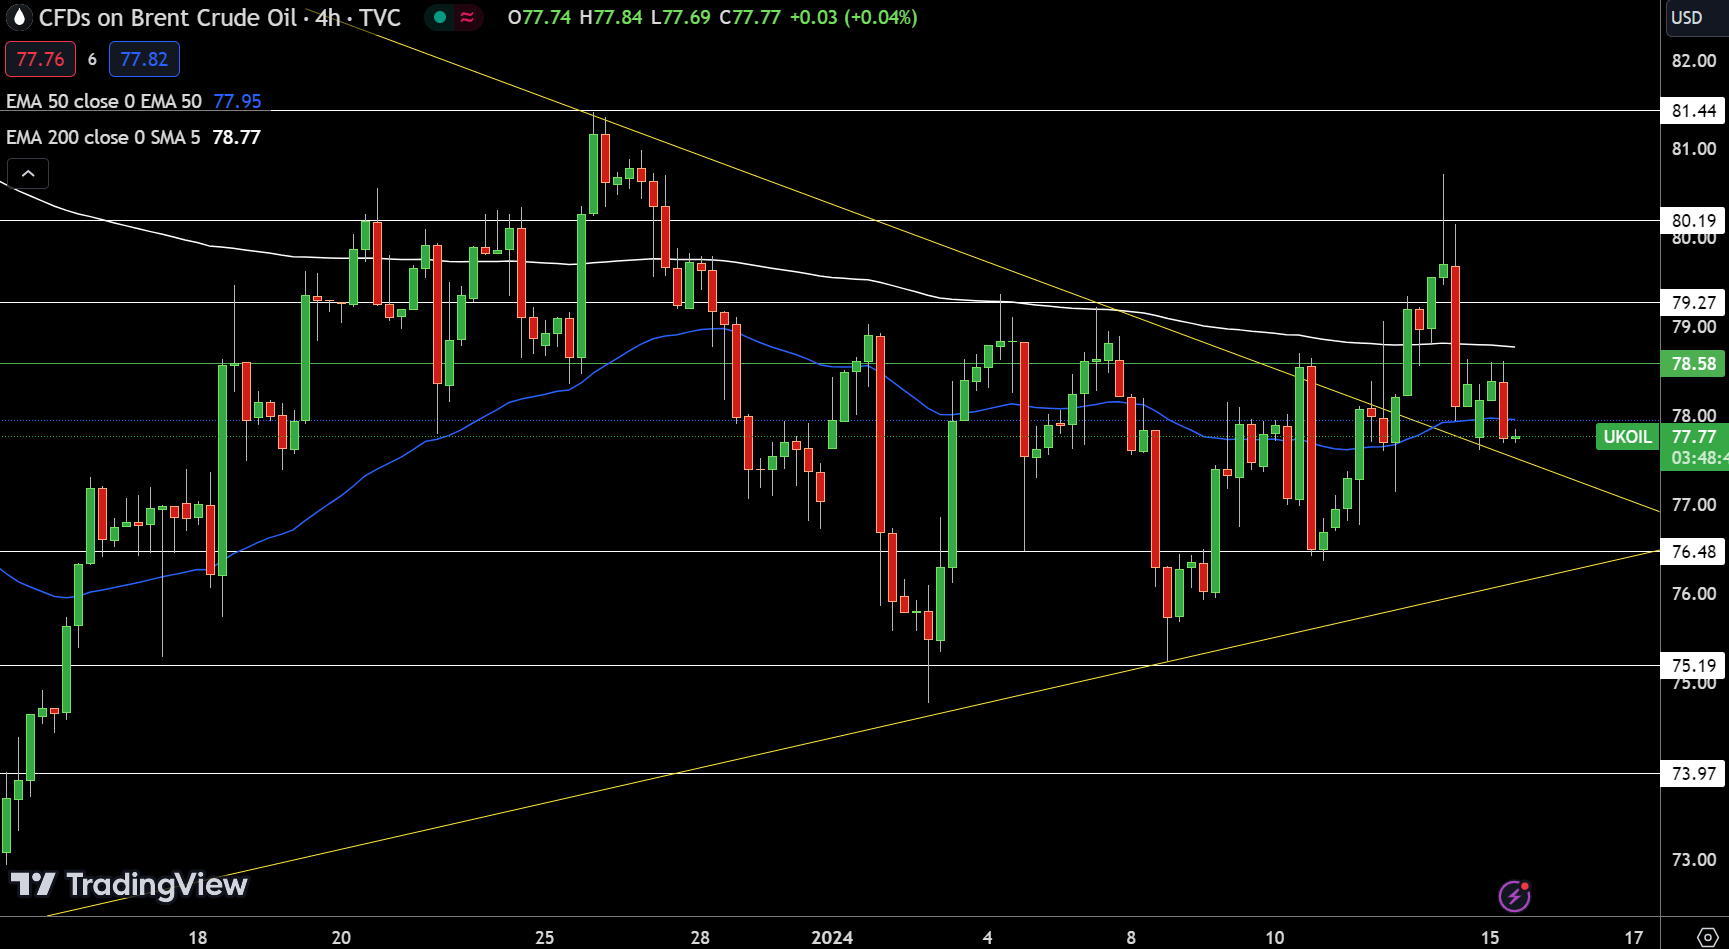
On January 15th, UK Oil registered a slight decrease, closing at $77.77, a drop of 0.43%. Analyzing the 4-hour chart, the pivotal point is established at $78.58. UK Oil encounters immediate resistance at $79.27, followed by higher levels at $80.19 and $81.44.
On the support front, the levels are marked at $76.48, $75.19, and $73.97, delineating potential zones for the price to stabilize or rebound. The technical indicators suggest a cautious outlook. The Relative Strength Index is near the midpoint at 49, neither indicating overbought nor oversold conditions.
The 50-day and 200-day Exponential Moving Averages (EMAs) stand at $77.95 and $77.77, respectively, with UK Oil closing slightly below these averages, hinting at a prevailing selling bias. Conclusively, the current trend for UK Oil appears bearish below the $78.58 threshold.


