Higher Swing Low Strengthens Bullish Setup
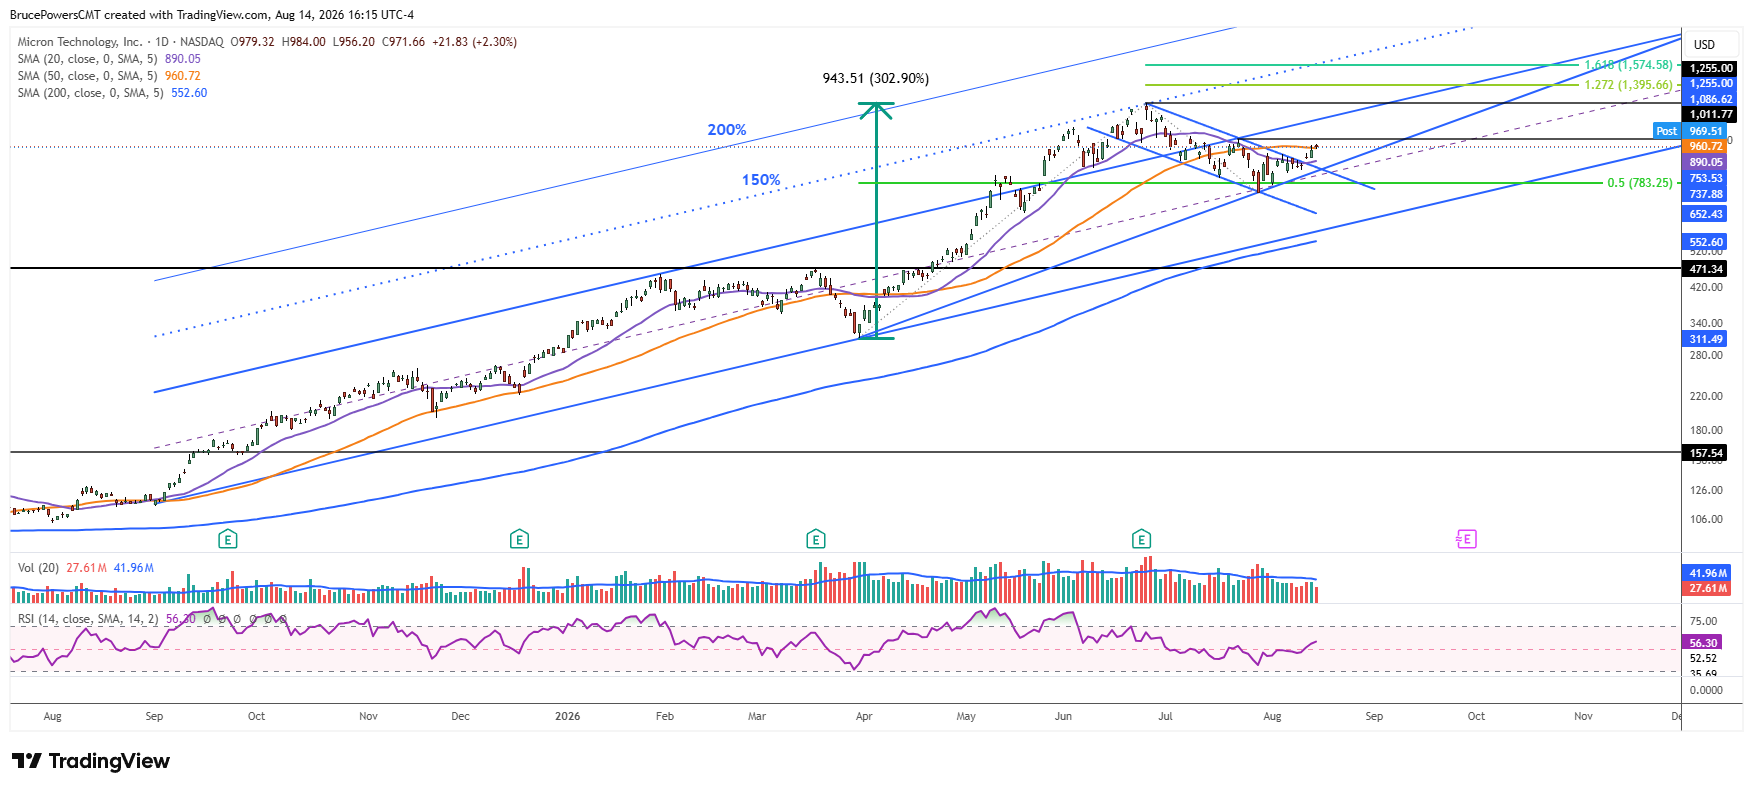
The stock of Micron Technology, Inc. (MU) has continued to strengthen and extend its recovery from a corrective low of $737.88 that was established two weeks ago. That low is now a higher swing low that helps support the bullish trend. MU is showing improving bullish momentum, with the slope of trend increasing, as seen in the steeper slope of new rising trendline. The recent advance from the July low suggests a continuation of this newly defined trend, first toward the recent peak of $1,255 and then, if buyers can remain in control, toward higher potential technical targets.

Channel Support Highlights Underlying Demand
Support during the recent pullback developed at the confluence of the 50% retracement of the prior upswing and the midline of a rising trend channel. Finding support in that price area further confirms improving underlying demand and strengthening momentum. This suggests the potential to eventually test resistance near higher channel targets, represented by the dashed rising trendline. That line is labeled 150% because it represents an extension of the original channel. Resistance at the recent high confirmed the significance of this channel extension and its validity.
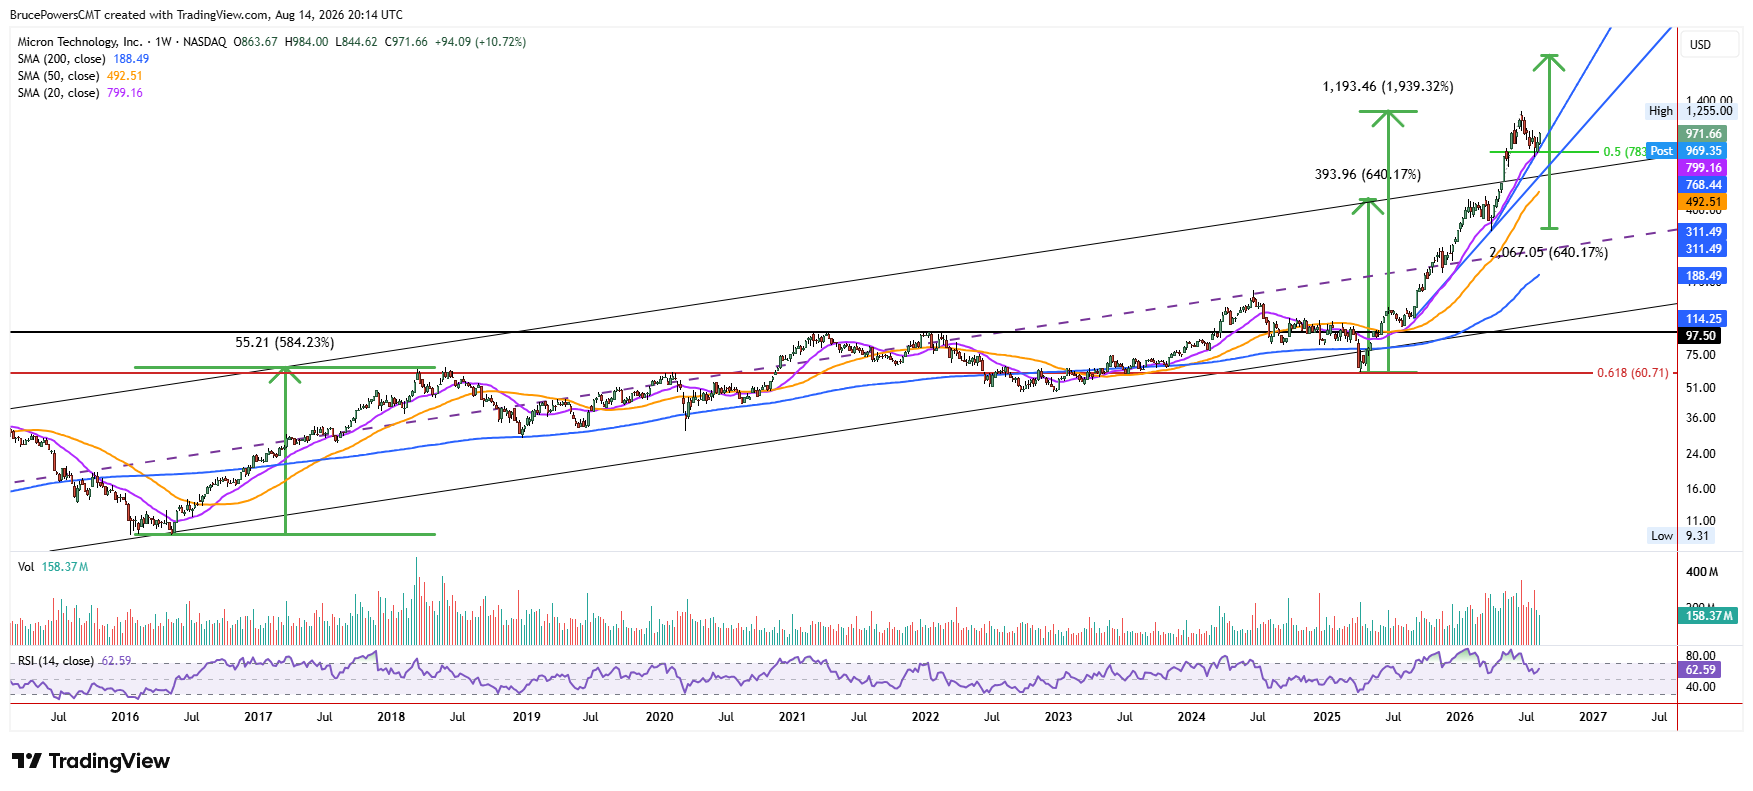
Weekly Chart Confirms Trend Strength
The weekly chart provides a clearer picture of the strength of the trend. Moreover, it further confirms key support near the recent low, as the second test of the 20-week moving average was successful. The prior pullback also bounced from that indicator zone. This week triggered a reversal above a three-week high to reach a five-week closing high of $960.52. That shows a weekly bullish reversal with a higher weekly high and higher low, potentially marking the beginning of a new leg up for MU.
$1,011.77 Becomes Next Bullish Hurdle
In the near term, if MU can reclaim the 50-day moving average near $960.55, which it attempted to do on Friday, and then rise above the recent lower swing high of $1,011.77, higher targets become more likely. Therefore, pullbacks to test support, especially the 20-day moving average near $889.61, should provide further indications of underlying demand. Both the long-term and short-term timeframes are aligned, strongly suggesting that the trend can continue unless key support is broken. That support is defined by this week’s low of $844.62, making that level the key near-term test of whether the strengthening bullish trend can remain intact.