The S&P 500 slipped toward 7,700 after strong US business data pushed the 10-year Treasury yield above 5%. The optimism about AI earnings still supports the index, but higher yields and oil above $100 make further gains harder for the index. In my view, the index needs to hold the 7,500-7,600 support zone before it can recover toward 7,800. This article presents the economic data, market pressures and technical levels that could shape the next move in S&P 500.
Inki Cho, Senior Financial Market Strategist at Exness, commented:
The US economy remains strong, but surging bond yields and oil prices flirting around the 100 USD level mean businesses are facing the double pressures of higher borrowing and energy costs. Simultaneously, strong company earnings continue to give investors confidence. For the time being, the foundational trio of inflation, oil, and interest rates keeps setting the tone.
S&P 500 Outlook: Strong US PMI Lifts 10-Year Treasury Yield Above 5%
The US flash composite PMI increased from 56.0 in August to 58.4 in September. It marked the fourth straight month of faster growth and the strongest reading since July 2021.
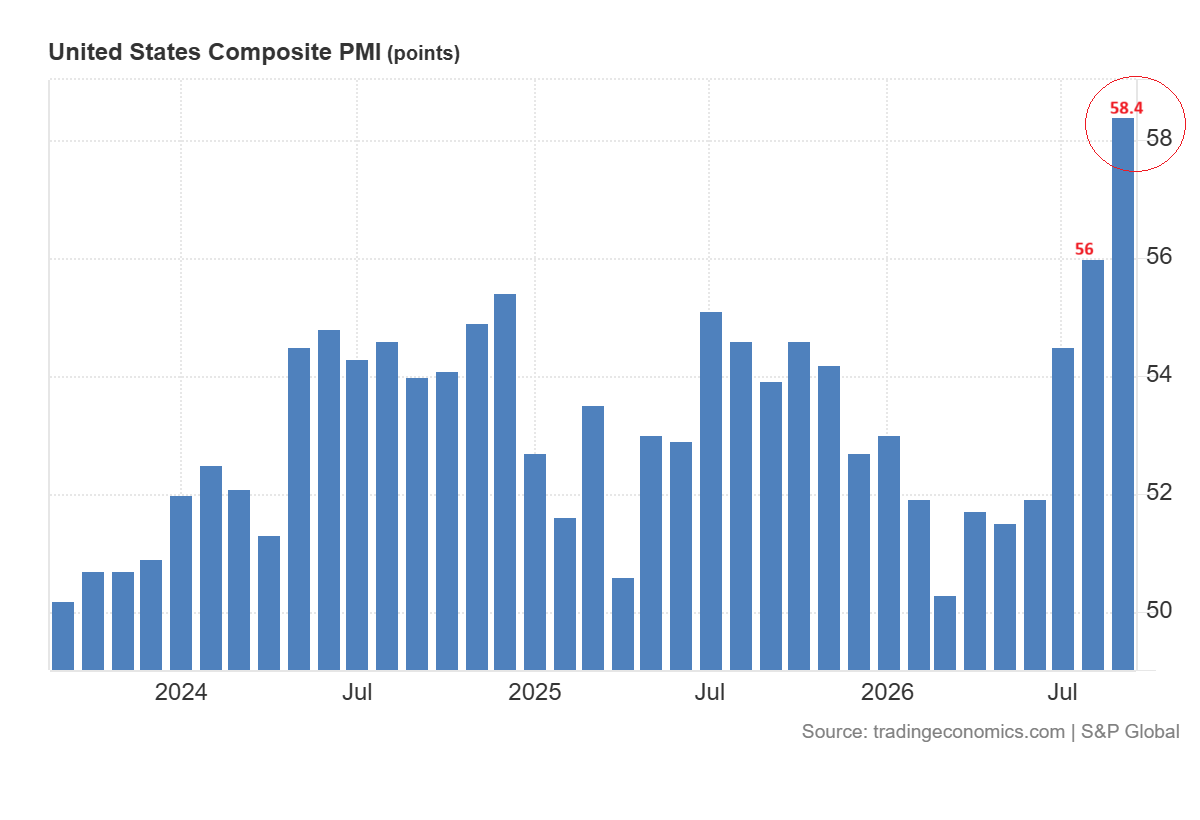
The eurozone composite PMI also increased from 52.0 to 53.1. The strong demand could support US companies to sell more at home and abroad. But US companies reported their fastest increase in cost of input in almost four years. That makes inflation the less welcome side of the growth story.
Treasury yields increased sharply on September 23. The two-year yield climbed from 4.71% to 4.85% while the 10-year yield rose from 4.96% to 5.11%. Both sit above the current target range of the Fed of 3.75%-4.00%. The surge in bond yields gives investors another source of return and raises borrowing costs for companies. In my view, a pullback toward 5% in the 10-year yield is possible. If that level then holds, a move toward 6% becomes a risk in the medium term.
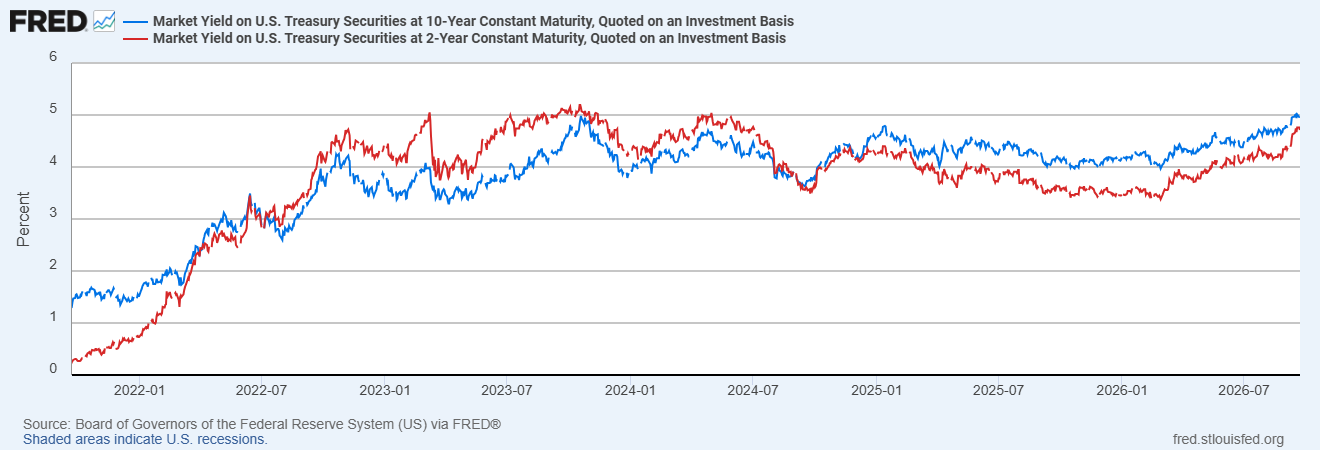
The gap between 10-year and two-year yields stood at 0.26 percentage points on Wednesday, which is slightly wider than the previous day. The latest move did not bring the curve closer to inversion.
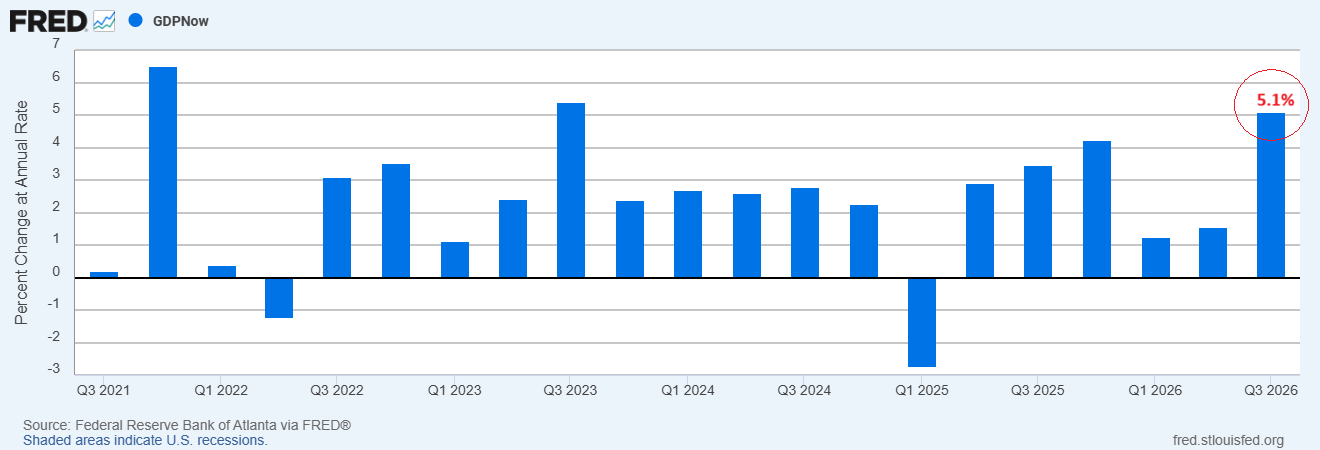
The Atlanta Fed’s GDPNow model estimated Q3 real growth at a 5.1% annual rate compared with 1.5% in Q2. That estimate was last updated on September 17 before the new PMI report.
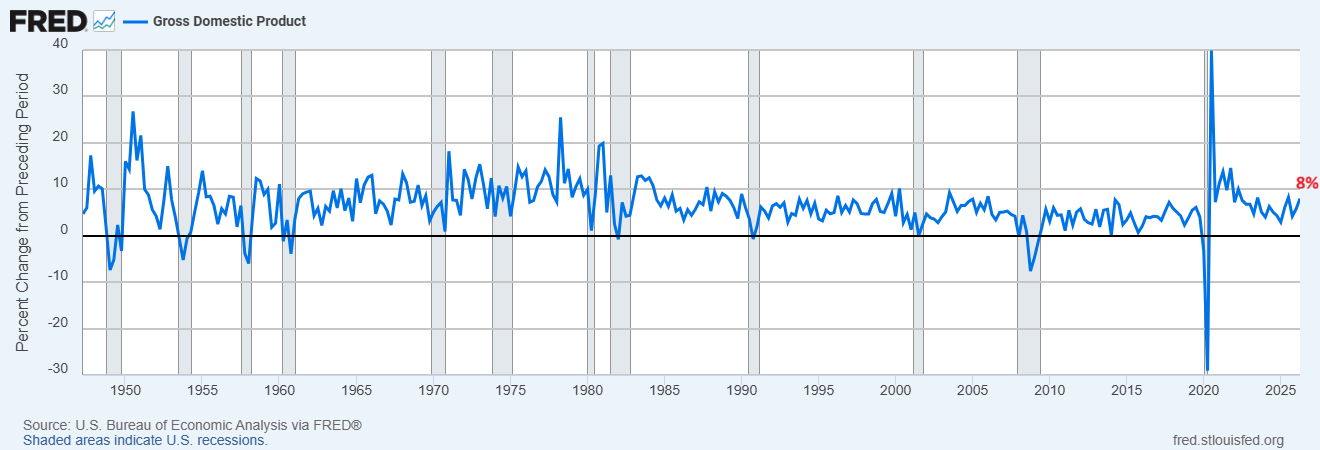
The chart below shows that the Q2 nominal GDP growth was 8.0%. This growth can further accelerate if output and prices accelerate.
The S&P 500 has slipped back toward 7,700 due to the breakout in the 10-year Treasury yields above 5%.
S&P 500 Price Forecast
Every new S&P 500 analysis as it publishes, today's technical signal and key levels, live price — on one page.
See all S&P 500 forecastsS&P 500 Fundamentals: AI Stocks Face Higher Yields and $100 Oil
AI remains the important source of earnings optimism. But this support might be uneven in the short term. Alphabet dropped over 3%, Amazon lost 2.2% and Nvidia declined nearly 1.5% on Wednesday. Meta gained nearly 1% after investors responded well to the “Muse” AI assistant, but it fell in early premarket trading on Thursday.
The S&P 500 trades at just under 19 times expected earnings. Companies will need to deliver on those earnings expectations if bond yields stay high.
The oil market adds pressure to the US stock market. Brent oil rose above $100 a barrel as the tensions between the US and Iran continue. Energy shares gained on Wednesday while airlines and cruise operators weakened in premarket trading on Thursday.
The expensive fuel can lift transport costs and squeeze profit margins. It can also keep inflation high enough to prompt another increase by the Fed. The expectation of a rate hike by the Fed has increased to 71% after the US business data.
Federal borrowing gives investors another reason to watch yields. Gross US debt has passed $40 trillion and the fiscal-year deficit had reached $1.97 trillion by August.
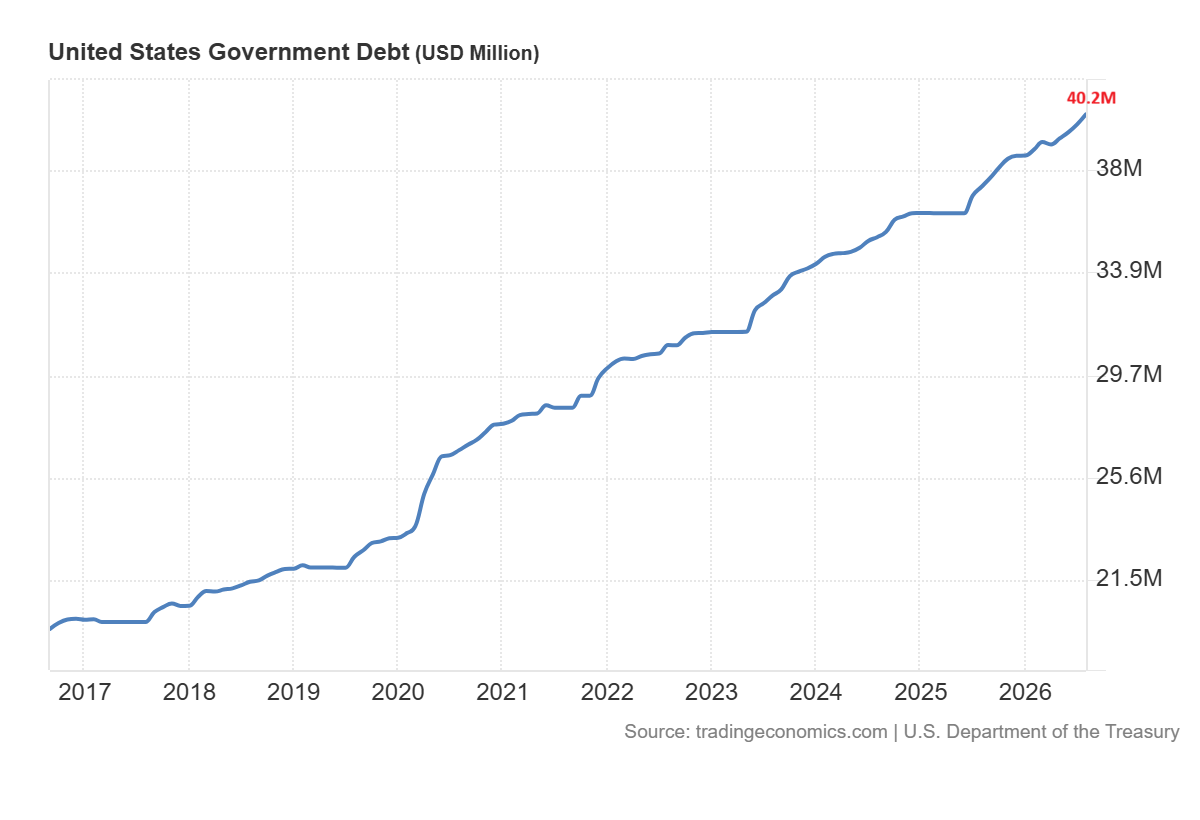
The high yields gradually increase interest costs as debt is refinanced. Meanwhile, investors await details from the Trump-Xi talks even after the two countries agreed to extend their trade truce. In my view, a drop in oil prices and a correction in 10-year yields below 5% would provide strength to break the S&P 500 above 7,800. If yields continue to rally, then the support zone of 7,500-7,600 will face a harder test.
S&P 500 Technical Analysis: 7,500 Support and 7,800 Resistance
The outlook for the S&P 500 remains bullish and constructive in the long term as seen in the daily chart below. The index has broken above the 50-day SMA at 7,600 and pushed toward the record high near 7,800.
The rebound from 7,500 toward 7,800 still shows constructive price action. Therefore, a break above 7,800 will indicate a quick move toward 8,000. However, the surge in US Treasury yields above 5% is creating pressure on the S&P 500 below 7,800.
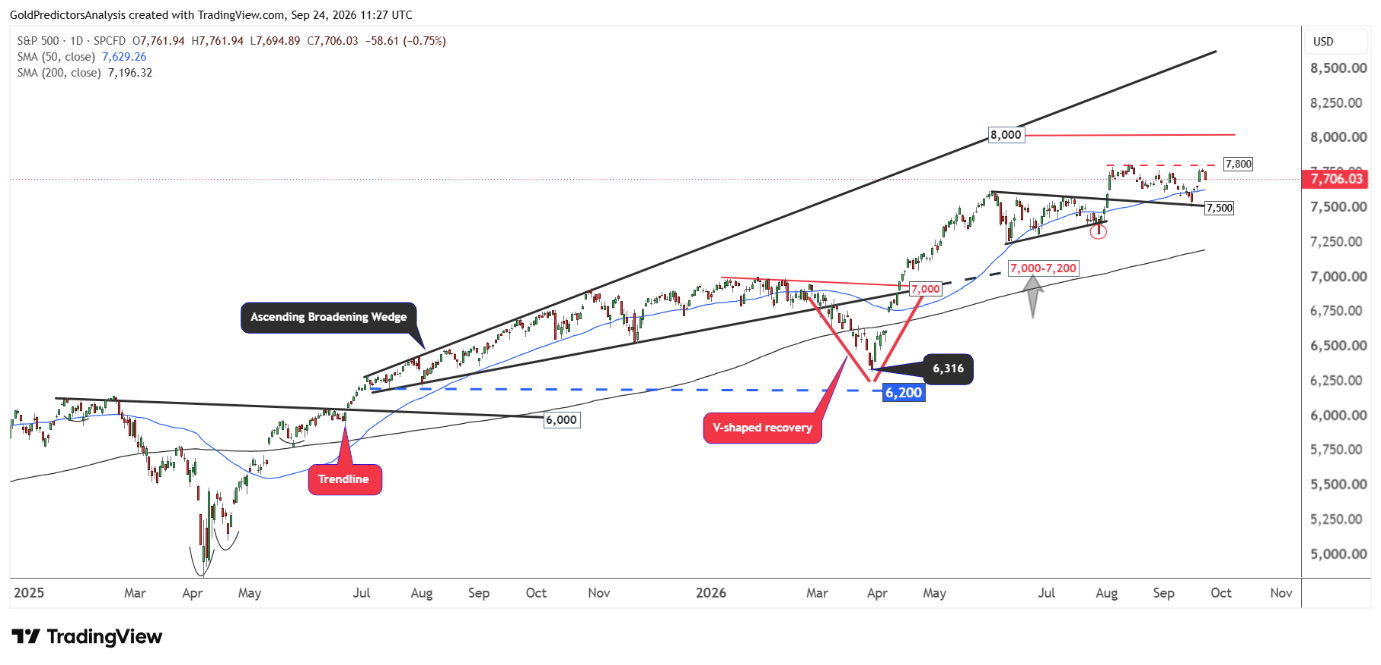
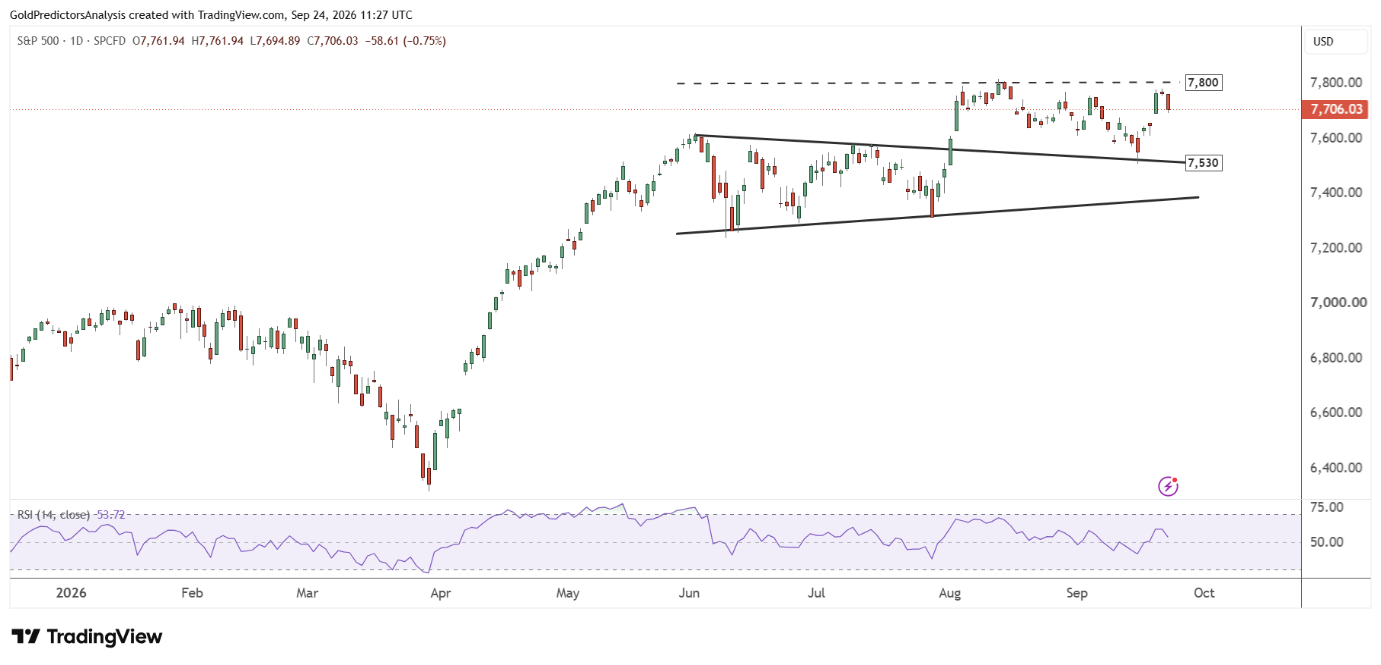
A break below 7,500 will signal a drop toward 7,200-7,300 in the short term. This zone is considered strong support for the S&P 500. The formation of an ascending broadening wedge after the inverted head and shoulders pattern suggests constructive price action. But the market volatility remains high.
Another chart below shows the strong consolidation in the S&P 500 in the short term. The chart shows that the index remains well above the 50- and 200-day SMAs. The immediate support remains at 7,530, while immediate resistance is at 7,800. The RSI remains well above the midline, which indicates positive price action in the short term.
What to Watch Next for the S&P 500
The business activity in the US and earnings from AI support the S&P 500, but the breakout in 10-year US Treasury yields above 5% makes further gains harder for the index. The 10-year Treasury yield above 5% raises borrowing costs, while Brent above $100 adds pressure to company margins and inflation. In my view, the index will have a better chance to recover if both oil prices and yields ease.
The S&P 500 needs to break above 7,800 to open a path toward 8,000. Until then, the index may find support around the 7,500-7,600 zone. A break below 7,500 could send the index toward 7,200-7,300. The outlook for the S&P 500 remains constructive in the long term, but buyers need to hold support while the bond market settles.