Stall Caps Recent Ascent
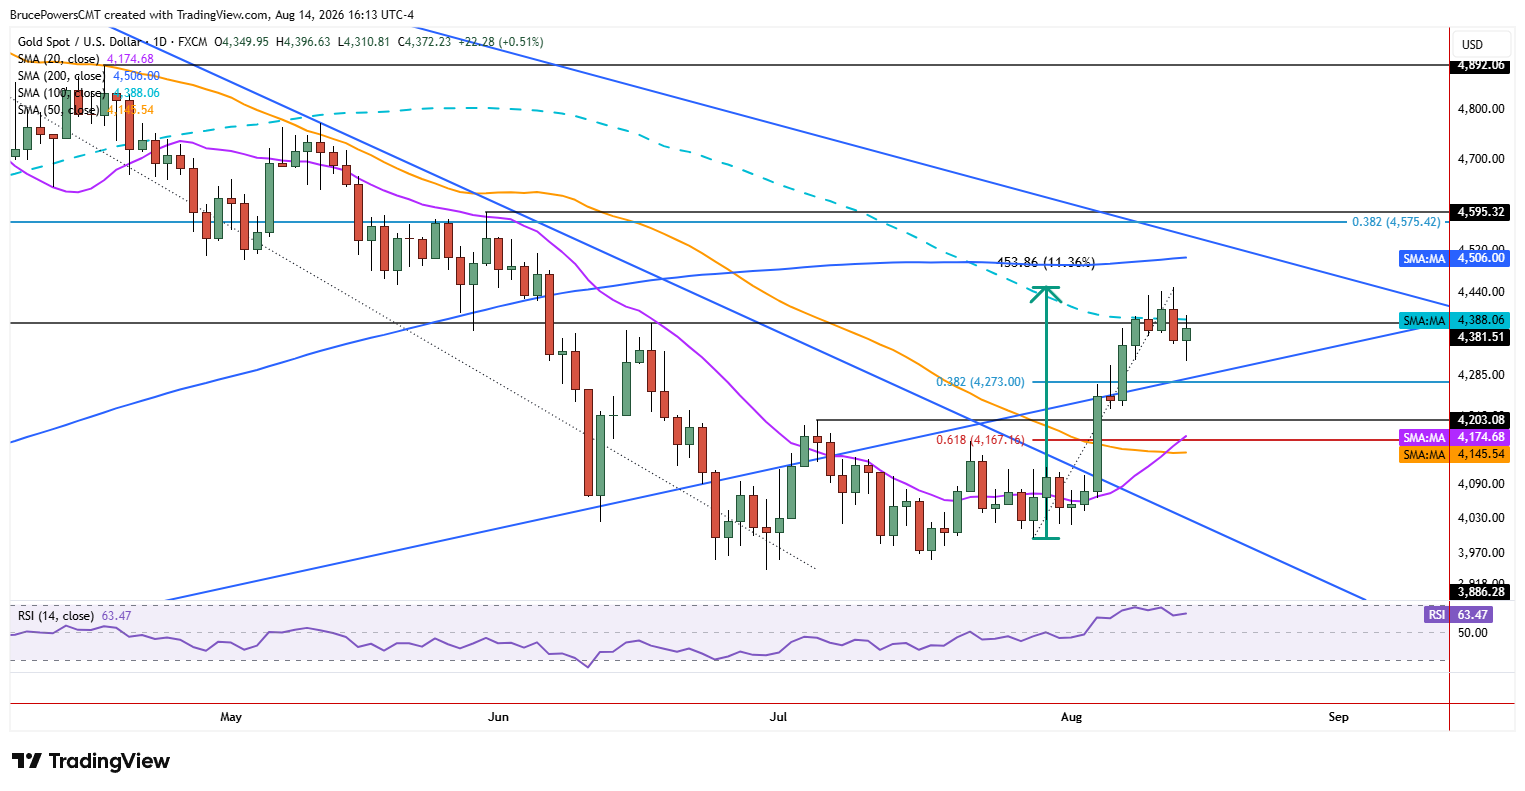
Gold stalled its ascent with a high of $4,450 this week, while it attempted to reclaim the 100-day moving average and confirm a bullish reversal signal that triggered above the lower swing high at $4,382. Although gold dropped to a five-day low of $4,311 on Friday, buyers took back control from that low and drove price higher intraday. At the time of writing, trading continues near the $4,396 lower daily high for the day, and gold is set to close positive for the session.

Resistance Test Flags Weakening
The session’s high was a successful test of resistance at near the 100-day moving average. That is a sign of weakening since the prior three days traded both above and below the moving average. There is a one-day sign of strength from Friday, but the picture shows weakening. This suggests that lower prices may be tested as support, starting with the rising trendline. There is also the 38.2% Fibonacci retracement at $4,273 that is nearby the trendline.

Support Zones for Bulls
That is the first line of defense for the bulls. However, since gold had advanced by a healthy 11.4% advance when measured from the most recent swing low to this week’s high. A deeper pullback would not be unwarranted and may better build momentum for another leg up. Recent bullish signals now provide potential support area below the initial Fibonacci retracement. The lower swing high near $4,203 is key since a rise above it triggered a reversal of the downtrend structure.
Deeper Levels Remain in Play
The 61.8% retracement is at $4,167. Along with the rising 20-day moving average at $4,175 and the 50-day moving average at $4,146, further validate potential support in that area. The relationships to the 50-day moving average is key since it was confirmed several times as resistance since March. At the same time, if it is reached, the chance for a bullish recovery strengthens. For now, the potential upside remains near the 200-day moving average at $4,506.
If you’d like to know more about how to trade gold and silver, please visit our educational area.