The S&P 500 remains near the record high while the Dow Jones Industrial Average continues to hold above key support. The softer inflation and weak job growth have reduced fears of another Federal Reserve rate hike. But the rising Treasury yields and the growing budget deficit create fresh risks. The latest tariffs by President Trump also add uncertainty for companies that depend on imported technology and components.

Trump Drone Tariffs Raise Supply Chain and Inflation Risks
President Trump has now introduced new tariffs on drones and drone parts. This plan includes 100% tariff on large drones. This includes drones that have thermal imaging capabilities. The tariff of 25% will be applied to smaller drones and components. The qualifying imports from U.S. allies will be charged lower rates.
The administration wants to reduce the U.S. reliance on foreign drone technology. It also intends to promote investment in the domestic production. This policy has already supported some of U.S. drone makers. But the companies importing drones or parts into the country may be charged more. Some of these costs may be passed back to consumers and the businesses.
The broader impact on the stock market might be limited as the drone sector has small weightage in major indices. But the move indicates that Trump is still employing sector specific tariffs, which creates uncertainty in global supply chain. It could also help to spread the inflation if similar measures spread to other sectors of the economy.
U.S. CPI Inflation Cools as Treasury Yields and Budget Deficit Rise
The headline CPI inched up 0.1% in July while core CPI jumped 0.2%, according to the Bureau of Labor Statistics. The annual rate of headline inflation dropped to 3.4% from 3.5%. The core inflation rate also eased from 2.6% to 2.5%. These numbers reduced the immediate pressure on the Fed to raise the interest rates.
S&P 500 Price Forecast
Every new S&P 500 analysis as it publishes, today's technical signal and key levels, live price — on one page.
See all S&P 500 forecasts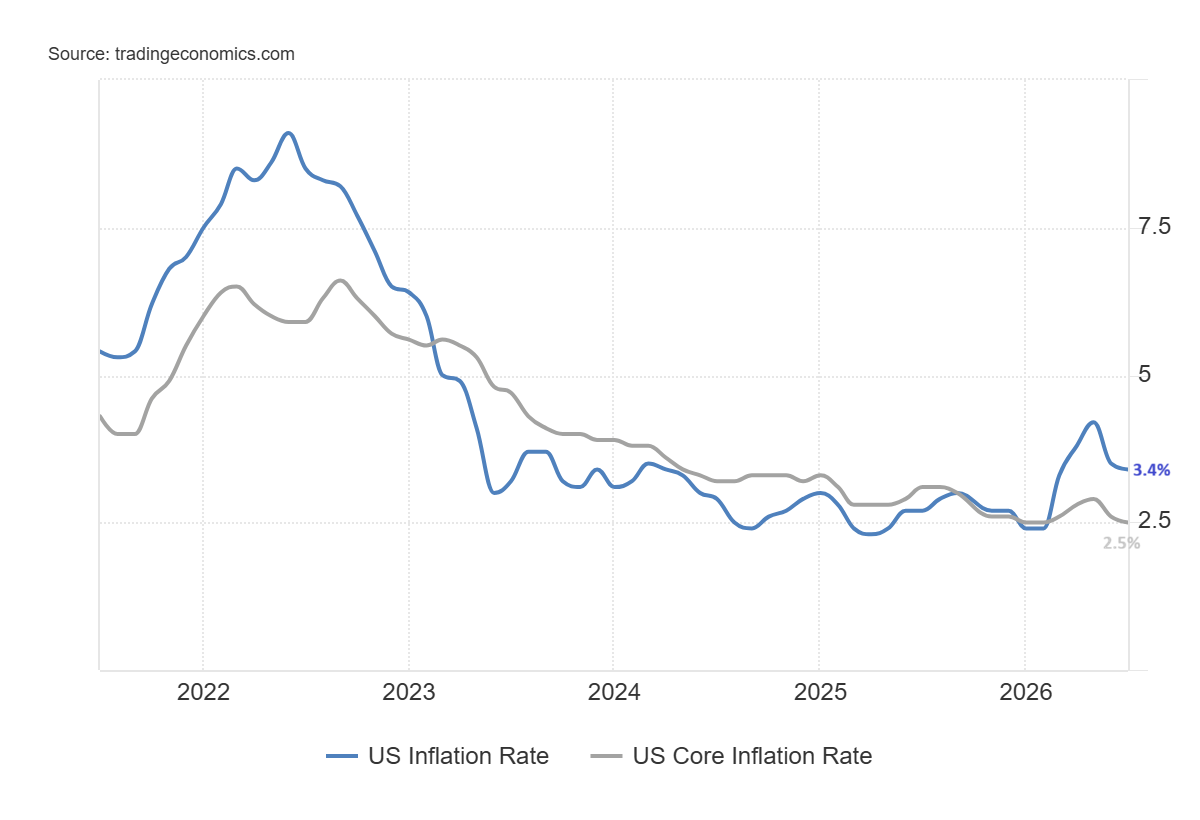
The energy numbers have attracted some attention. As per the report, the gasoline prices dropped 2.9% for the month. The electricity price went up 0.1% in July and 4.2% on year on year basis. But the AAA data showed increased prices in gasoline and diesel during the month.
The political pressure has also increased scrutiny of the BLS. President Trump fired the former commissioner Erika McEntarfer in 2025 after weak employment report and large revisions. This decision raised concerns about the political influence over official statistics. But it does not prove that latest CPI data is inaccurate. The July 2026 labor report showed loss of 23,000 jobs. The unemployment rate dropped to 4.1%. This was partly caused by people leaving the labour force. The soft inflation and weak hiring reduce the likelihood of rate hike in September.
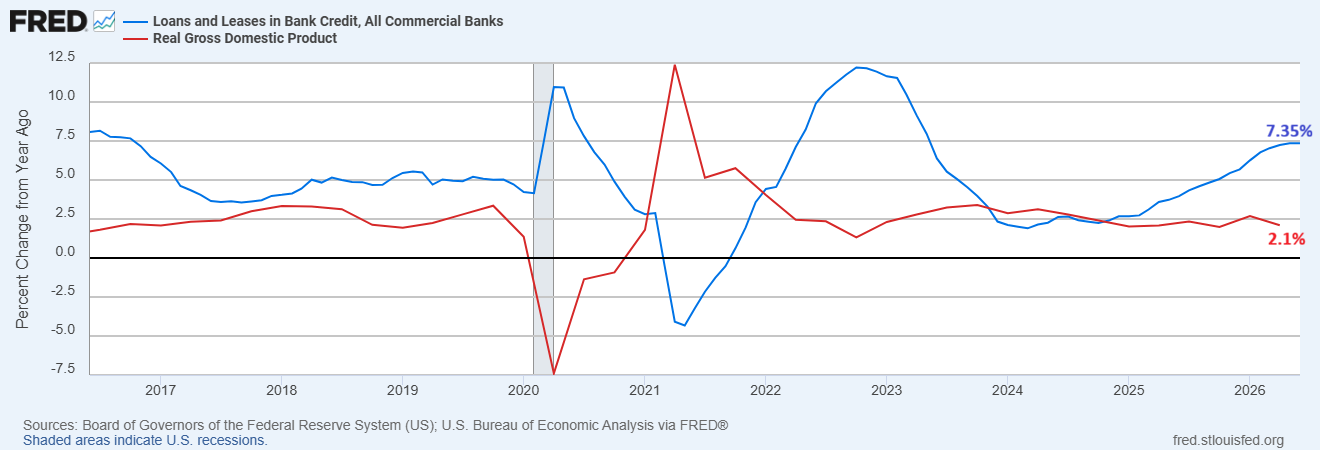
But other indicators suggest further inflation and interest rate risks. The chart below shows that the loans and leases in bank credit increased 7.35% over the year in June. This was significantly higher than the growth rate of real output. The real GDP growth was 2.1%. This implies a monetary inflation of 5.25%.
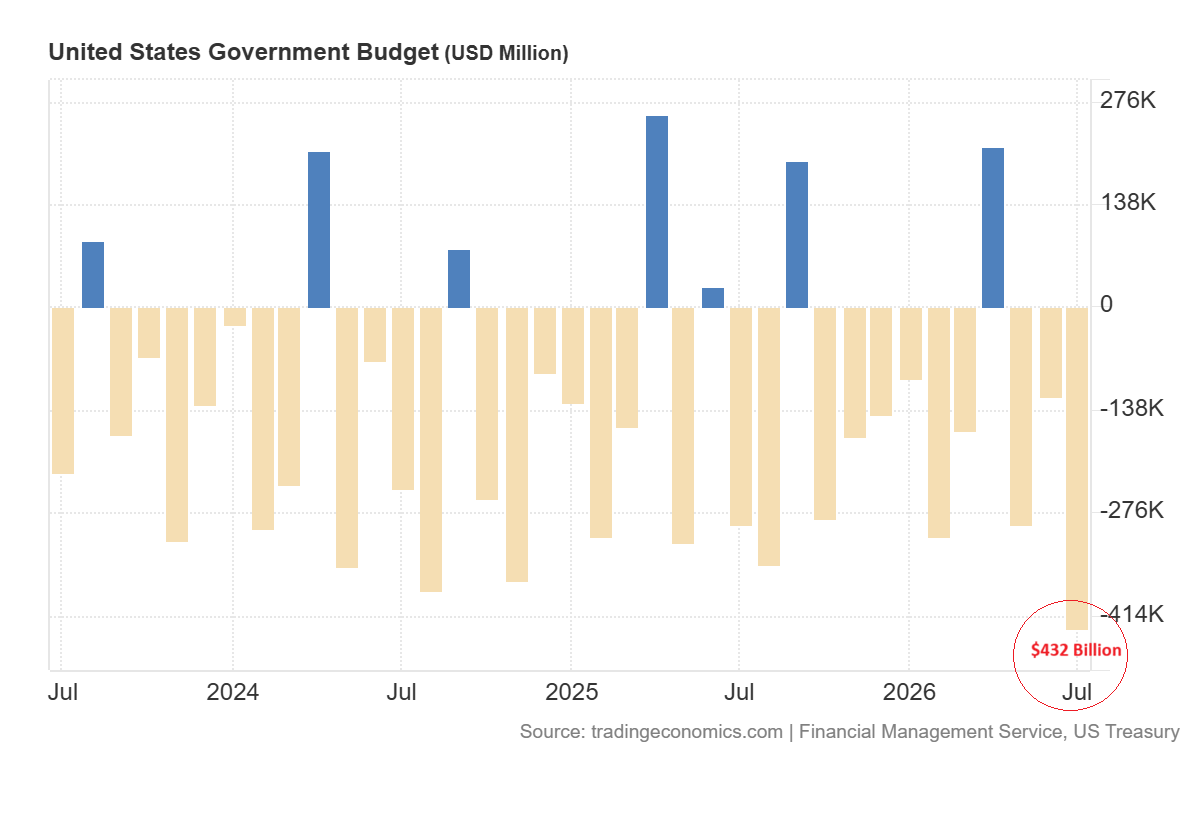
In the meantime, the U.S. budget deficit in July was $432 billion. The first 10 months of the fiscal year saw the deficit climb close to $1.8 trillion. These fiscal pressures have led to increase in long term borrowing costs. The 10-year Treasury is inching close to 4.7% and the 30-year is close to 5.24%.
S&P 500 Forecast: Break Above 8,000 Targets 8,500
Cooling inflation supports the S&P 500 by reducing the chances of another rate hike. This is particularly good for tech and other highly valued growth stocks. The index is also supported by strong earnings. But if long term interest rates begin to rise, it may slow further increases in value because it will adversely affect the value of future profits.
From technical perspective, the S&P 500 presents a strongly bullish and constructive pattern. The index points towards the target of the 8,000 level as discussed in the previous analysis. The index has broken the price compression pattern from June and July and is now moving higher.
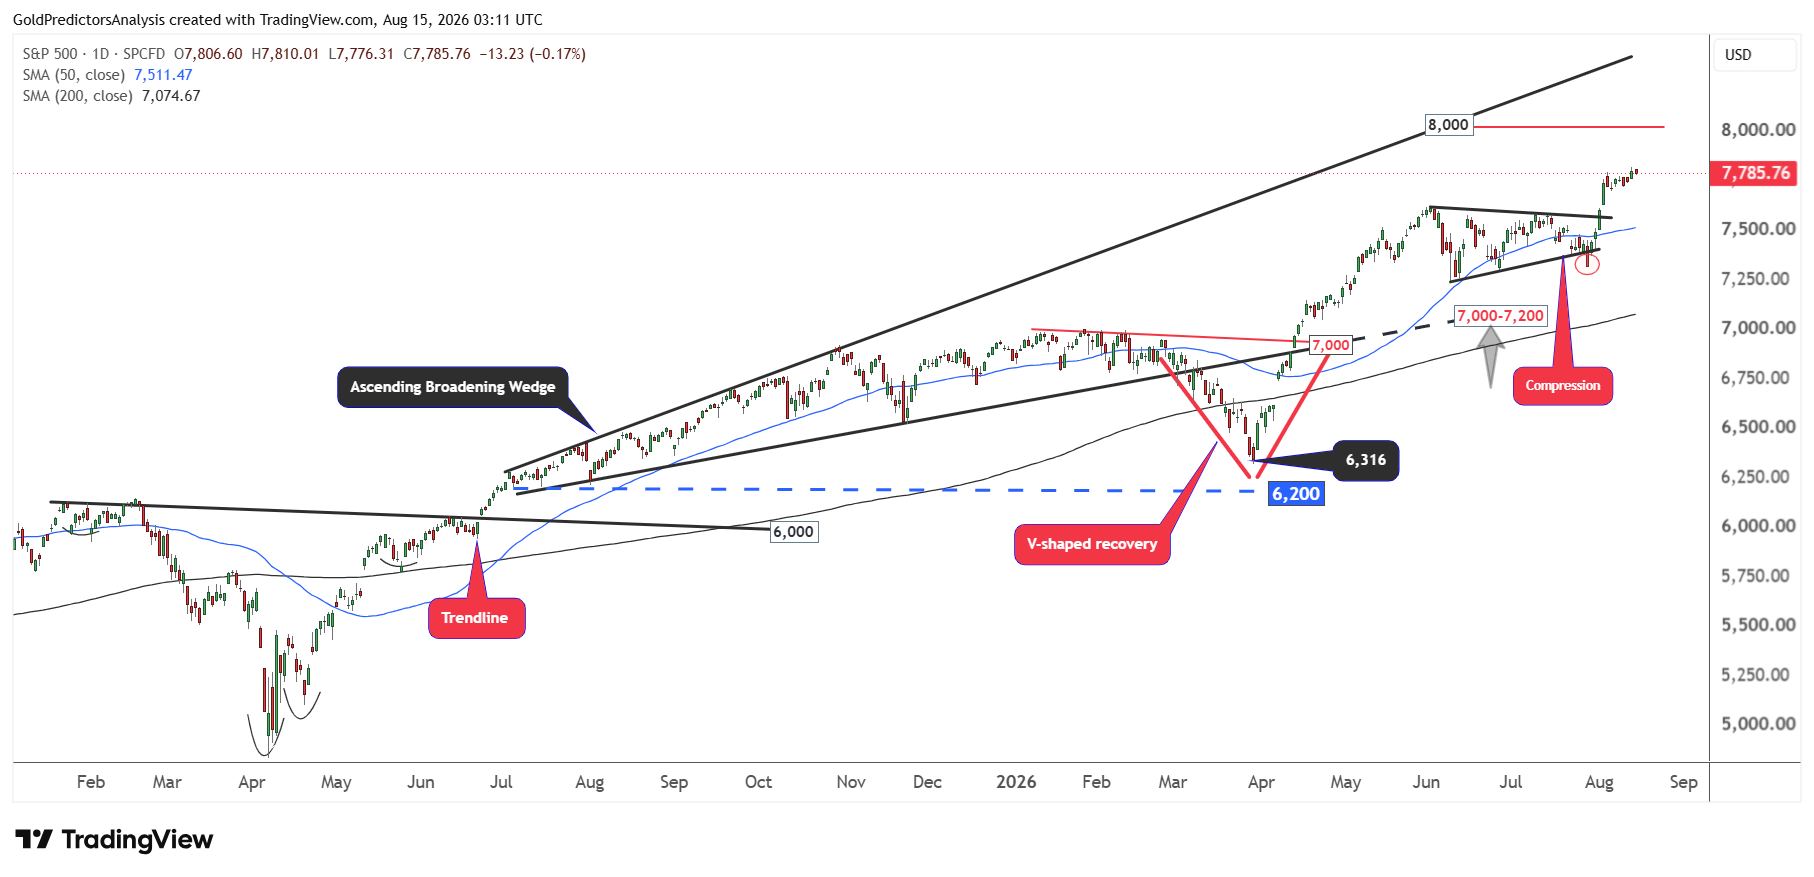
The immediate support in the S&P 500 remains at the 7,620 level. As long as the index remains above this level, the next move towards the 8,000 level might be quicker. The emergence of a V-shaped recovery and an ascending broadening wedge pattern indicates that a break above the 8,000 level will likely open the door for a strong move towards the 8,500 level. But a break below 7,620 will slow down the bullish momentum and open the door for a drop towards the 7,200 levels.
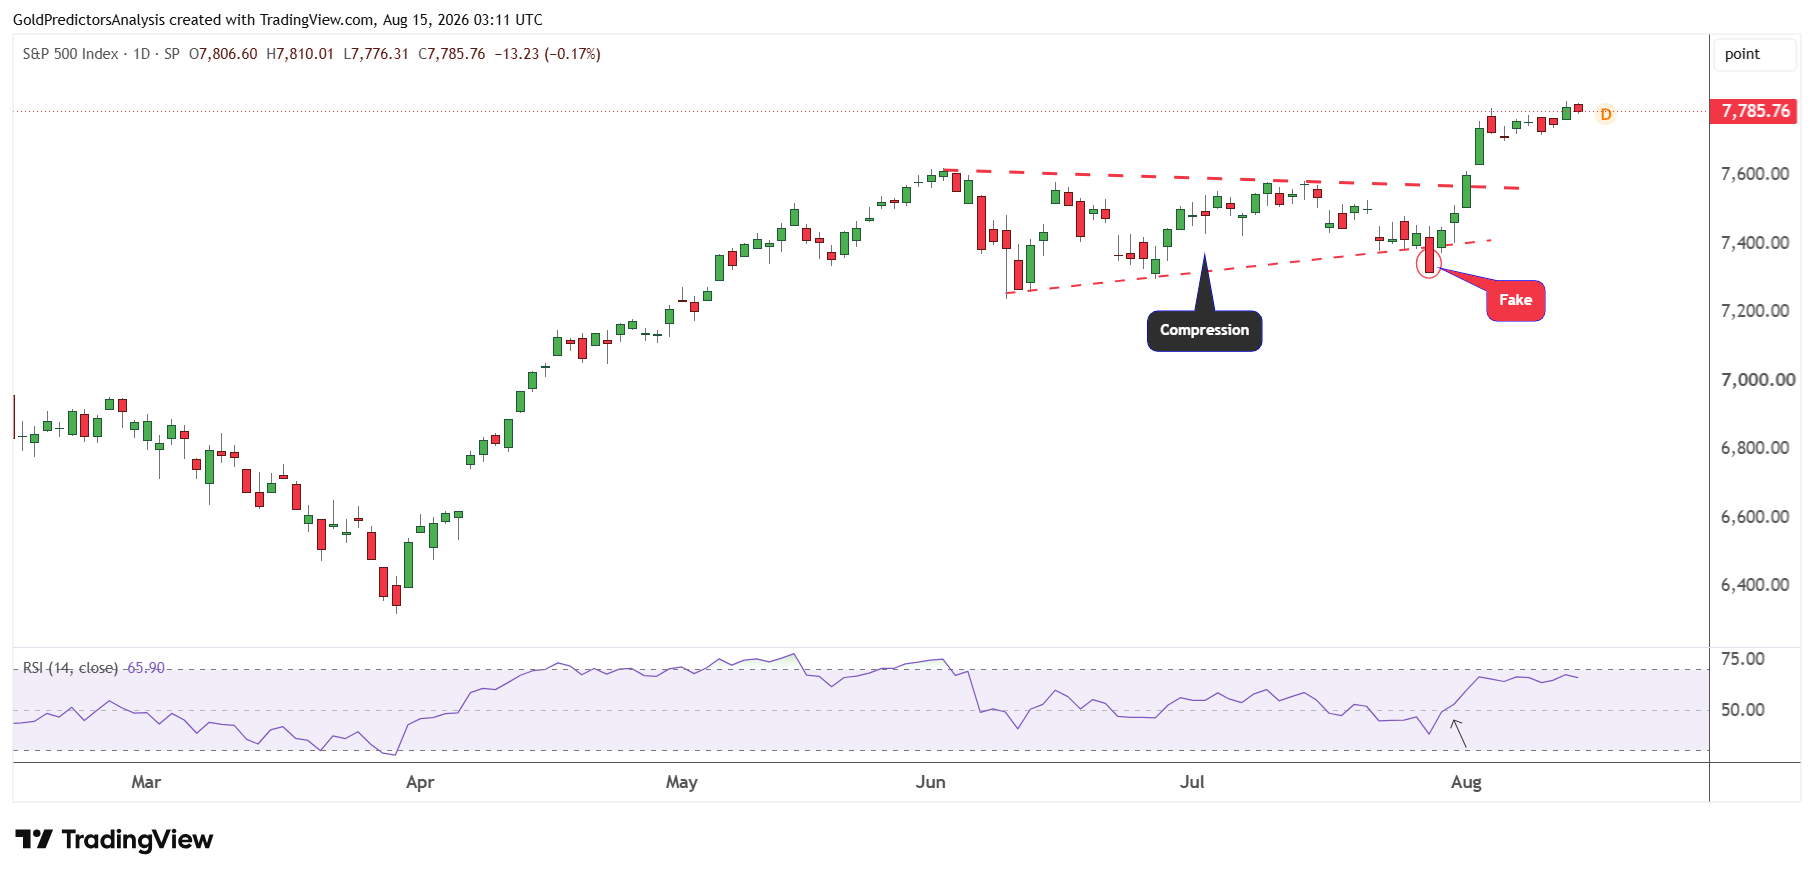
The chart below further shows the breakout from the price compression. The chart shows that this breakout developed on 3 August 2026. After the breakout, the index immediately reached a high of 7,793 on 5 August 2026 and is consolidating below this level in the short term. This narrow range consolidation further highlights the strength and increases the possibility of a strong surge towards the 8,000 level.
Dow Jones Forecast: Break Above 55,000 Targets 56,600
The tariffs may put little pressure on the Dow Jones as many of the industrial and consumer companies have global supply chains. The increase in import costs could put pressure on their margins. The new drone policy could be more positive for domestic defense and manufacturing firms but is not likely to boost the overall index.
The Dow Jones Industrial Average also shows strong bullish momentum as the index formed constructive price action from December 2024 to August 2025. This pattern is called an inverted head and shoulders pattern.
After the breakout from this inverted head and shoulders pattern in August 2025, the price formed broadening wedge pattern, which points towards the target of the 56,600 level. My target of 55,000 in the Dow Jones that I called a few months ago has been reached. But the index is showing constructive price action below 55,000 that suggests another breakout higher.
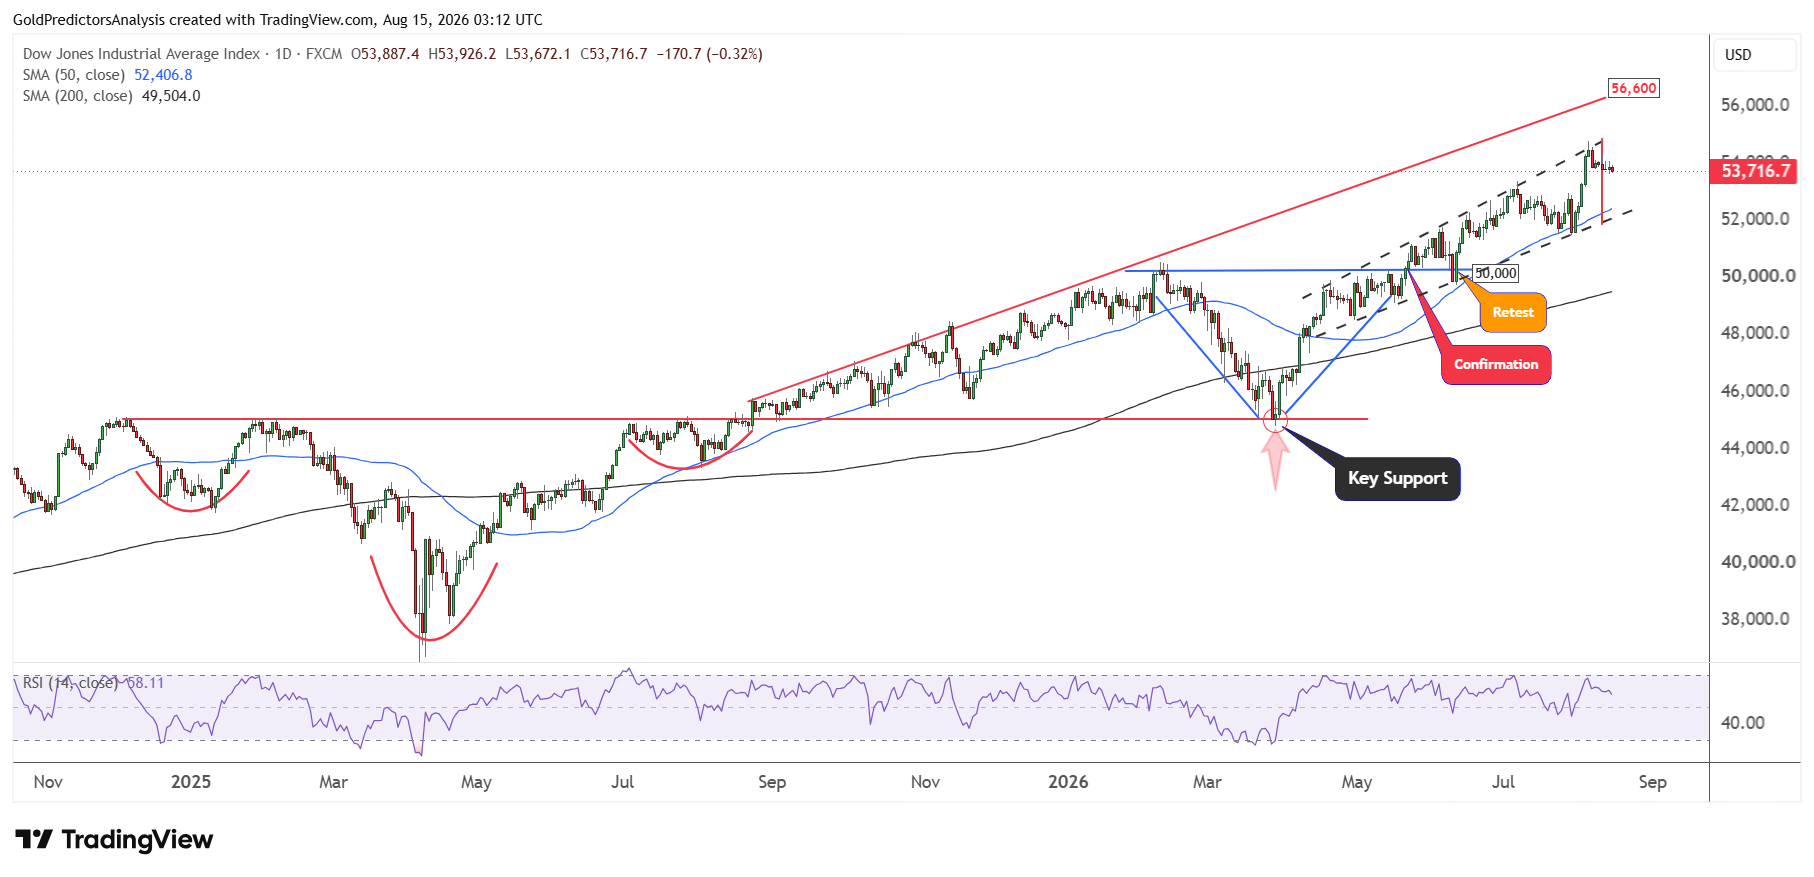
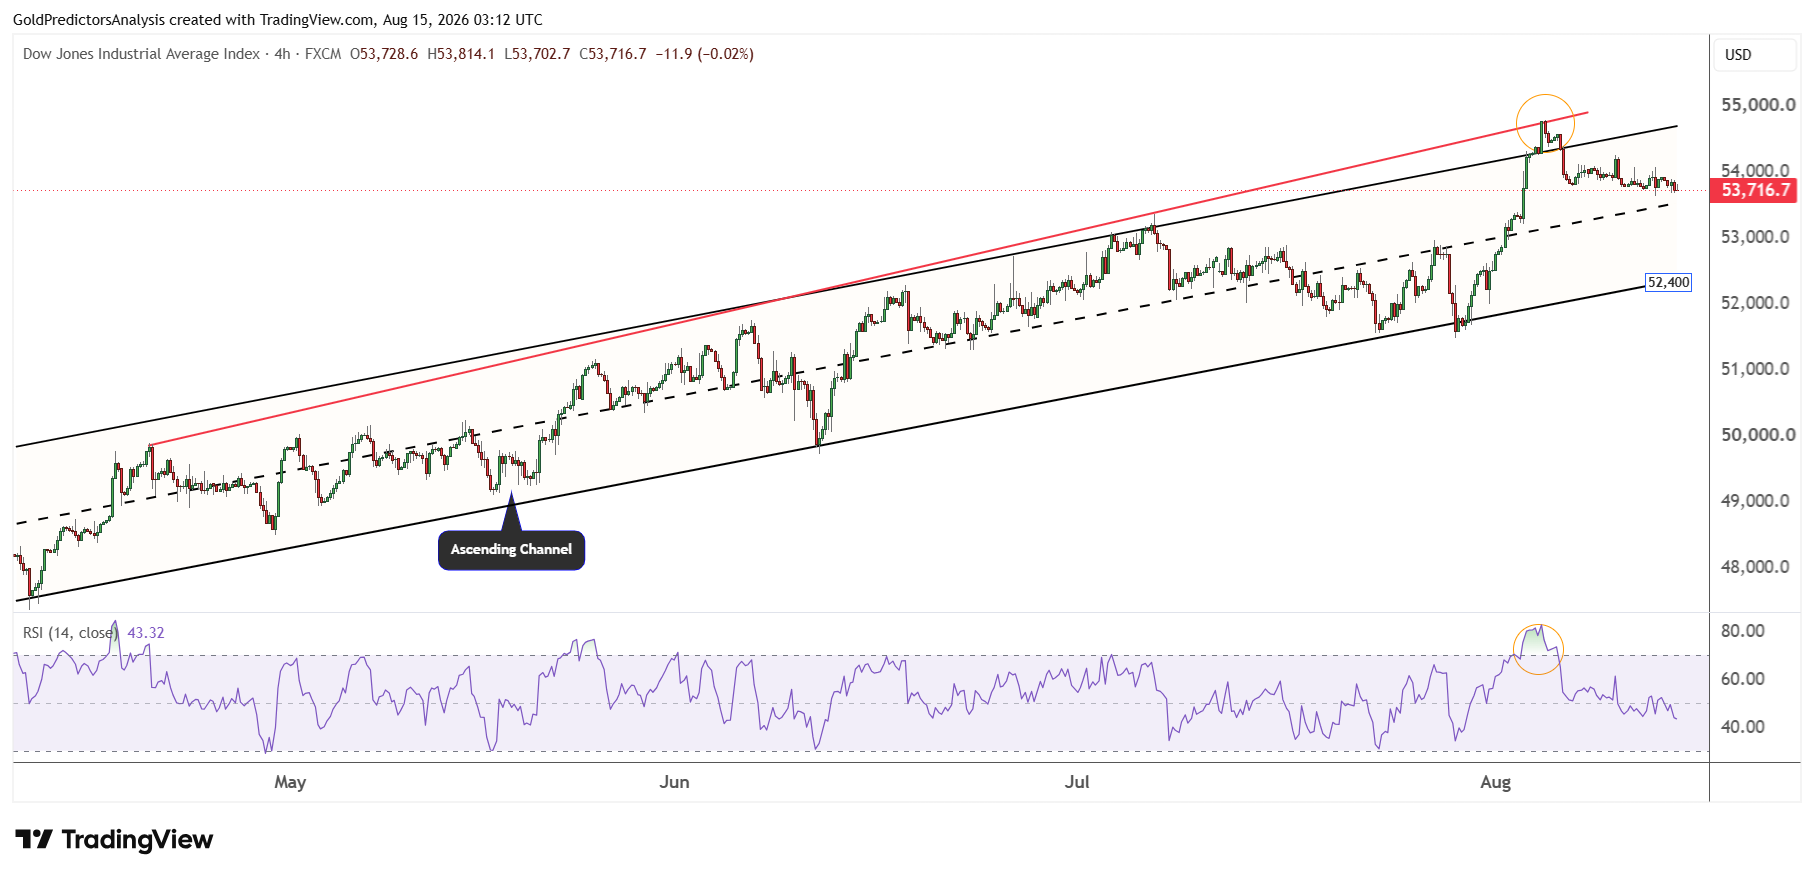
However, the Dow Jones has been trading within the ascending channel pattern since April 2026. The index now remains at the upper level of this channel. This indicates that a correction towards the 52,000-53,000 area will likely offer another rally towards the 56,600 level. The resistance of the ascending broadening wedge pattern defines this target.
To understand it more clearly, the ascending channel pattern discussed in the previous analysis further shows that the index is cooling down after hitting the 54,770 level. The index is moving towards the support of the ascending channel again. As long as the 52,500 level holds, the next move in the index may break above 55,000 and move towards the 56,600 level.
S&P 500 and Dow Jones Remain Bullish Above Key Support
Cooling inflation and weak job growth support the near term outlook for U.S. stocks. Both factors reduce the pressure on the Fed to raise interest rates. But the tariff uncertainty and rising Treasury yields could limit the upside. Higher import costs may hurt corporate margins while higher bond yields could reduce the value of future earnings.
The technical structures of both indices remain bullish. The S&P 500 could target 8,000 and then 8,500 if it holds above 7,620. The Dow Jones could break above 55,000 and move towards 56,600 if the 52,500 support holds. A break below these support levels would delay the expected rallies and increase the risk of a deeper correction.
Read more: Weak Jobs Report Supports Dow Near 55,000