The Dow Jones Industrial Average moved back to 54,000 on Friday to close the session at 54,026. Nonfarm payrolls fell in July which reduced expectations of rate hike by the Federal Reserve in September. The lower Treasury yields supported stocks. But the decline in employment also raised fresh questions about the strength of U.S. economy.
The broader outlook remains mixed. The strong corporate earnings and continued investment in artificial intelligence support the market sentiment. At the same time, President Donald Trump has announced another trade action while tariff negotiations with Canada remain unresolved. These developments may impact the inflation, business costs and the Fed outlook that may drive volatility in the Dow Jones near the record high.

Trump Tariffs Raise Inflation Risks for the Dow Jones
President Trump issued a proclamation on August 6 to help save the U.S. polysilicon industry. The minimum import price is defined in the plan for polysilicon and related products. It also imposes a 15% tariff on the covered downstream derivatives. The measures will come into effect on 4th December. Polysilicon is crucial to the production of solar products and semiconductors. This policy may boost the U.S. manufacturing and domestic investment. But it can also increase the prices for businesses that rely on imported parts.
The United States and Canada are also discussing the potential tariff relief. Canada could offer concessions in exchange for some U.S. tariffs being lifted. Both sides have exchanged proposals but have not reached the agreement.
The U.S. plans to impose tariffs of 50% on almost $20 billion worth of Canadian imports to take effect Aug. 19. A deal would reduce the risk of retaliation and disruption of the supply chain. If no deal is reached, it will continue to put pressure on the companies that have North American operations.
The tariff outlook has a mixed impact on the Dow Jones. Producers in the United States could benefit from protection in the long run. However, tariffs also have short term impacts on the cost of materials and consumers. Higher inflation may keep the Fed rates higher. That may have an impact on the valuation of stocks and interest rate-sensitive areas. The tariff relief may have the opposite effect. It may boost confidence and protect business profit margins. Trade headlines could cause volatility in the short term without impacting the overall bull market.
Dow Jones Price Forecast
Every new Dow Jones analysis as it publishes, today's technical signal and key levels, live price — on one page.
See all Dow Jones forecastsWeak US Jobs Report Cuts Fed Rate-Hike Odds
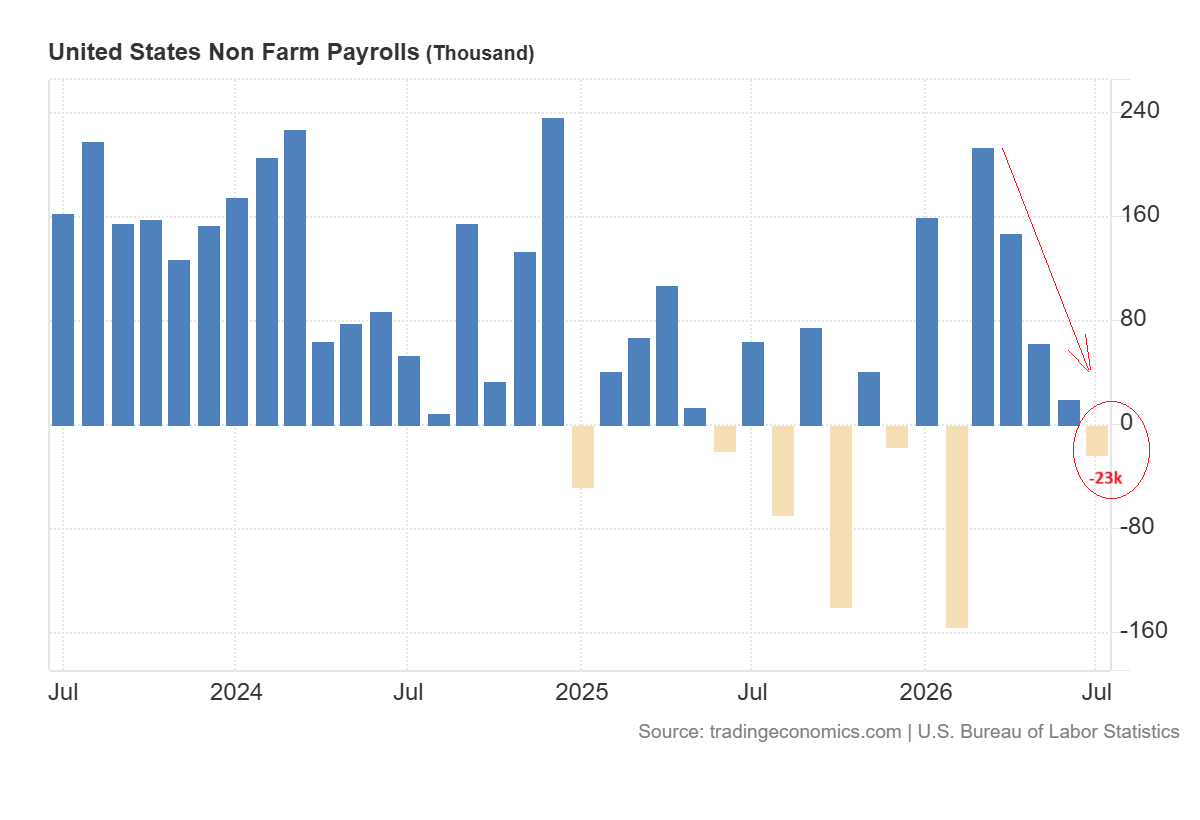
The US economy lost 23,000 jobs in July as per the latest data from the Bureau of Labor Statistics. The chart below shows that the job growth has already slowed since March 2026 which indicates the loss of demand for labour.
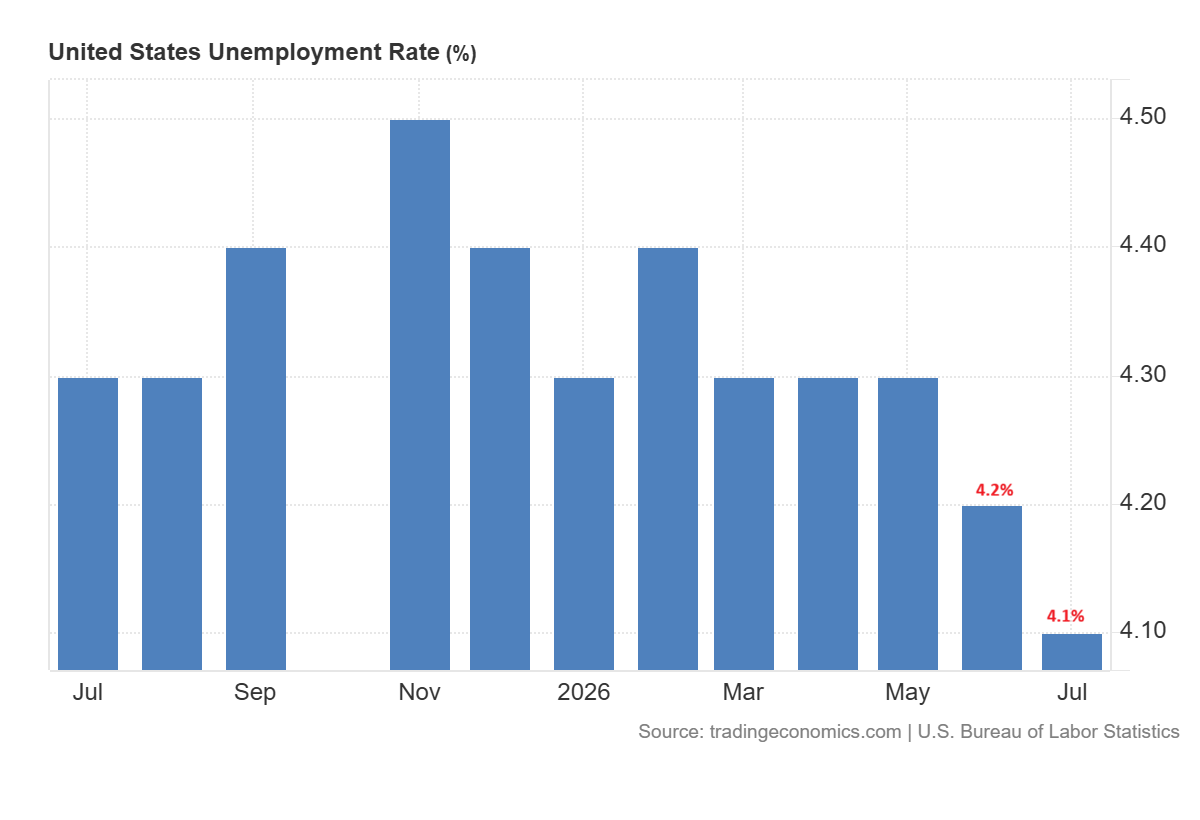
The unemployment rate also dropped to 4.1% from 4.2%. But the drop was not the sign of broad based improvement.
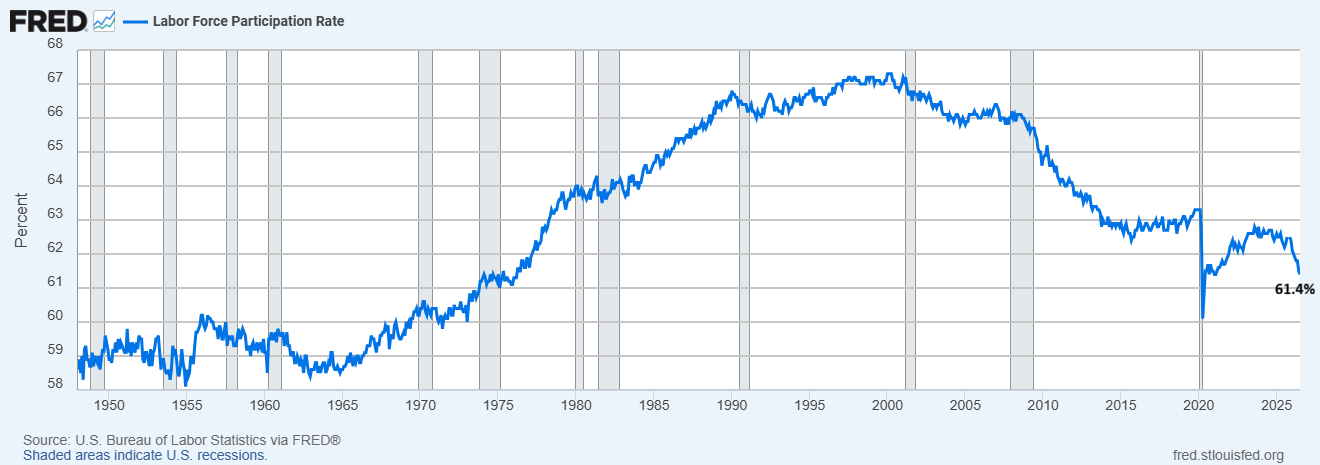
The labour force also fell by 264,000 and the participation rate dropped to 61.4%. The participation rate is still significantly lower than the pre-pandemic level of 63% as seen in the chart below. This combination shows that fewer people were counted as unemployed as some left the labour force.
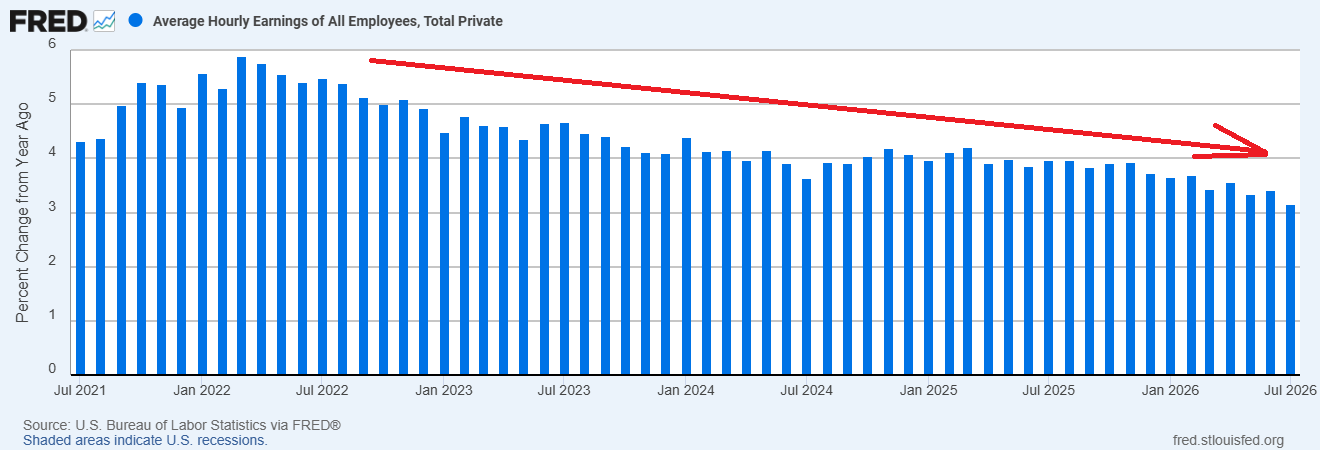
The wage pressure also eased in July. Average hourly earnings increased just two cents in July and 3.2% over the past year. Average hours worked in a week were unchanged at 34.3 hours.
The report reduced the case for the imminent rate hike. The expectations of the 25 bps rate hike in September reduced from 56% to 44% after the release of US jobs data.
The weaker outlook on interest rates capped Treasury yields and supported the Dow Jones. But weak hiring is not all good news for stocks. A prolonged slowdown could affect the consumer spending and the revenues of companies. Therefore, the inflation report will be important. A cooler trend in inflation would indicate a pause by the Fed while further increases in oil or tariffs could keep policy uncertainty elevated.
Dow Jones Long-Term Forecast: Break Above 55,000 Targets 59,000
The long term outlook for the Dow Jones Industrial Average remains strongly bullish as seen in the weekly chart below. The Dow Jones Average bullish consolidation from November 2021 to October 2023.
This two-year consolidation formed the inverted head and shoulders pattern with the low in September 2022 at 28,700 and the shoulders at the lows in February 2022 at 32,200 and in March 2023 at 31,400. This formation broke the neckline of the inverted head and shoulders pattern on 13 November 2023 at the 35,000 level. This formation introduced a strong surge in the Dow Jones, which pushed the index above the 50,000 level in May 2026.
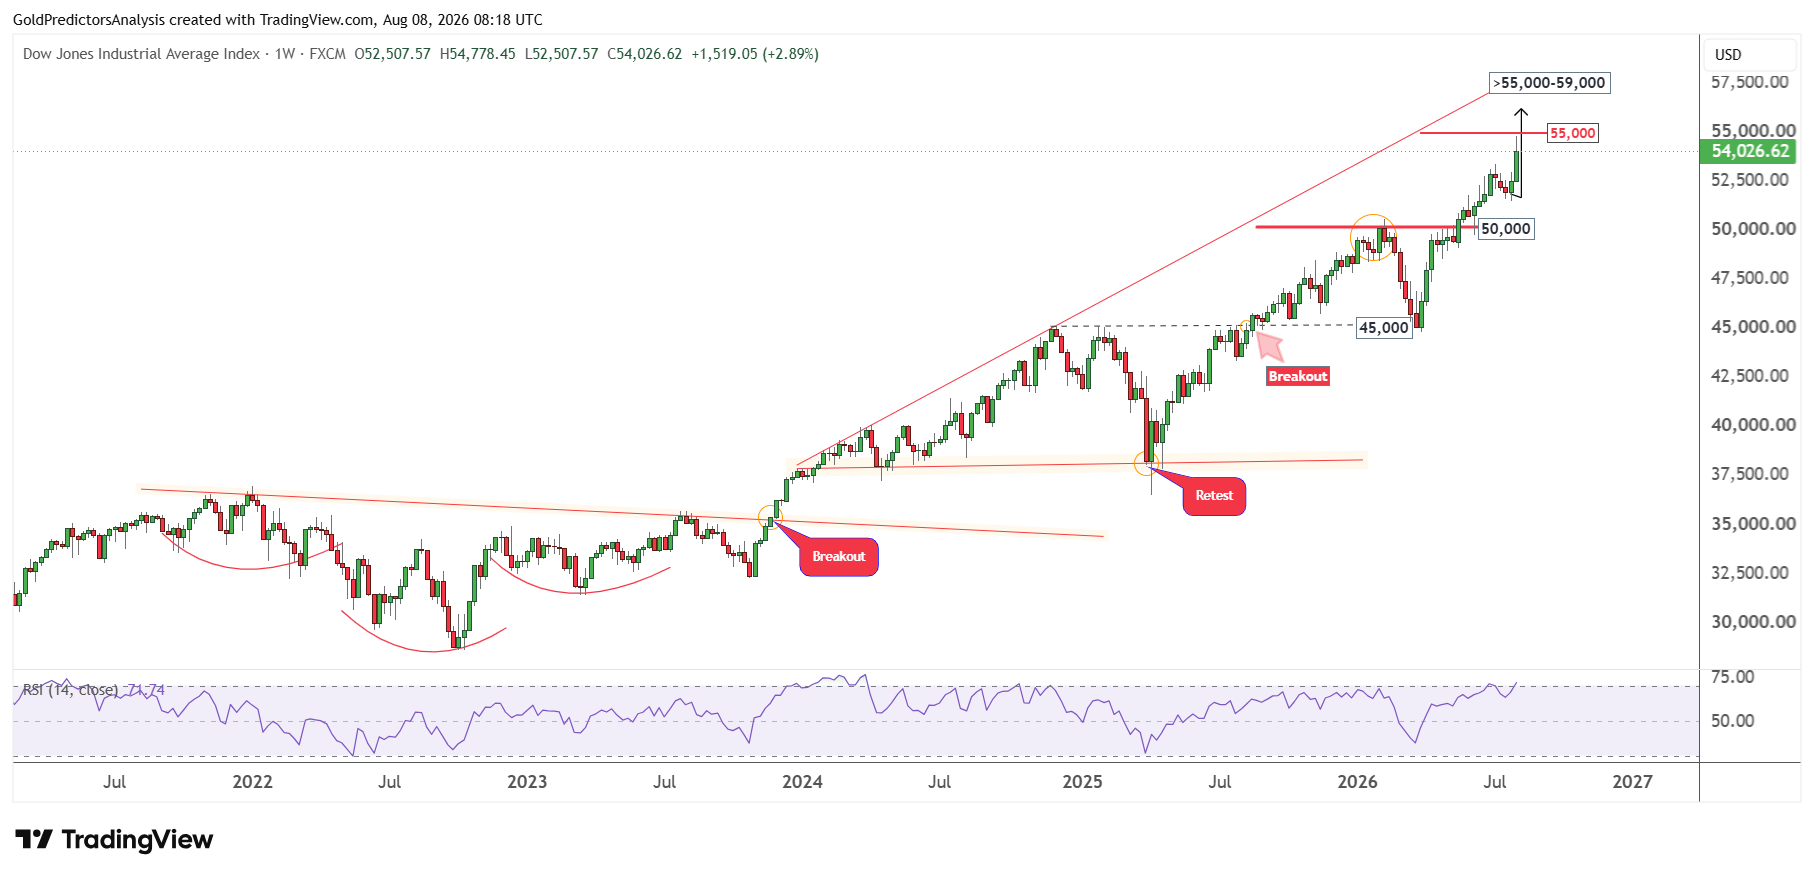
The strong surge after 2023 in the index formed a broadening wedge pattern, which has an upside target of 55,000 as discussed in multiple analyses during the past few months.
As I said in my analysis, the retest of the low at 37,800 in March 2025, followed by a strong break above 45,000 produced a base for the next move towards 55,000. The target in the Dow Jones has now been achieved at the 55,000 area. But the index points further upside as momentum in the Dow Jones has built.
The chart further shows that the V-shaped recovery on 30 March 2026 and the breakout above 50,000 have a target at the trend line that stretches from the January 2024 highs. This target now extends to the 59,000 level if the index clearly breaks above 55,000.
However, the RSI indicator has reached overbought conditions and the index may form a top soon and produce another drop towards the 50,000 area. This drop towards the 50,000 area will likely take the Dow Jones above the 60,000 level.
Dow Jones Short-Term Forecast: 52,000–53,000 Support Could Drive the Next Rally
Dow Jones Daily Chart Targets 56,400 After a Pullback
It is interesting to note that the short term price action in the Dow Jones points to the similar outlook, which shows the formation of an inverted head and shoulders pattern from December 2024 to August 2025. The break above the neckline of this pattern at 45,000 in August 2025 pushed the index higher.
This breakout again produced a broadening wedge formation, which points to 56,400 in the short term. The V-shaped recovery in March 2026 further strengthened the rally. The Dow Jones has been trending within ascending channel pattern since April 2026. The target for this ascending channel points to 55,000 which was reached last week.
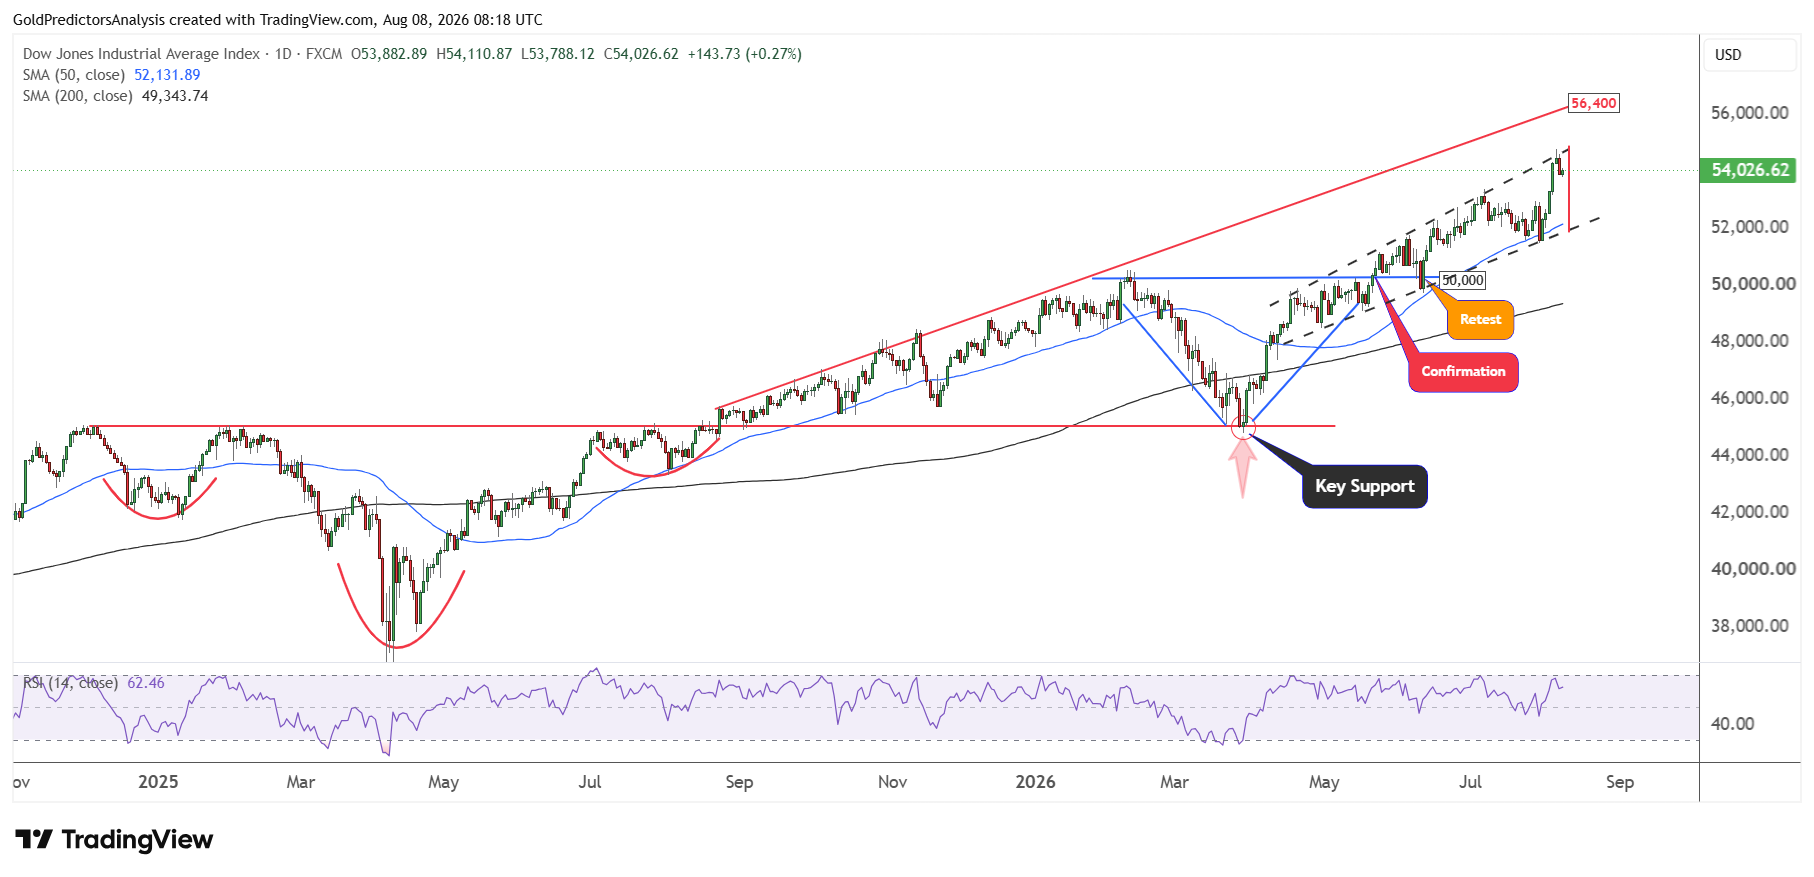
However, it is observed that the ascending channel pattern is now looking more like an ascending broadening wedge, which presents high volatility towards the end. Therefore, any correction in the Dow Jones towards the 52,000 to 53,000 level may introduce another move towards the 56,400 area. However, any correction back towards 50,000 may be considered a long term pivotal point for investors.
Dow Jones 4-Hour Chart Signals Cooling Near 55,000
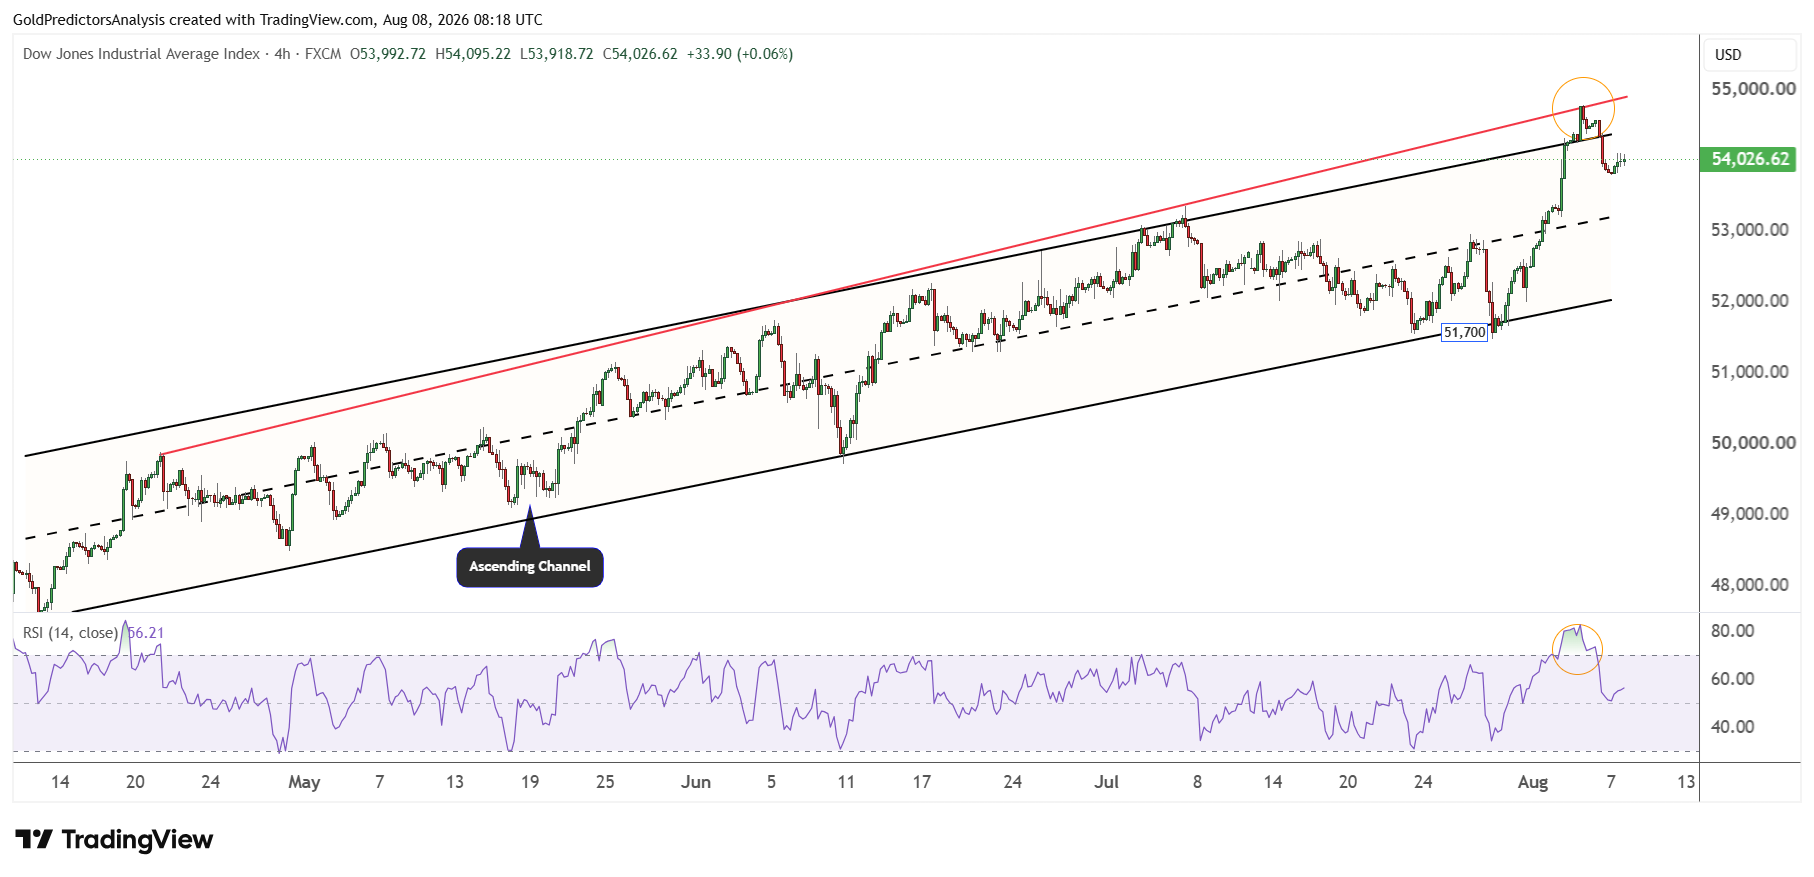
The ascending channel pattern observed on the daily chart is also clearly seen on the 4-hour chart. The 4-hour chart shows that the important support of 51,700 was reached on 29 July 2026 as discussed previously. This support in the Dow Jones took the index towards the resistance of this ascending channel pattern, which now reaches the 55,000 level.
The red trend line that stretches from the 21 April 2026 high now lies exactly at the 54,770 level, which was the high on Wednesday last week. This indicates that any correction back towards 52,000 to 53,000 will be considered a strong pivotal point for short term traders. It is interesting to note that the RSI indicator also reached extremely overbought levels, which points to a cooling before the next rally.
Bottom Line
Weak jobs data support the Dow Jones in the short term because they reduce the risk of September rate hike. The lower Treasury yields and strong corporate earnings also support stocks. But the weaker hiring could hurt consumer spending and company revenues if the slowdown continues. Tariffs also remain a risk as higher import costs could increase inflation and keep interest rates elevated.
The technical outlook remains bullish but the index looks overbought near the 55,000 resistance. A correction towards 52,000 to 53,000 may provide support before the next rally. A clear break above 55,000 could open the way towards 56,400 and then 59,000. A deeper correction towards 50,000 would remain an important long term pivotal point.