
The S&P 500 and Dow Jones rebounded as strong technology earnings restored confidence in the artificial intelligence trade. Microsoft’s results showed that large AI investments can still produce strong revenue and cash flow. But the tariff uncertainty, elevated Treasury yields and weak economic growth may keep the indices volatile. The broader outlook remains positive but investors may become more selective as valuations remain above historical averages.
Trump Tariffs Raise Risks for the S&P 500 and Dow Jones
The largest tariff threat comes from Russia sanctions bill supported by President Trump. The proposal is to impose up to 100% tariffs on imports from top Russian energy consumers. These measures may be applied to other countries such as China, India and Turkey. The bill also allows much higher tariffs on direct imports from Russia. But these are proposed powers and have yet to be put into effect as tariffs.
These tariffs may hinder trade with key U.S. trading partners. American-based businesses rely on China and India for technology parts, industrial goods, pharmaceuticals and consumer goods. The increased import prices may lead to decline in the profit margins of businesses or increased consumer prices. This would put pressure on multinational companies in both the S&P 500 and Dow Jones. It also has potential to provide for elevated inflation and higher Treasury yields.
The plan still faces resistance in Congress as both members are worried about inflation, economic damage and the broader presidential trade authority. Therefore, it is considered the risk scenario rather than the base case. Trump also signed a smaller tariff rate quota on imports of quartz surfaces on 31st July. It will be in effect for four years, starting Aug. 15 and will have a few exceptions to the list of trading partners. It may not have direct impact on markets but it does represent a reminder that tariffs are part of the U.S. economic policy agenda.
Microsoft Earnings Fuel the S&P 500 and Dow Jones Rally
Microsoft delivered a strong forecast and initiated a rally on Wall Street on Thursday last week. This rally resulted in strong weekly gains in the S&P 500 with 1.05% and the Dow Jones with 1.14%.
S&P 500 Price Forecast
Every new S&P 500 analysis as it publishes, today's technical signal and key levels, live price — on one page.
See all S&P 500 forecastsMicrosoft recieved 21.75% gain last week and the market value also increased dramatically. The company forecasted strong quarterly sales and cloud growth. It announced capital expenditure below expectations and expects to generate positive cash flows into fiscal 2027. These results alleviated fears that the financial consequences of the investments in AI would reduce profits of large tech firms.
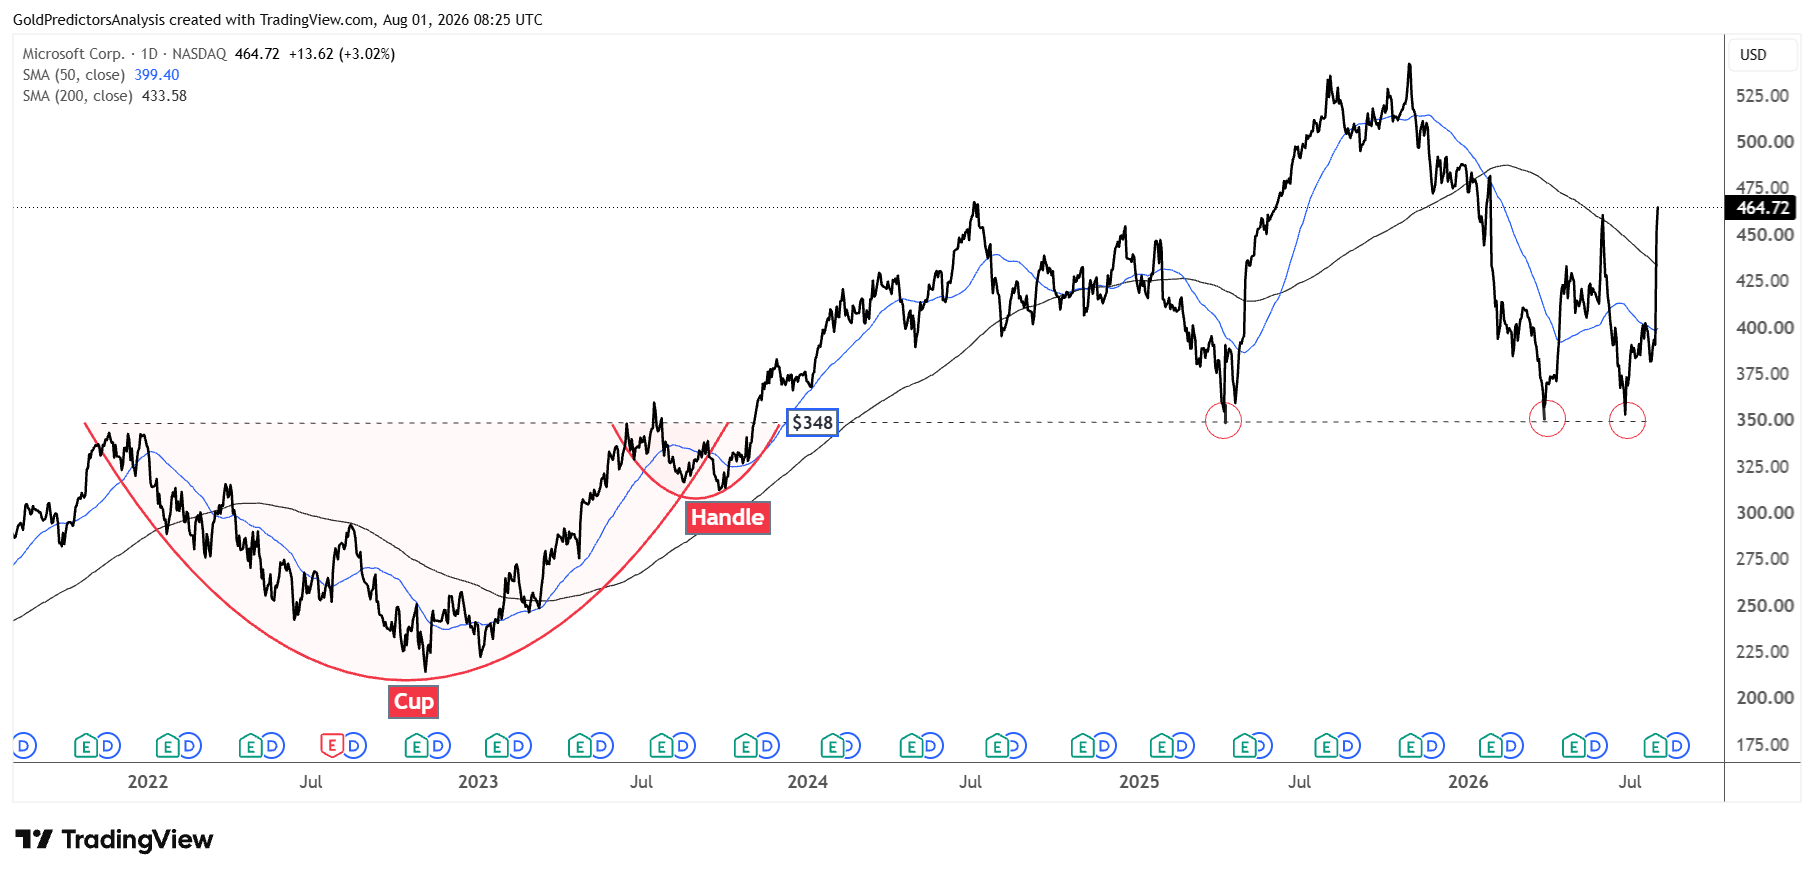
The chart below shows that Microsoft’s rebound developed from the strong long-term support at the $350 level. This support is defined by the neckline of a cup and handle pattern. This pattern developed from November 2021 to October 2023. Each time Microsoft’s stock price reaches this level, it initiates a strong rally toward new record high.
The first example was seen in April 2025 while the second was seen in March 2026. The drop in June 2026 resulted in another strong surge in Microsoft. Moreover, the stock price closed above its 2026 high, which represents a strong recovery. The rising volume in Microsoft also shows strong buying interest as the price increases. The stock price is now also above the 200-day SMA on the daily chart which indicates positive momentum in Microsoft over the next few days.
Semiconductor Stocks Rebound as AI Optimism Returns
This rally also spreads across the semiconductor stocks. The SOX index gained over 8% on Thursday and produced sharp shadow on the weekly candle as seen in the chart below.
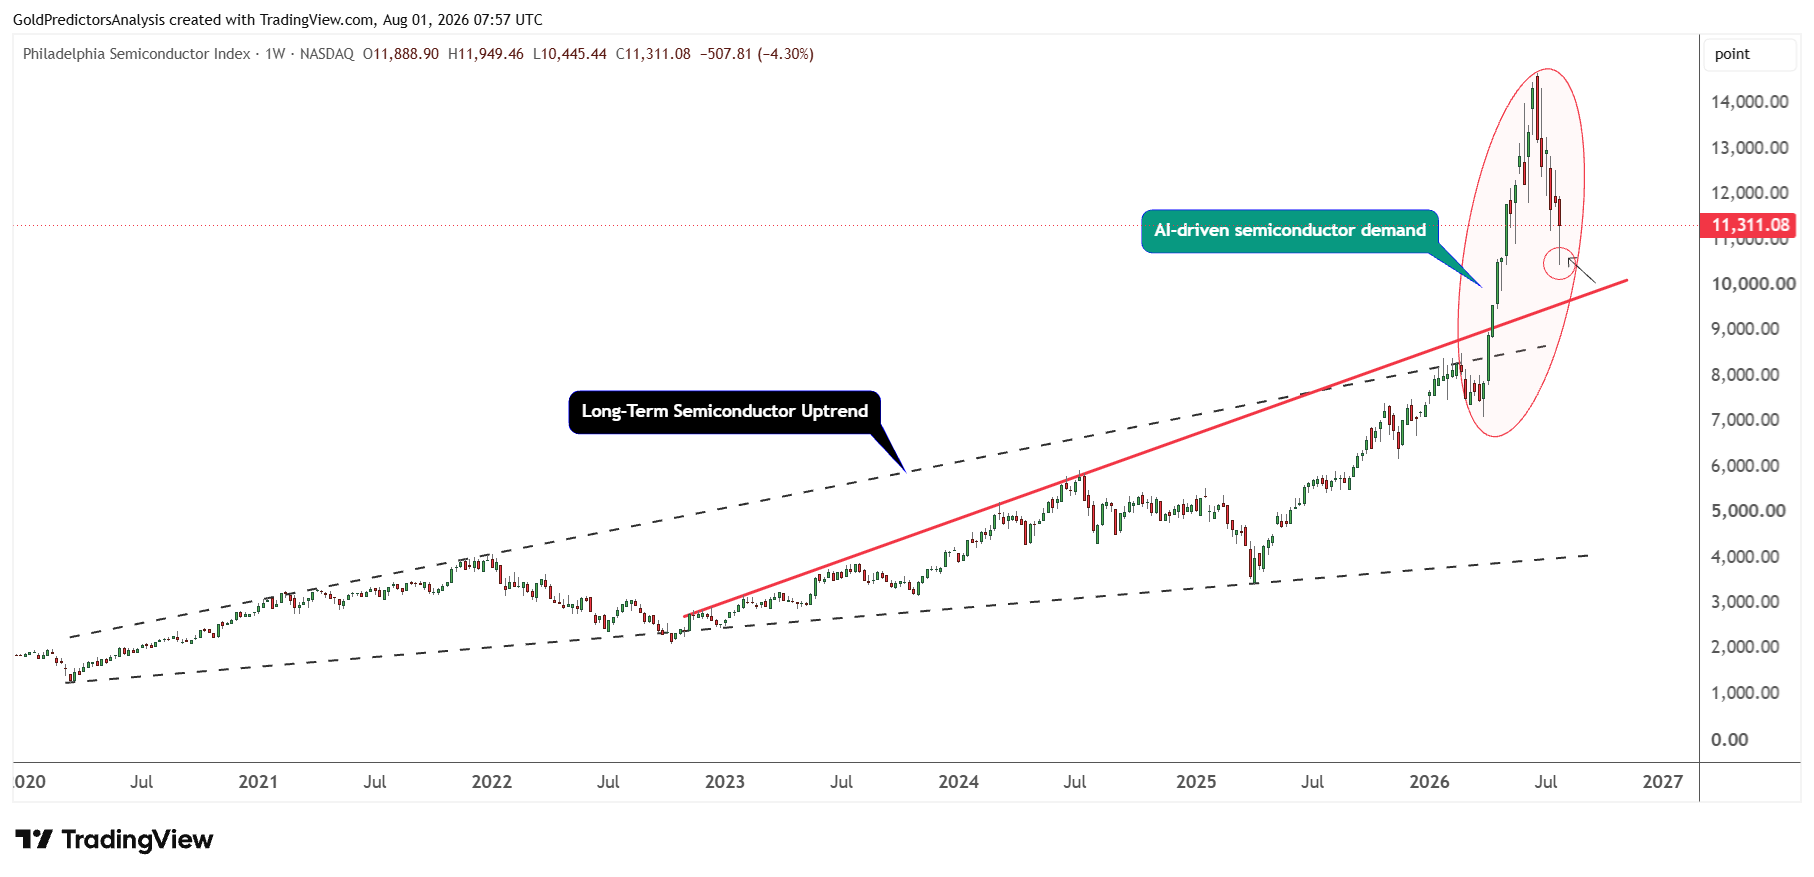
The chart shows that the drop in the semiconductor index since June 2026 does not change the long term bullish picture for the semiconductor stocks. This means that the latest AI-driven surge remains intact. The index has reached close to the strong support zone seen by the red ascending trend line.
Micron Technology Inc. (MU) gained 18%, Sandisk Corporation (SNDK) jumped 26% and Advanced Micro Devices (AMD) rose 13%. But the rally in Meta Platforms (META) was limited due to the 91% drop in free cash flow in Q2. The mixed outcomes indicate that investors are differentiating between businesses that are using AI to deliver returns and those that are simply incurring higher costs.
Most of the S&P 500 sectors were higher and more stocks rose than fell. This means that the recovery in S&P 500 is more widespread than it was in technology. But the technology was biggest contributor with a 5.2% increase. The market is held up by strong earnings but higher valuation levels leave little margin for error on poor earnings.
Fed Rate Hike Risks and Treasury Yields Could Increase Stock Market Volatility
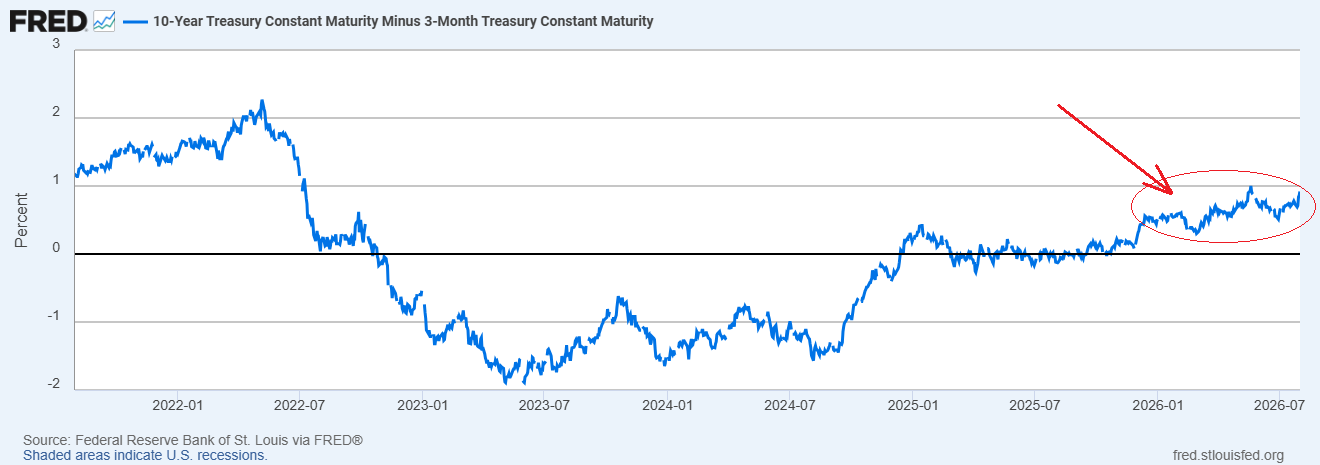
The chart below shows that the 10-year minus three-month Treasury index has been positive for over 100 days. Currently, it is 0.92%. The S&P 500 is also above its 10-month weighted moving average. All of these indicators are suggesting a risk-on attitude and further dampen the immediate threat of a big bear trend.
The Federal Reserve maintained the Fed’s target for the federal funds rate at 3.50%-3.75%. But there is a 65% probability that the interest rates will be raised in September. Despite these expectations, there is a lot of uncertainty about the interest rates. This uncertainty might be seen in trading activity in both the stock and bond markets.
The Fed chair is pushing for less Fed forward guidance. He thinks that the reduced number of forecasts would help shield the Fed’s judgment and allow policymakers to see market expectations. But the limited guidance can also lead to greater bond market volatility as investors will have less information on future policy. A steepening of the yield curve could also help to make borrowing cheaper for the long term, dampen demand and pressure rate-sensitive Dow Jones companies.
The S&P 500 and Dow Jones still remain bullish. The solid earnings and positive market dynamics should be favorable for additional gains, but a few short term corrections may be in order due to tariff uncertainty, elevated yields and underwhelming cyclical data.
Moreover, the US stock market valuations indicators remain extremely overbought. The ratio of stock market capitalization to GDP is extremely overvalued. Similarly, Robert Shiller’s CAPE currently lies at the second highest in history after the peak of the Dotcom bubble in 1999-2000. These indicators still point to the risk of corrections in US stocks but the latest market development still suggests the positive movements before the major peak is developed.
Dow Jones Forecast: Bullish Breakout Targets 55,000
The long-term outlook for the Dow Jones remains bullish as seen in the weekly chart below. The chart shows the formation of an inverted head and shoulders pattern from December 2021 to October 2023. A break above the neckline of this pattern in November 2023 initiated a strong surge in the Dow Jones.
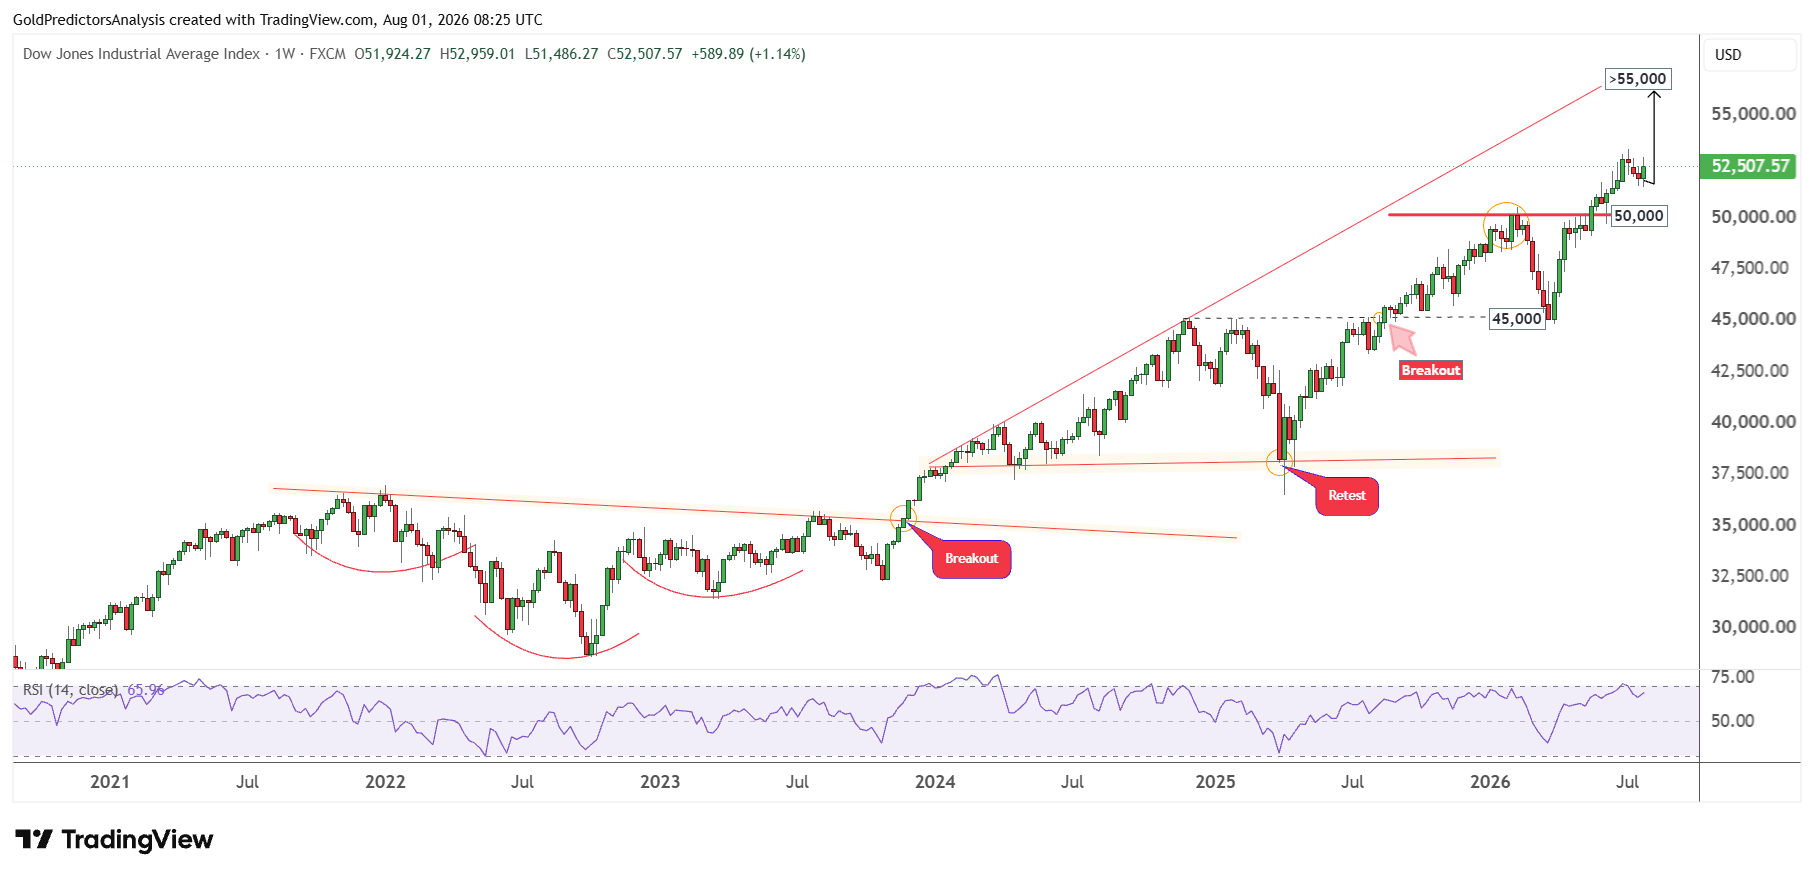
The market formed a broadening wedge pattern after the breakout and then broke above the 50,000 level, which was the pivotal level. A break above 50,000 has opened the door for a strong surge in the Dow Jones toward 55,000.
But the tariff uncertainty, the U.S.-Iran war, higher Treasury yields and inflation expectations may keep the Dow Jones rally volatile.
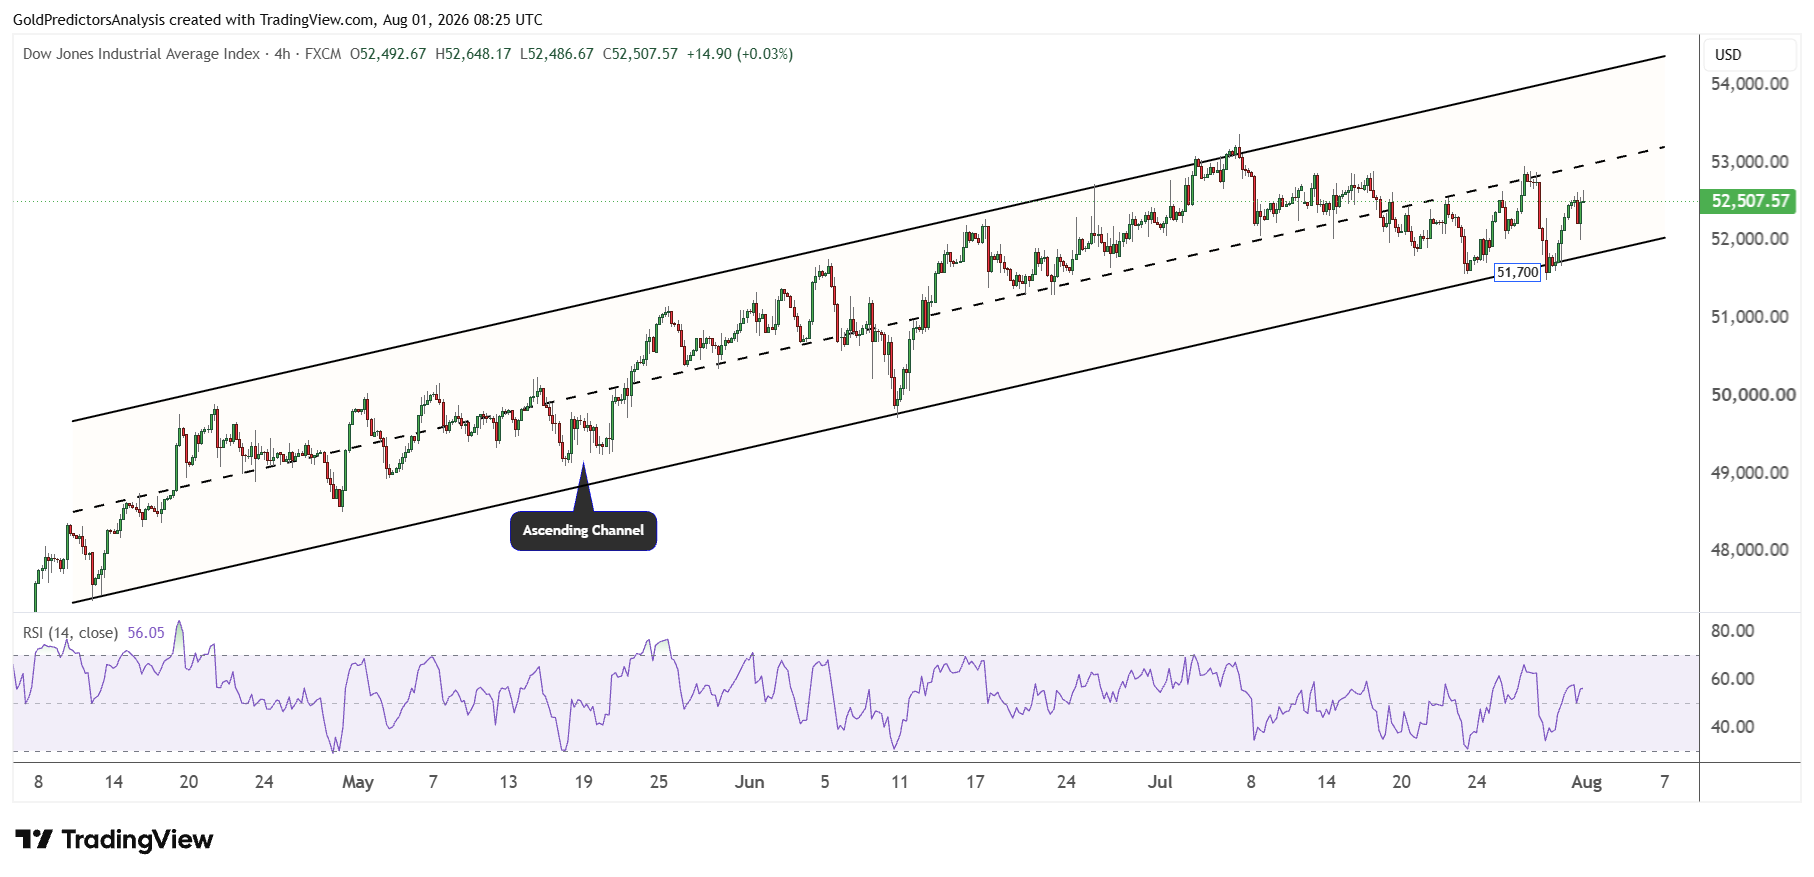
Last week’s drop in the Dow Jones held the defined support level of 51,700 as discussed in previous analysis. The low in the Dow Jones was formed at 51,485, which was around 200 points below our defined support. But the Dow Jones rebounded strongly and closed at 52,507, which keeps its bullish momentum alive.
The Dow Jones has been trading within an ascending channel pattern and the resistance of the channel now targets the 55,000 level within the next 2 months. But a break below 51,700 will open the door for another drop toward the 50,000 area. On the other hand, a break below 50,000 will initiate a deeper correction to the 45,000 level.
S&P 500 Forecast: Break Above 7,620 Could Target 8,000
The S&P 500 also shows constructive price action as seen in the strong bullish formation in 2025 and the strong volatility after July 2025 within the ascending broadening wedge pattern. The S&P 500 formed a strong bottom at the 6,300 level in 2026 and initiated a strong surge above the 7,000 area.
The breakout above 7,000 opened the door for a move toward the 8,000 level. The resistance of the ascending broadening wedge pattern defines this target. But the market has been trading within a triangle pattern, which can be treated as a bull flag formation if measured from the lows of March 2026.
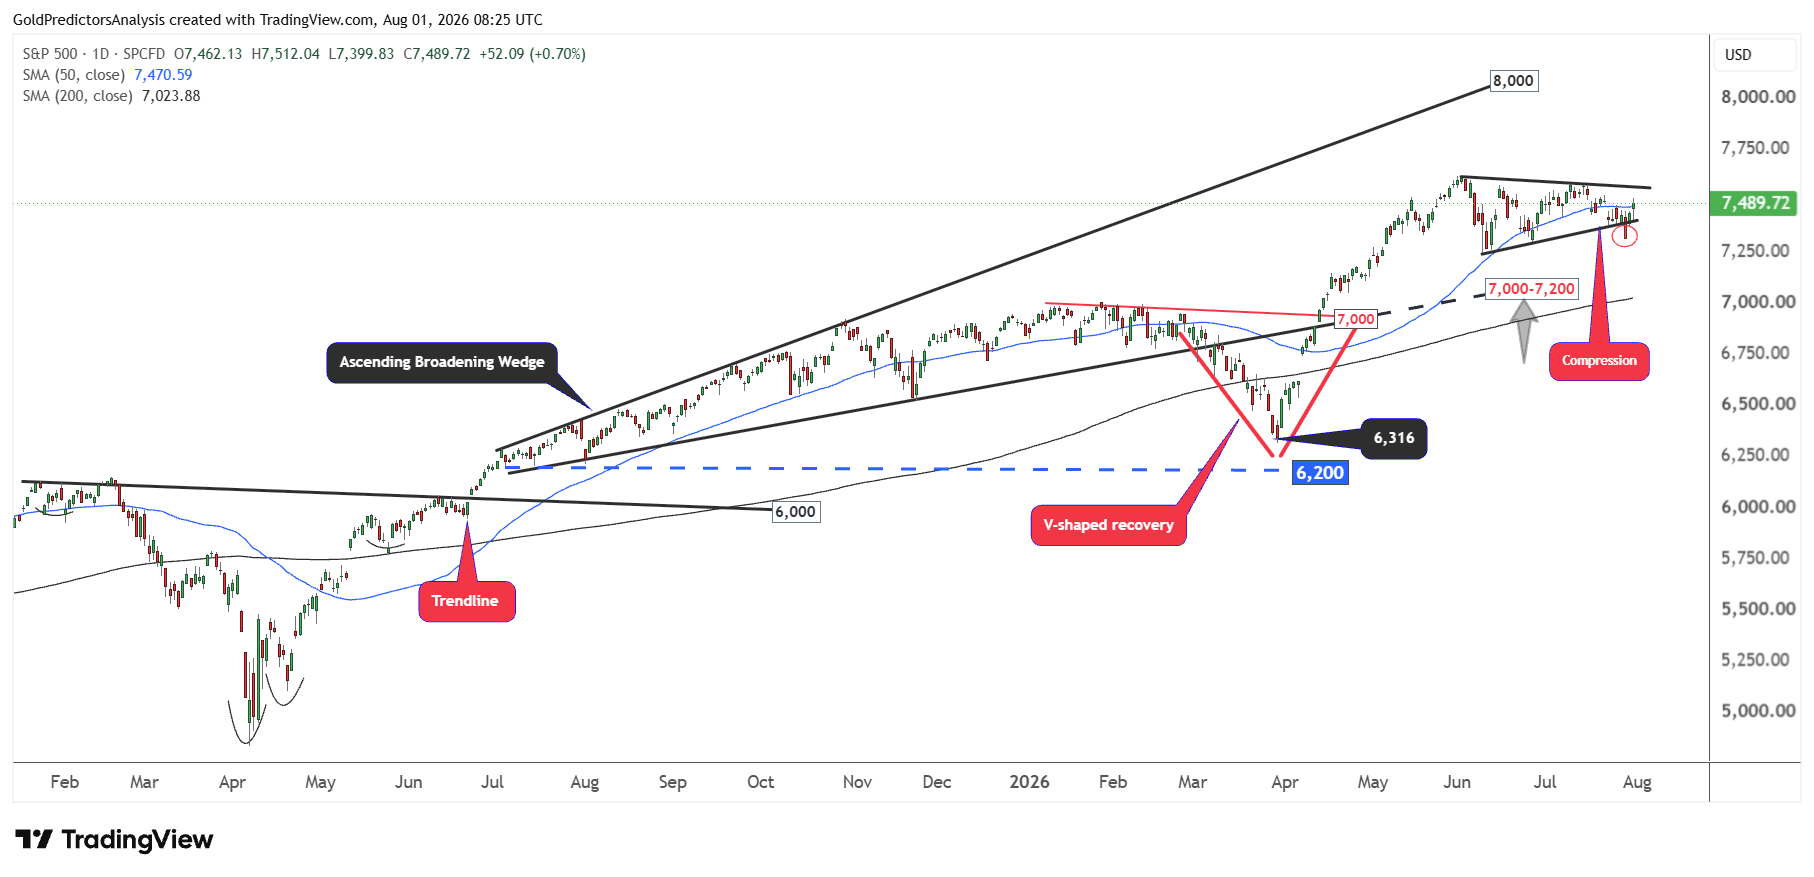
However, last week’s break below the triangle was considered as a fake breakout as the market opened higher and continued to rally toward the 7,500 level. The index has closed above the 50-day SMA again and is looking to gain momentum. But the real breakout will be confirmed when the index breaks above 7,620.
The price compression pattern is clear from the chart below. It shows that the fake breakout developed on July 29, 2026 and that the strong recovery produced a strong bullish candle. This indicates that the market may rally again toward the 7,620 resistance level.
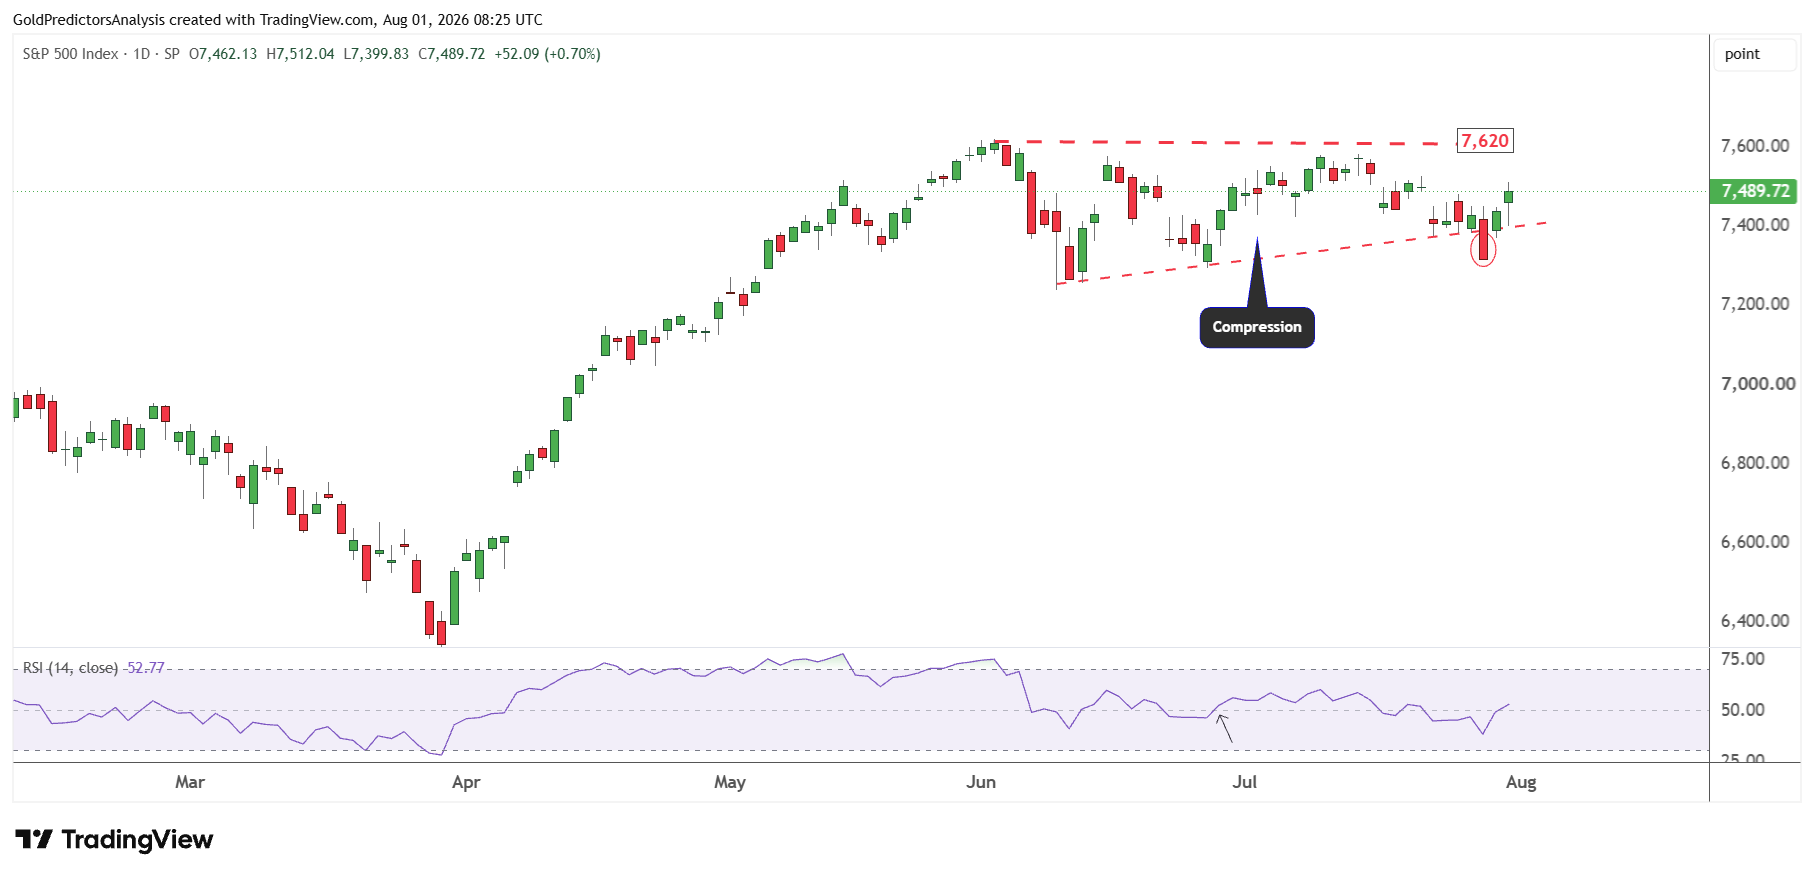
Only a break above 7,620 will confirm a strong surge in the index toward 8,000. It is important to note that the index has again closed above the midline of the RSI when it recovered within the triangle pattern. This structure keeps the short term momentum bullish.
S&P 500 and Dow Jones Outlook Remains Bullish
The S&P 500 and Dow Jones maintain the bullish outlook as strong earnings and positive market signals support further gains. Microsoft’s results have restored the confidence in AI-related investments while the positive yield spread supports the risk-on environment. But the tariff uncertainty, higher Treasury yields and expensive valuations may cause short term corrections.
The Dow Jones may target 55,000 if it remains above 51,700 while the break below this support could push the index toward 50,000. A break above 7,620 in S&P 500 may confirm a move to 8,000. The bullish trend remains intact but volatility may persist as both indices approach major resistance levels.