Zcash (ZEC) has fallen about 25% from its late-September peak near $1,700, and the correction I warned about two weeks ago appears to be playing out as expected.
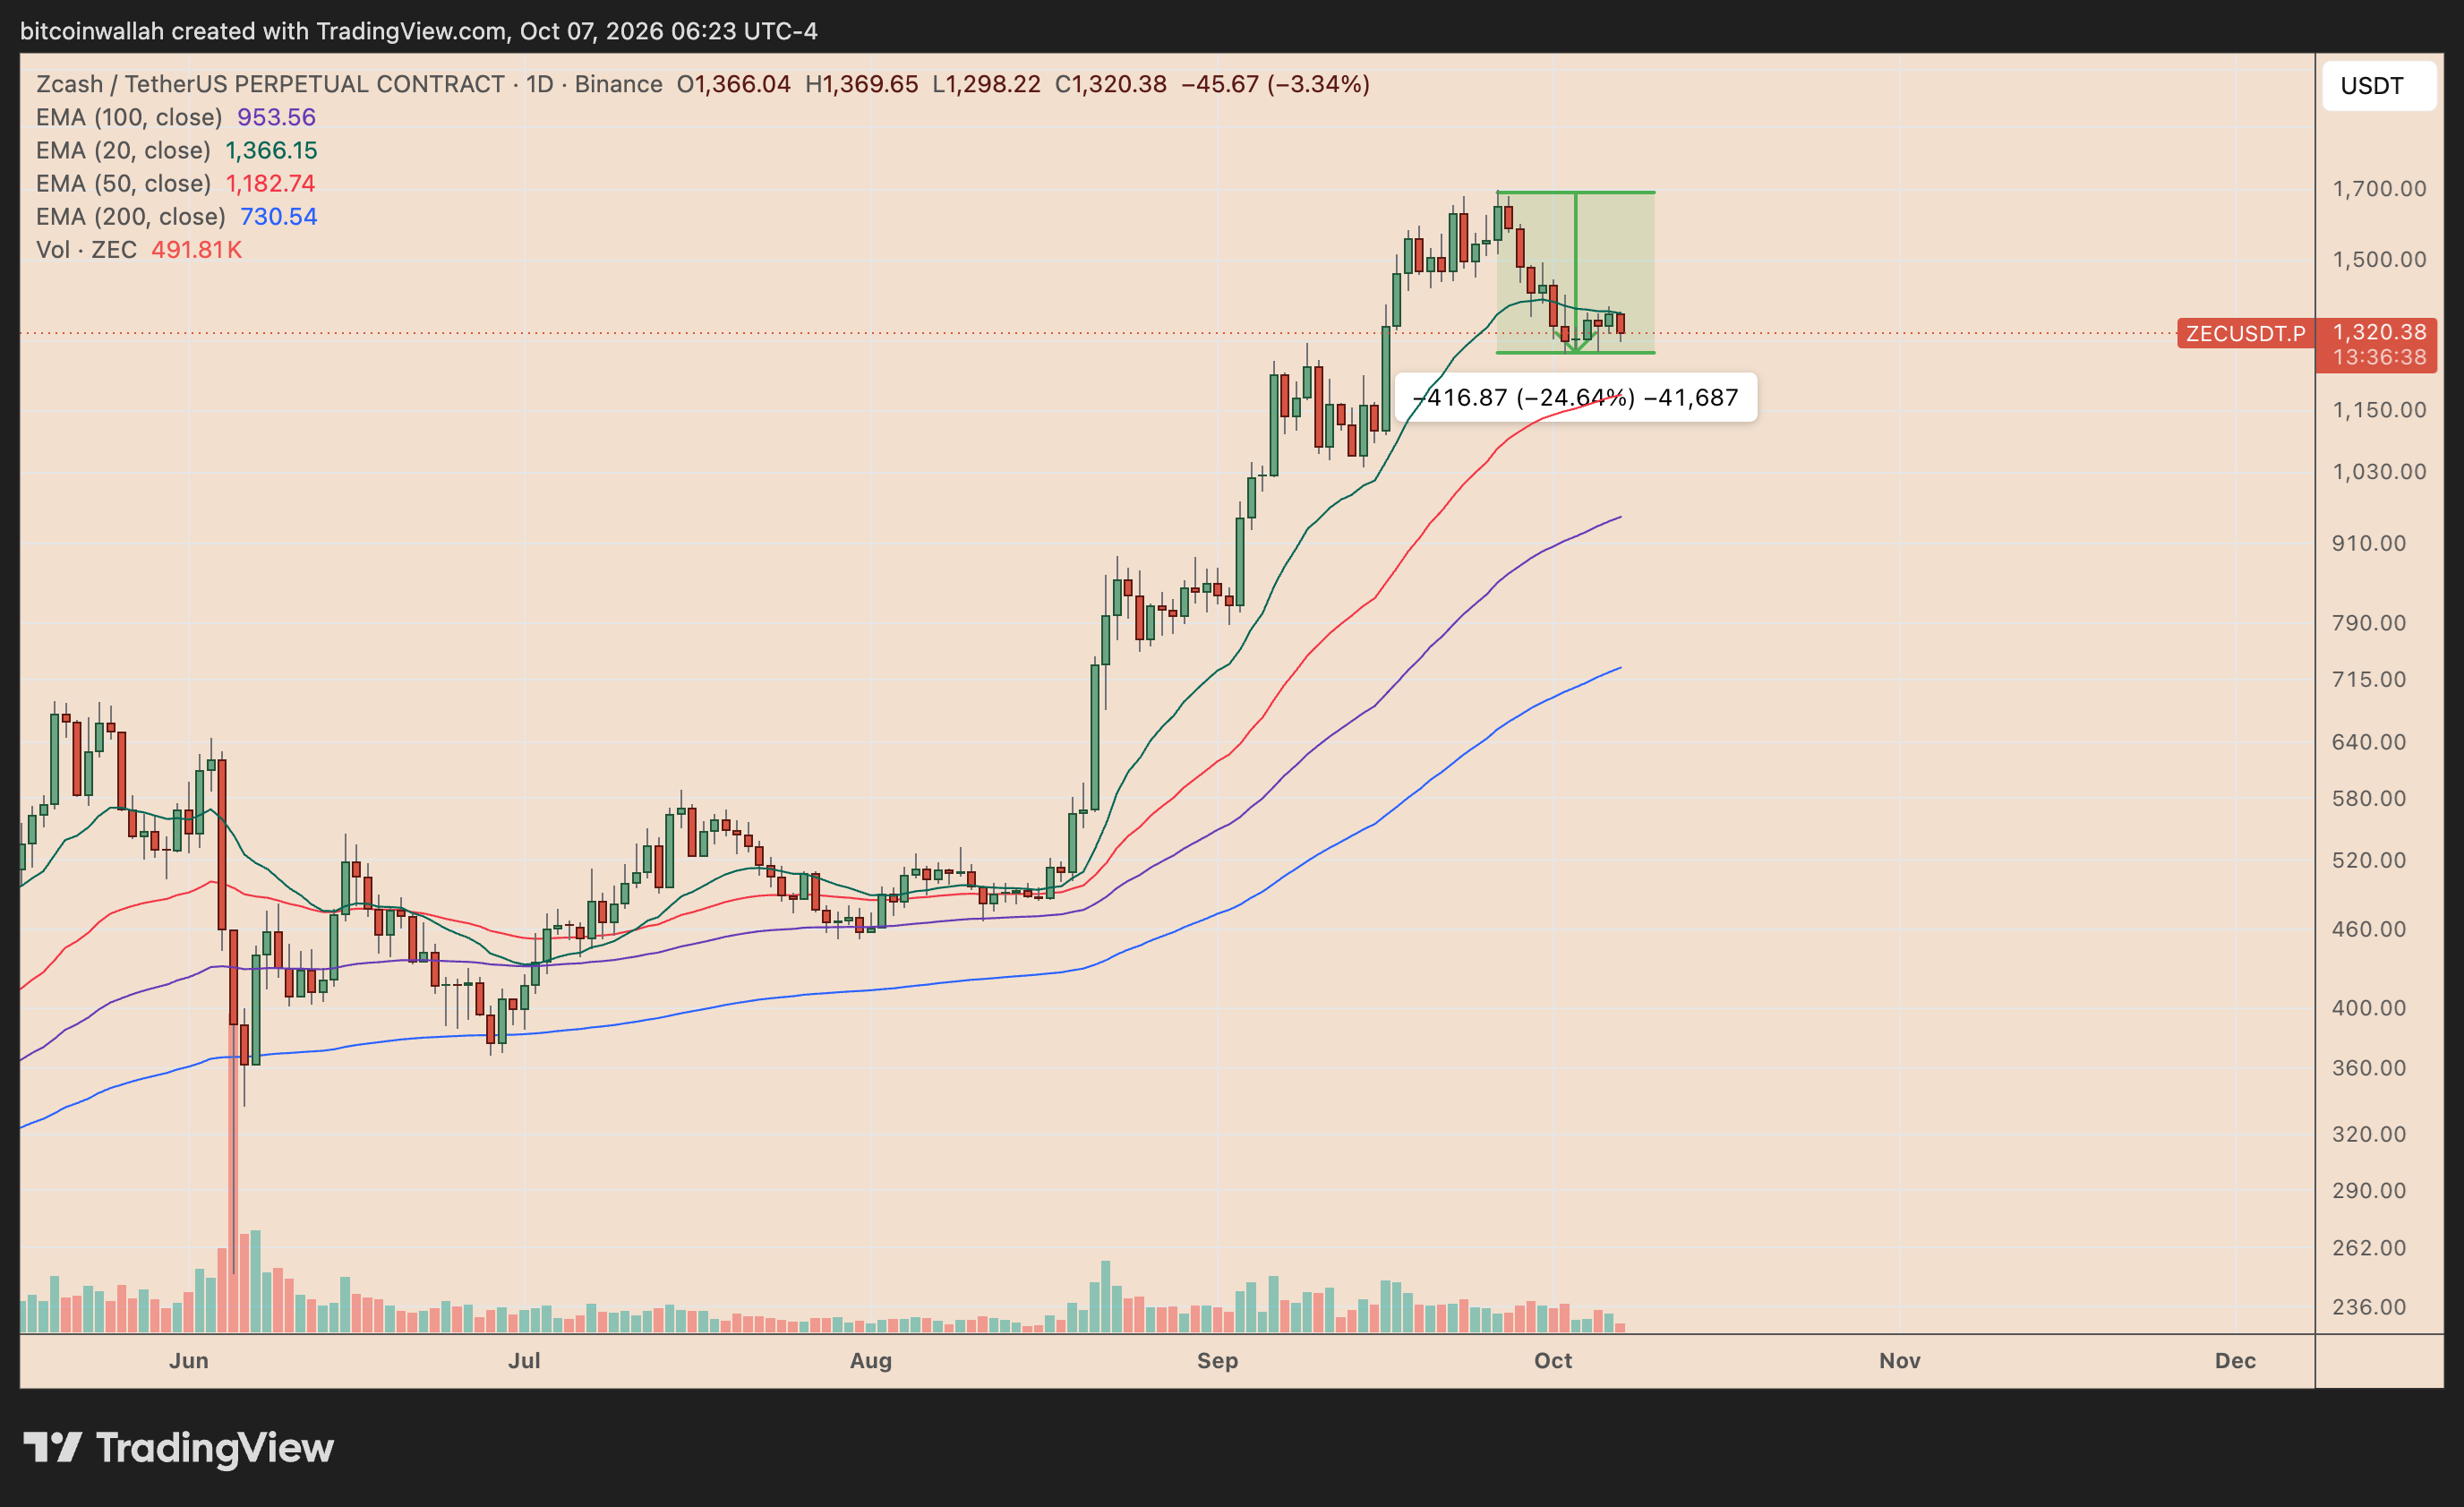
In my Sept. 23 analysis, I highlighted a bearish RSI divergence and warned that ZEC could retreat toward the $1,220-$1,300 region after approaching the $1,700-$1,750 resistance zone.
ZEC later pushed higher before reversing and was trading near $1,319 on Oct. 7, bringing that downside thesis into sharper focus.

ZEC Correction Could Extend Toward $1,136
The weekly chart now points to another important downside level.
ZEC has slipped below the 2.618 Fibonacci extension near $1,722 after failing to sustain its breakout toward the recent highs. That rejection increases the probability of a deeper retracement toward the 1.618 Fib level near $1,136.
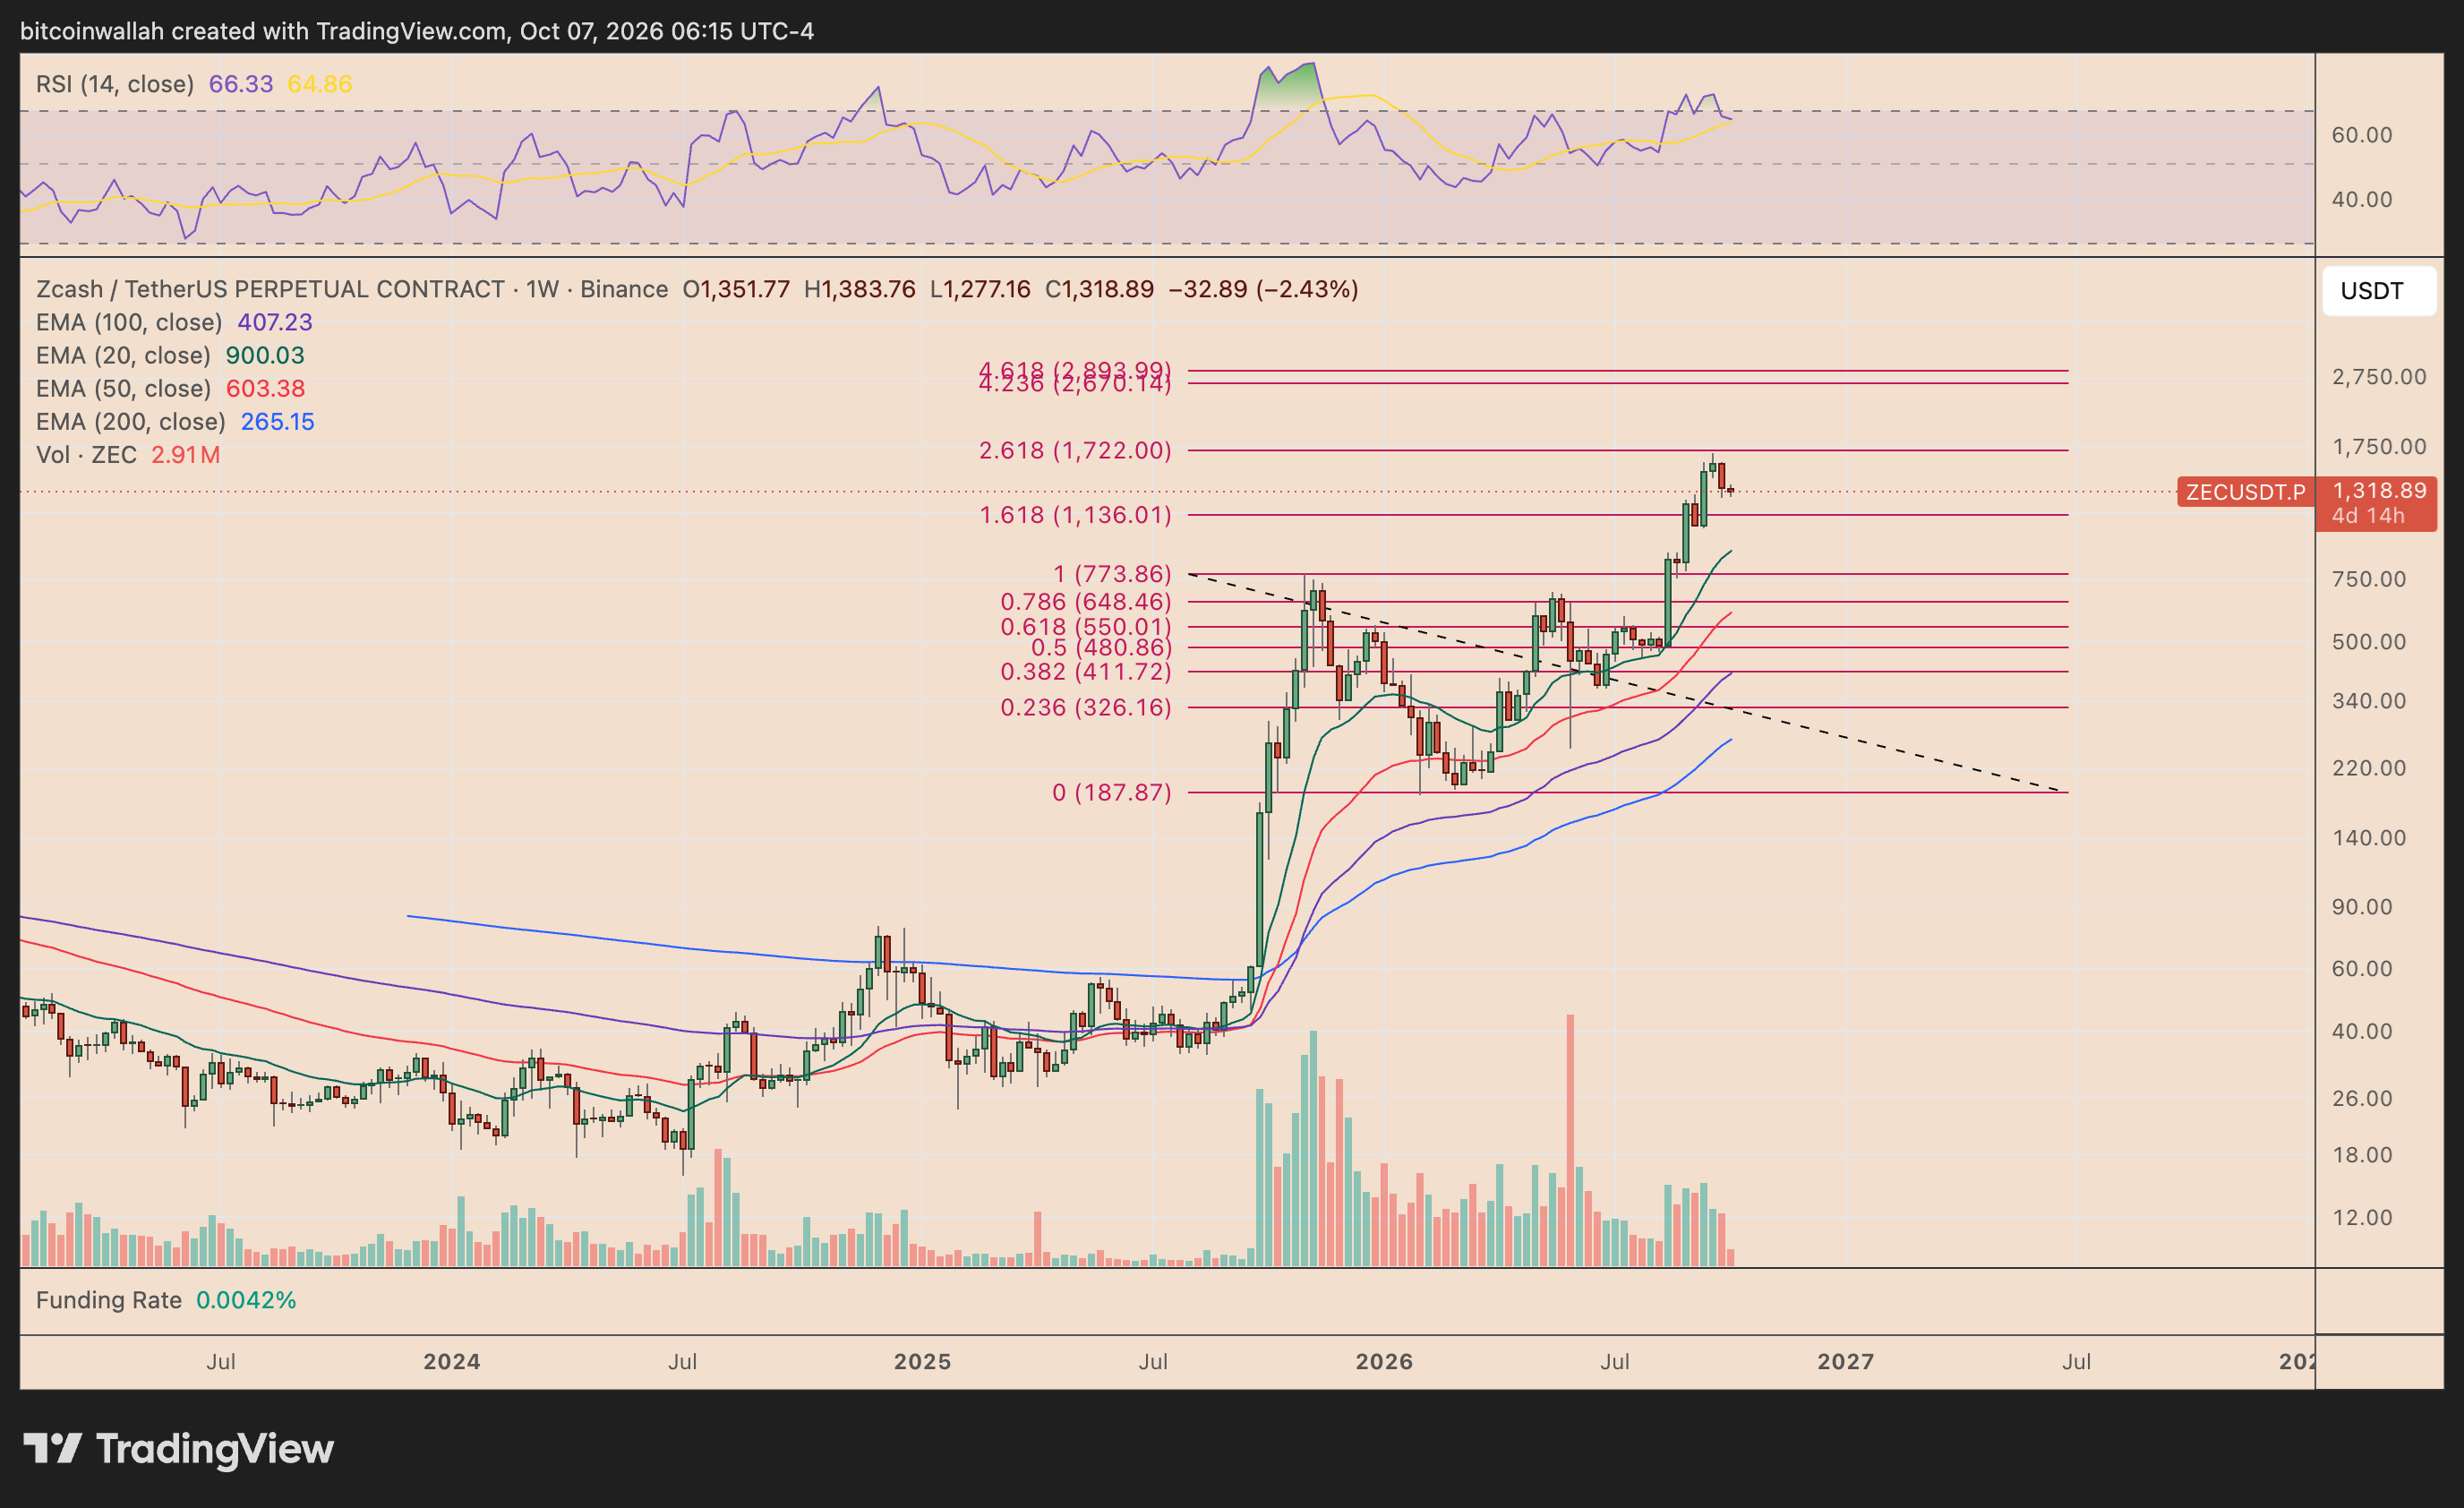
The $1,136 level is particularly important because it sits close to ZEC’s rising 20-week exponential moving average (20-week EMA), currently near $900 and climbing rapidly.
In other words, the broader downside zone sits between roughly $900 and $1,136.
A move toward $1,136 would represent approximately a 14% decline from current levels, while a deeper test of the 20-week EMA could amount to a roughly 30% correction.
The weekly RSI also supports the cooling scenario. Momentum remains elevated near the mid-60s after recently approaching overbought territory, leaving room for further normalization before ZEC establishes another sustainable advance.
For now, I would view the 1.618 Fib around $1,136 as the primary downside target, followed by the rising 20-week EMA if selling pressure accelerates.
That would also remain consistent with my previous bearish call, which anticipated a meaningful ZEC correction after its parabolic September rally.
Bear Pennant Breakdown Could Send ZEC Toward $990
ZEC is also forming a bear pennant on the daily chart, adding another layer of downside risk.
The pattern developed after the sharp decline from the late-September peak near $1,650, followed by a tightening consolidation around $1,300-$1,400. A decisive break below the pennant’s lower trendline could confirm bearish continuation.
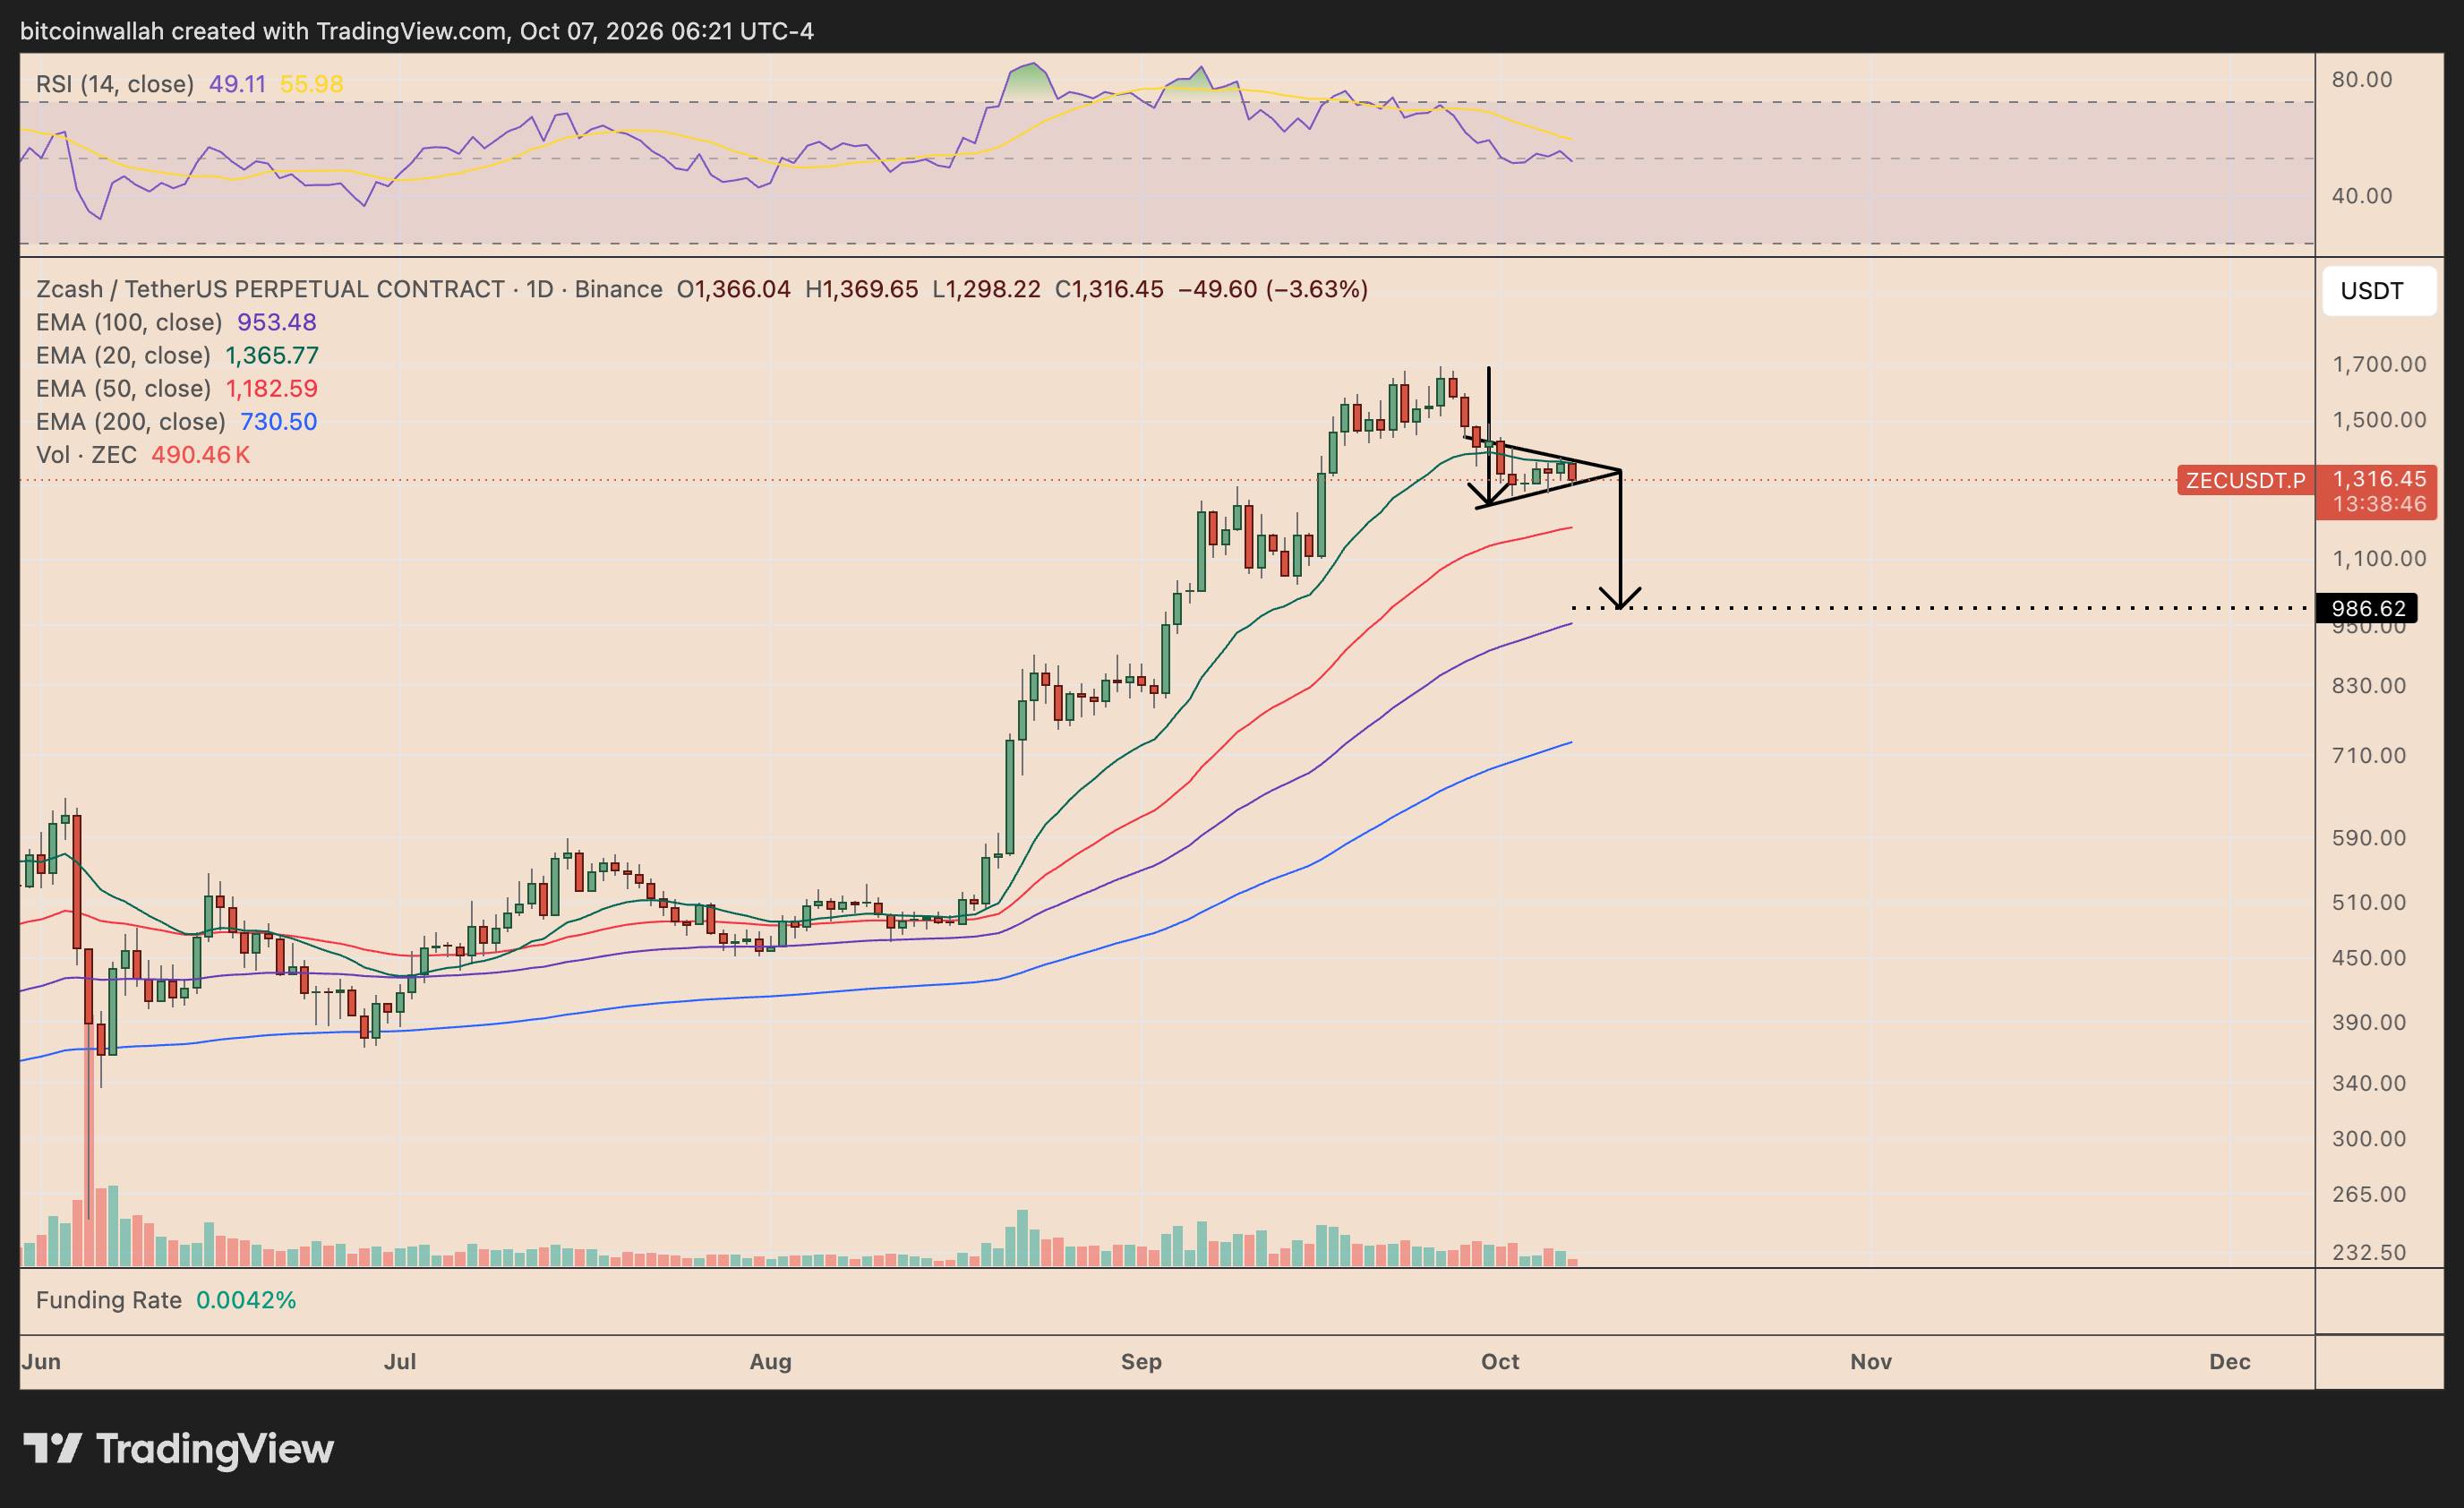
Based on the height of the preceding drop, the setup points to a downside target near $986-$1,000.
That target also sits close to ZEC’s rising 100-day EMA near $953, creating a broader technical support zone around $950-$1,000. A breakdown would therefore strengthen my expectation for a deeper retracement toward the weekly support levels discussed above.