Ethereum’s native token, Ether (ETH), fell more than 3% to around $2,605 on Oct. 7, extending its pullback from the September high near $2,800.
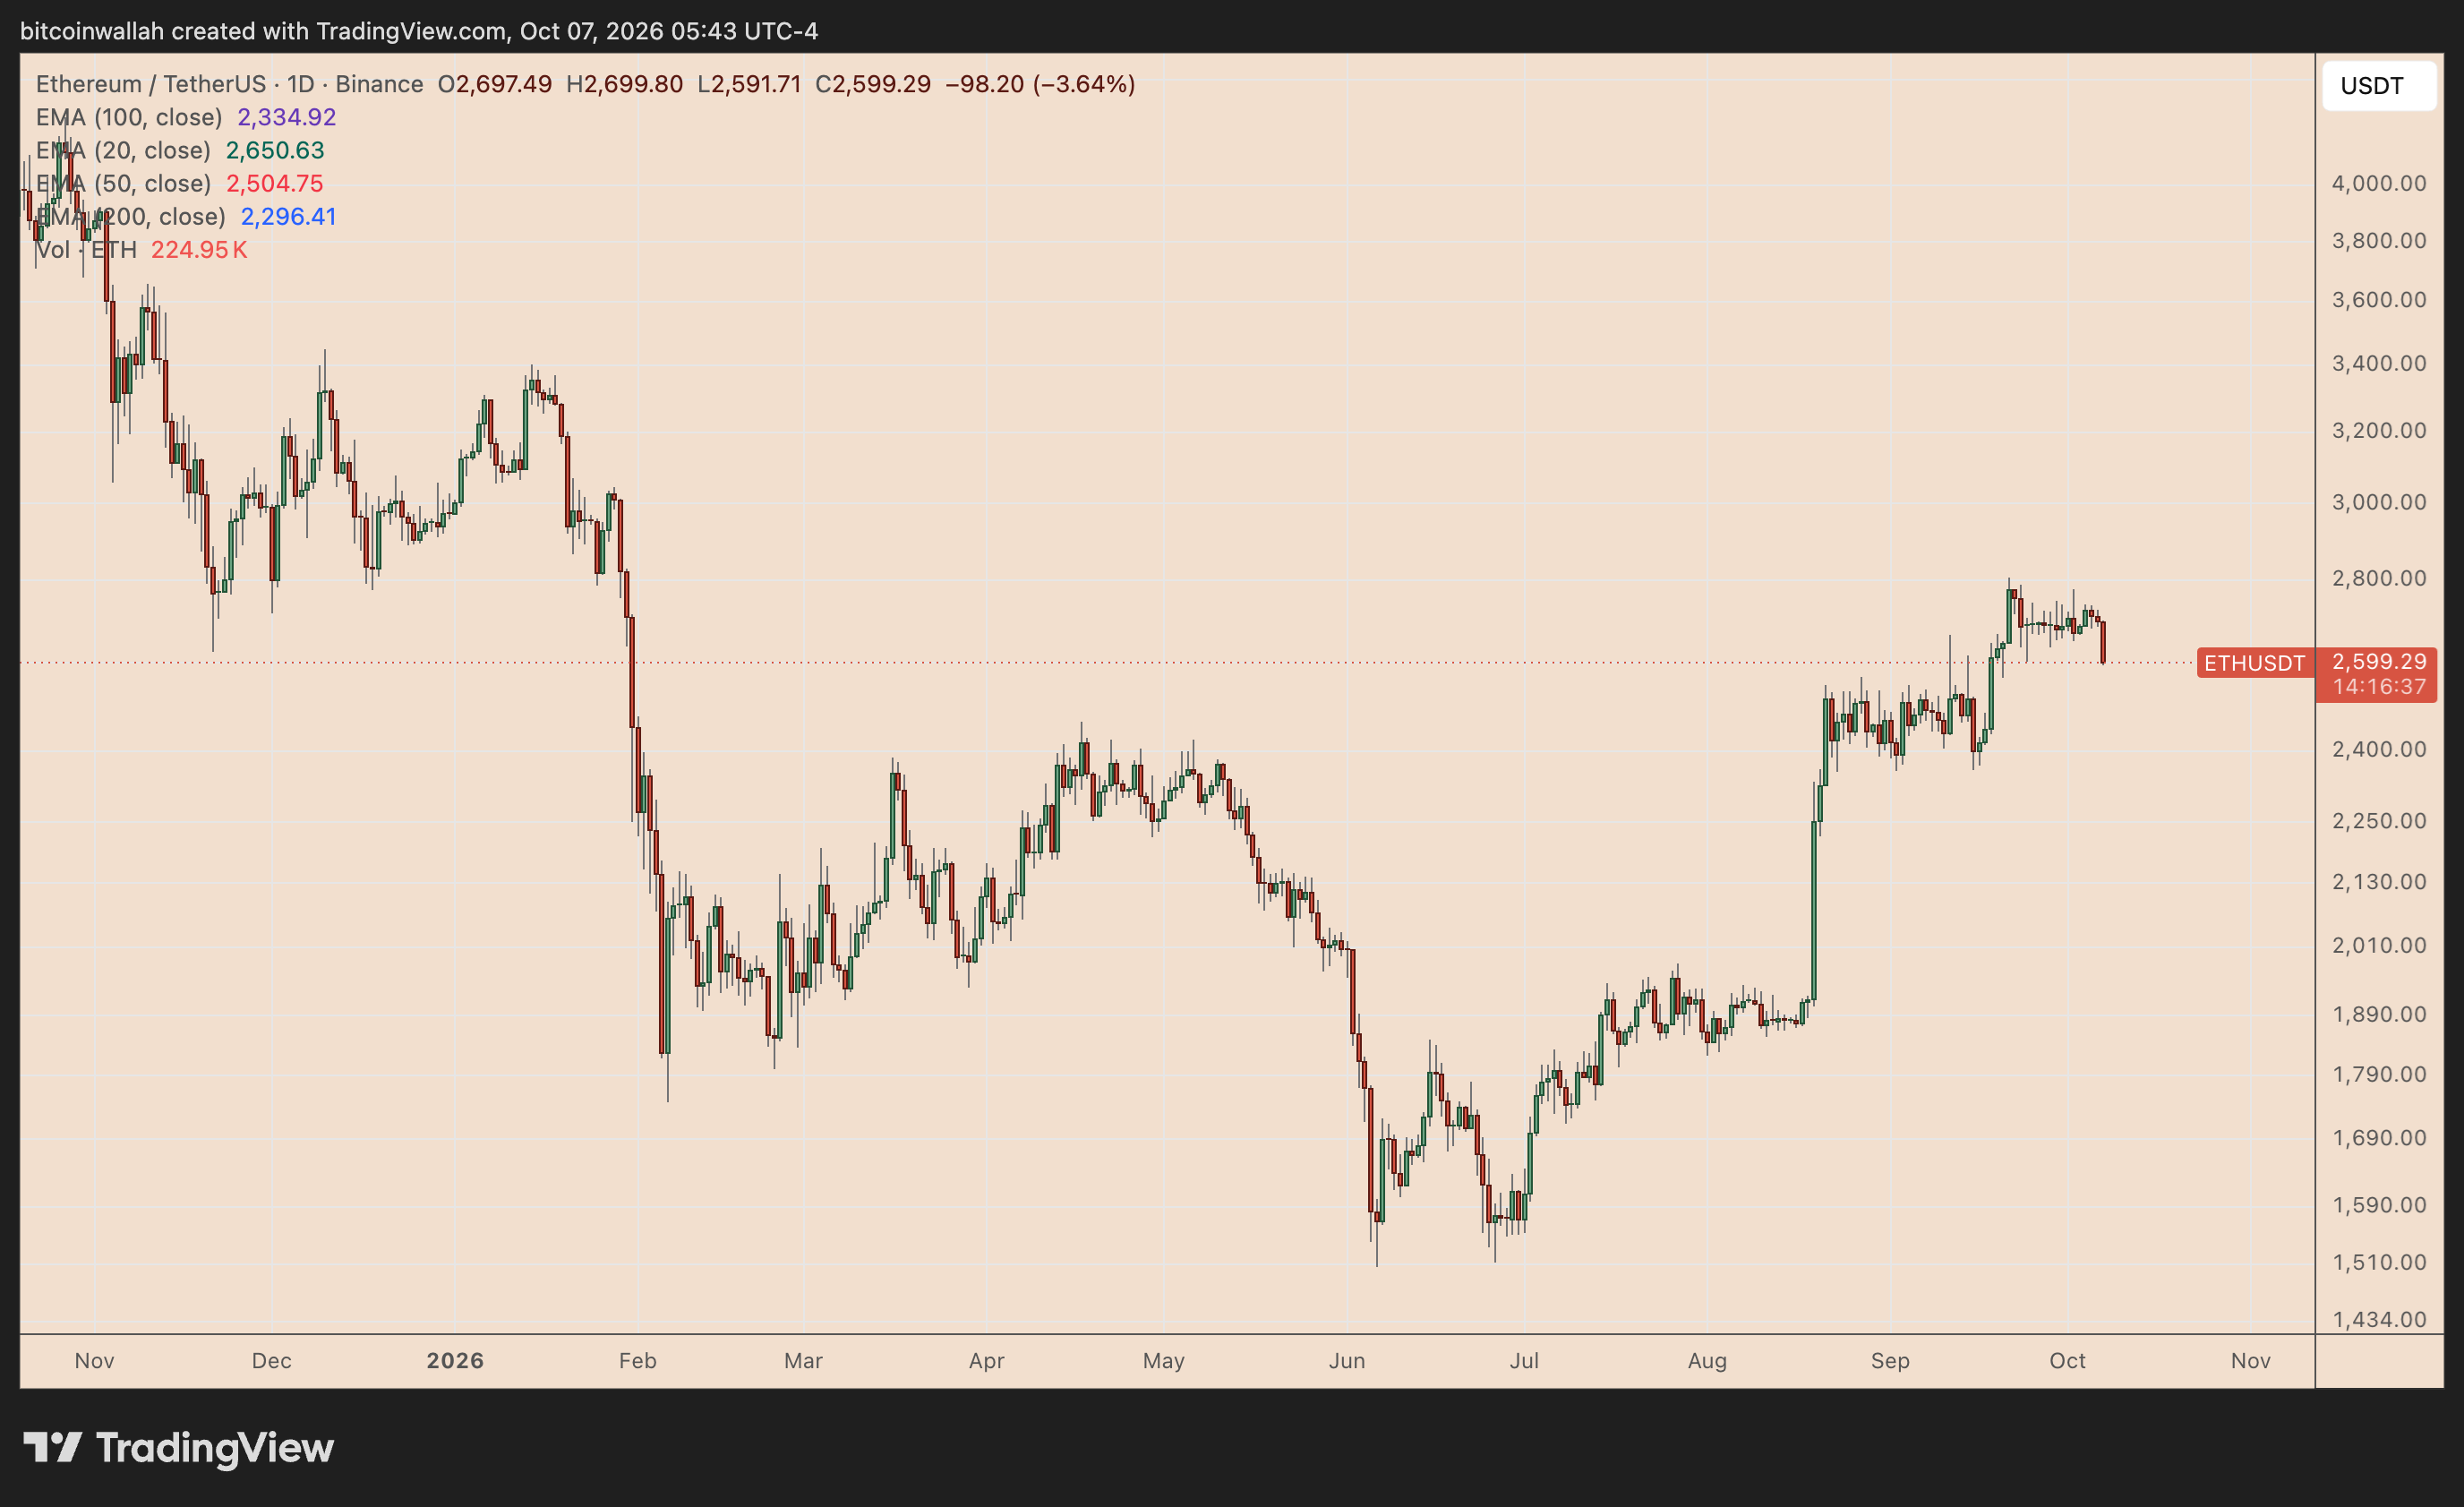
However, three technical and derivatives-market signals suggest the latest decline could be approaching exhaustion, potentially setting ETH up for a rebound toward $2,800-$3,000.

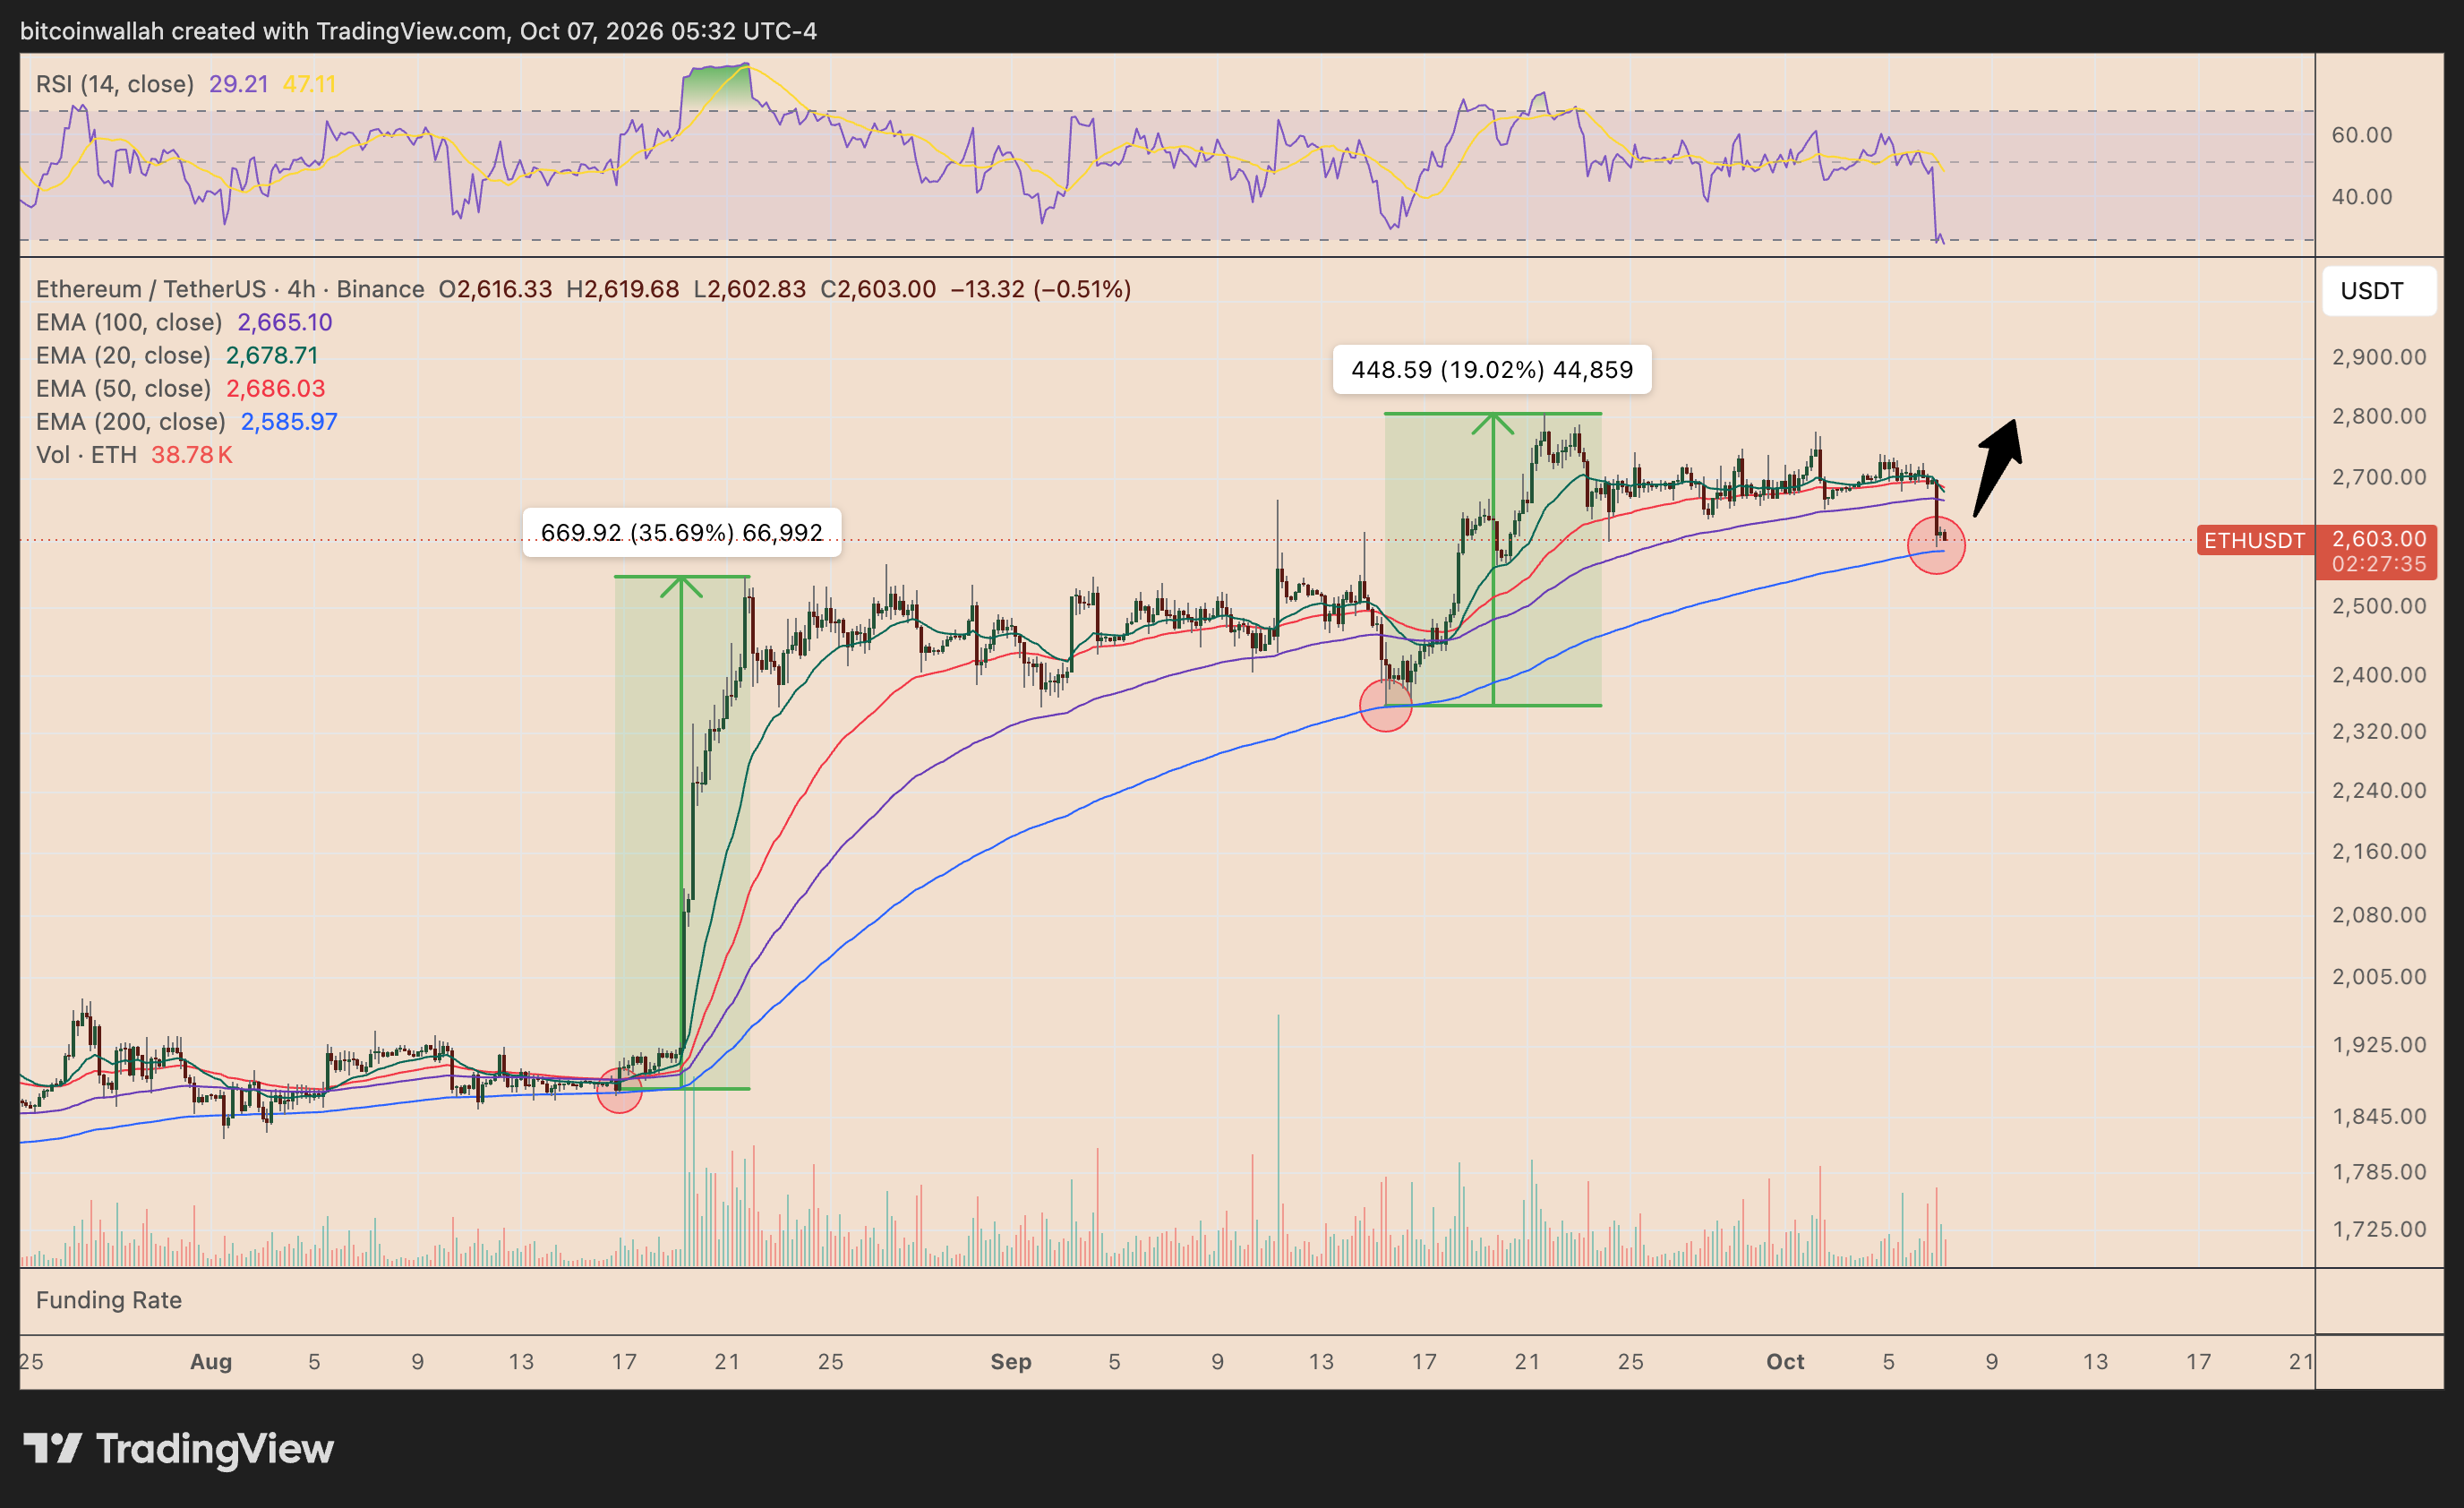
The combination has historically preceded strong rebounds.
In August, ETH rebounded roughly 35.7% after testing the same 200-4H EMA support, rising from around $1,850 toward $2,500.
A similar retest in mid-September preceded another 19% rally, taking Ether from approximately $2,350 to almost $2,800.
ETH is now testing the moving average for a third time.
A decisive rebound from the $2,580-$2,600 region would therefore strengthen the case for another move toward $2,700 initially, followed by a retest of the September high near $2,800.
Conversely, a sustained break below the 200-4H EMA would weaken the bullish fractal and expose ETH to deeper downside.
Ethereum Price Forecast
Every new Ethereum analysis as it publishes, today's technical signal and key levels, live price — on one page.
See all Ethereum forecastsFalling Wedge Keeps $3,000 ETH Target Alive
Ethereum’s daily chart offers another potentially bullish signal.
ETH has been consolidating inside what resembles a bull flag after rallying from below $2,400 to around $2,800 in September. Bull flags typically resolve upward when they appear during broader uptrends.
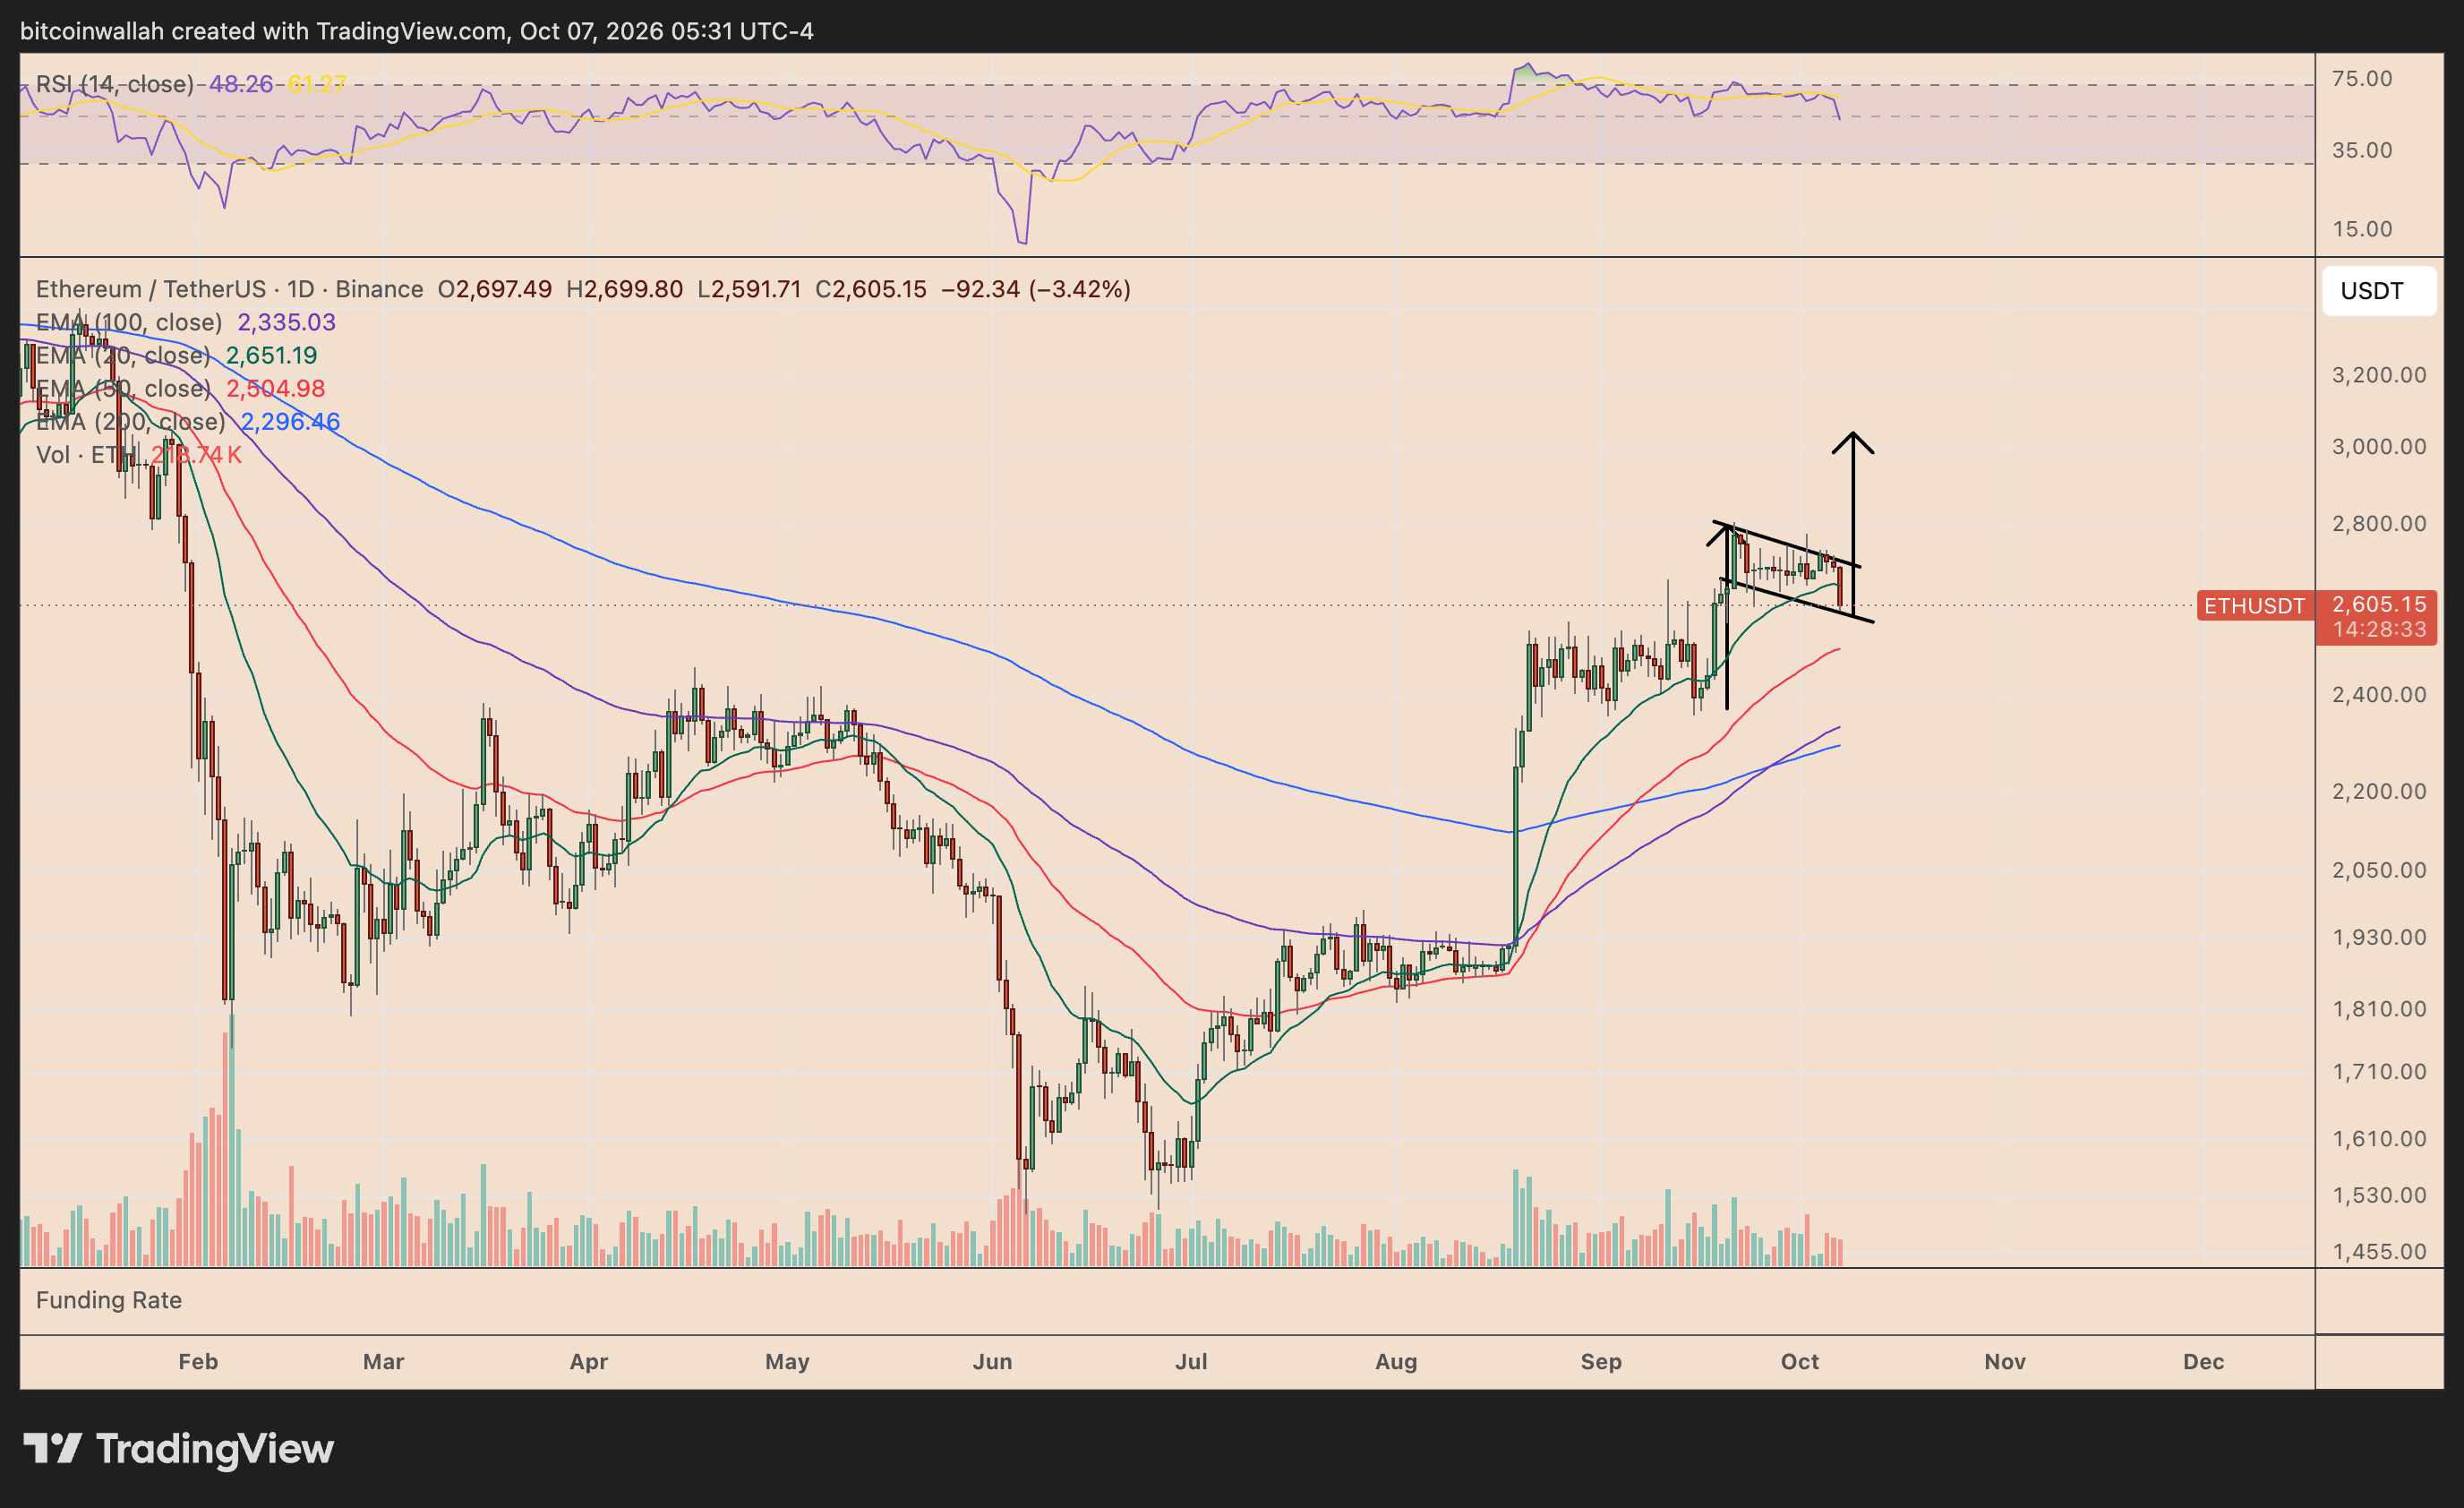
A rebound from the flag’s lower trendline, followed by a breakout above the upper boundary near $2,700-$2,720, could confirm bullish continuation.
The wedge’s measured upside target sits around the psychological $3,000 level, approximately 15% above current prices.
Moreover, Ether remains above its 50-day EMA (red) near $2,504, despite slipping below its faster 20-day EMA (green) around $2,651.
Its 100-day (purple) and 200-day (blue) EMAs are considerably lower at approximately $2,335 and $2,296, respectively. That keeps Ethereum’s broader recovery structure intact.
Liquidation Map Shows Liquidity Building Above ETH
Ethereum’s derivatives positioning also favors a potential short-term rebound.
CoinGlass’s Binance ETH/USDT liquidation heatmap shows $135.50 million worth of short liquidity clustered around $2,635-$2,645, directly above the current price.
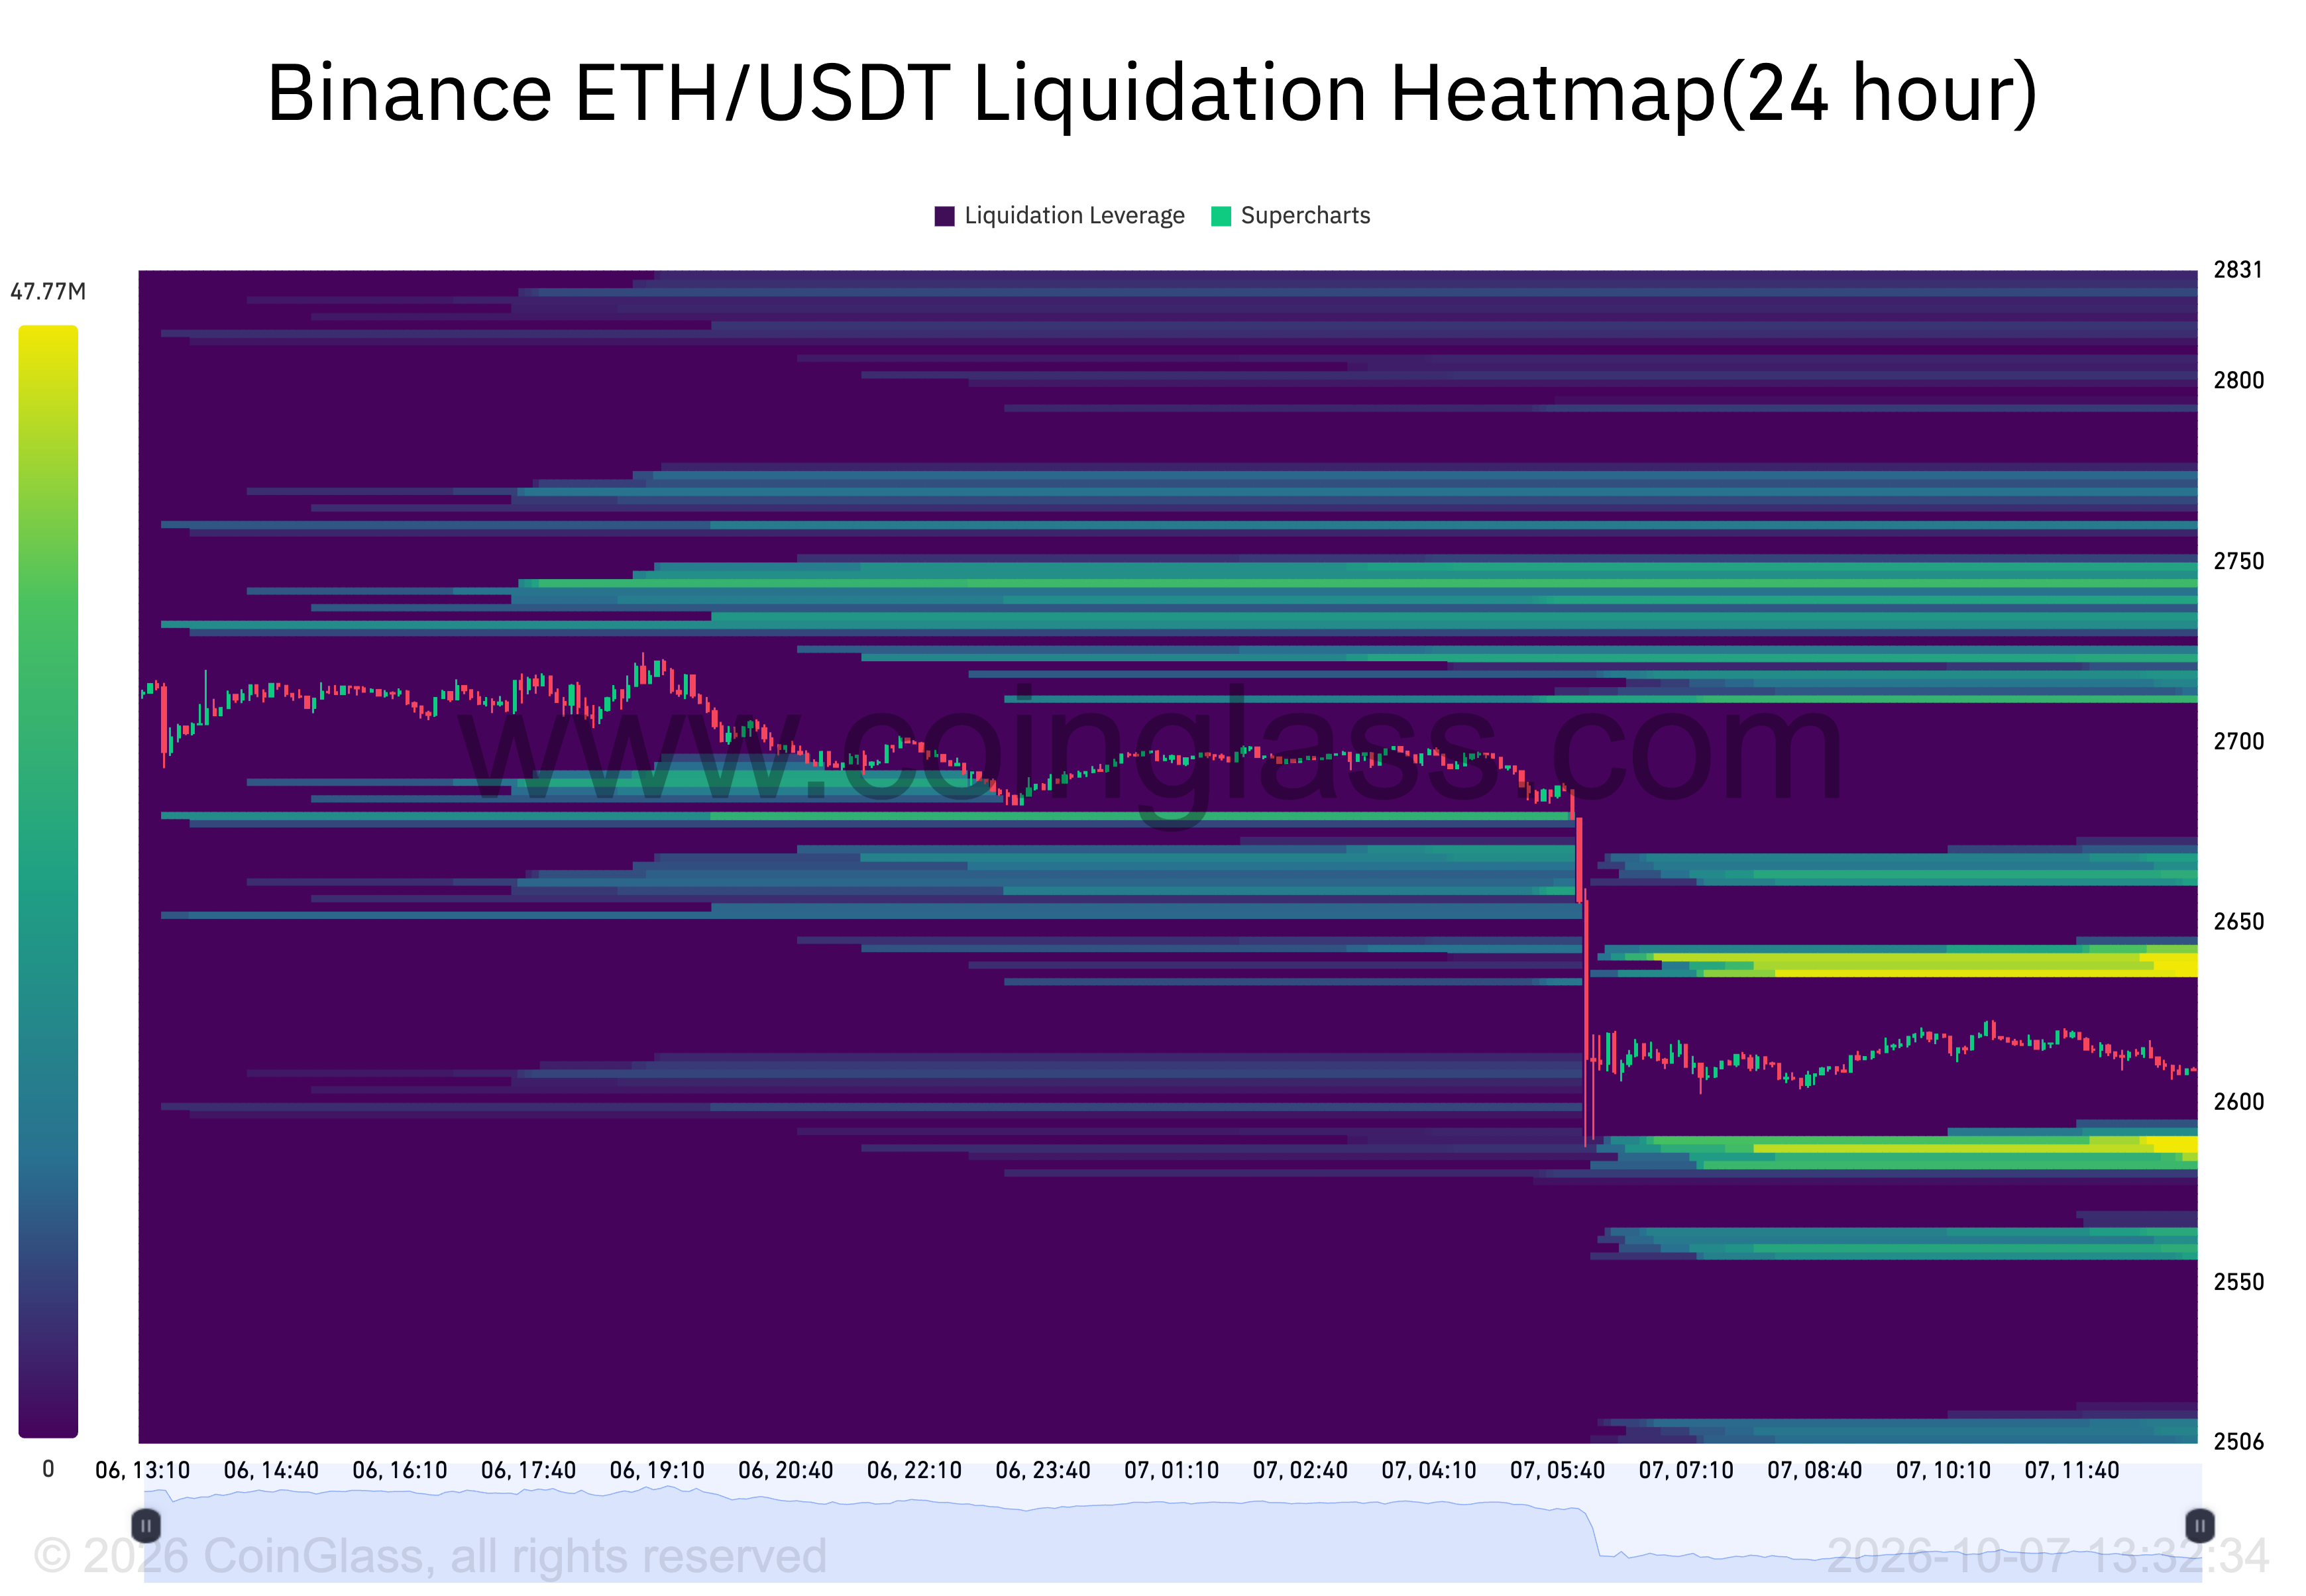
Another sizable cluster sits around $2,730-$2,750, which would liquidate around $400 million worth of short positions.
In comparison, the long liquidation clusters under the current ETH price are lower. That raises the possibility that the decline has already cleared some leveraged long positions below $2,600, leaving overhead short-liquidation zones as the next potential liquidity magnets.
A recovery above $2,640 could therefore accelerate toward $2,700-$2,750.
Combined with the oversold four-hour RSI, repeated 200-EMA rebound fractal, and bullish falling-wedge structure, the setup keeps $2,800-$3,000 in focus, provided ETH holds the crucial $2,580-$2,600 support zone.