



USOIL, UKOil & Natural Gas Outlook: Hormuz Disruptions Tighten Crude as LNG Demand Reshapes Gas Market
Oil markets continue to be supply dominated today as lingering concerns of the U.S.-Iran conflict disrupts shipping in the Persian Gulf today. Iran carried out a new attack on 10 vessels in the region and said that the U.S. sinking five oil tankers earlier was the largest attack on ships in the last six months. Until recently, there had been some hopes of a normalization of the flow of Gulf energy.
Shipping data confirm these concerns, as only seven ships passed through the Strait of Hormuz yesterday, compared to 12 a day earlier, as well as the ten day average of fifteen. Worryingly, no LNG ship went out of the Strait. One was a VLCC carrying close to two million oil barrels.
The physical situation remains tight for Brent and WTI as Gulf oil exports (including unreported dark oil shipments) are running at around 15 to 16 million barrels per day, which is two-thirds of the pre-war levels. The disruptions are now forcing Gulf oil producers to rely on more dark shipment oil trade and alternative routes.
Also, the U.S. Energy Information Administration (EIA) in its latest report, issued earlier today, has revised its 2026 and 2027 oil outlook upward as it noted the negative impact of Saudi oil production losses on global oil supply. The Houthis attacks also continue to threaten the alternative exports via the Red Sea.
As for natural gas, the outlook is more balanced. Based on the latest EIA figures, dry gas production is expected to hit a record 111.7 billion cubic feet a day in 2026, while LNG exports are predicted to reach a record of 17.4 bcfd. Coupled with that, inventories are projected to be approximately 5% higher than the 5-year average going into winter, offering a supply cushion for the domestic market. However, disruptions on Gulf LNG exports, especially through the Hormuz Strait, will create global competition for alternative cargoes and increase demand for US LNG.
Fundamental Bias: USOIL and UKOil are both bullish, along with Natural Gas, which is mildly bullish. Hormuz shipping flows remain the dominant near-term energy catalyst.
Natural Gas Technical Analysis: NG Breaks Below $2.84 as $2.74 Support Becomes the Next Test
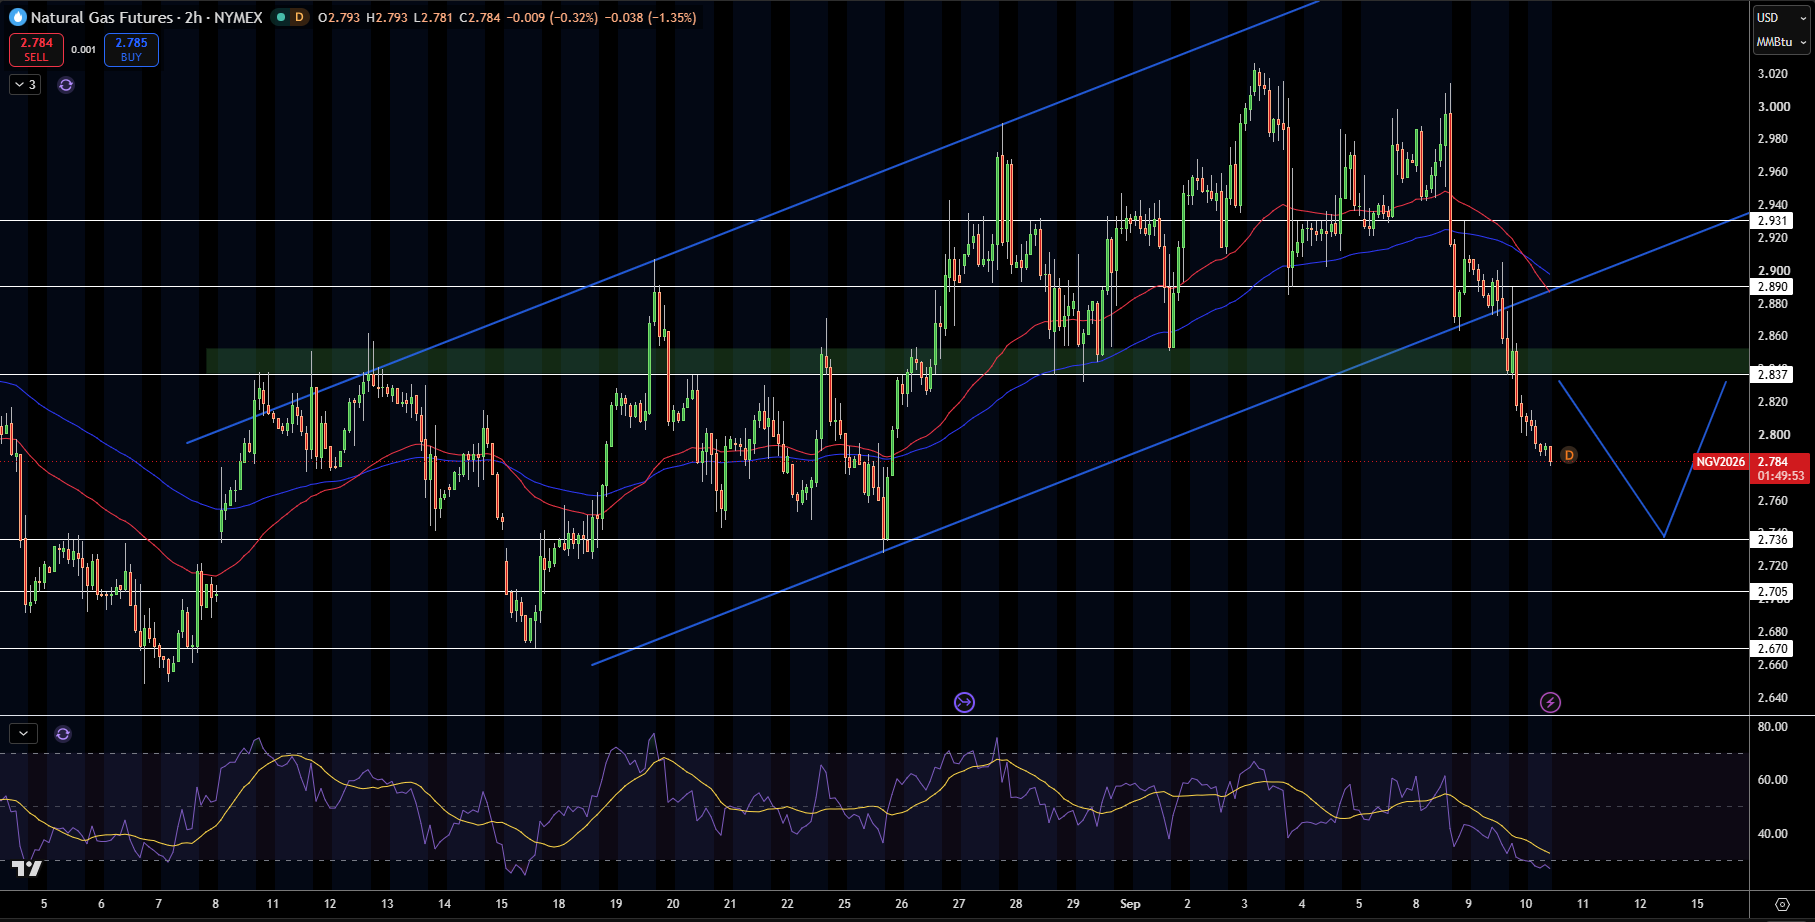
Natural gas stands at $2.78 on the 2-hour chart, and the level that interests me is the breakdown of the trendline and the former support zone at $2.84. Price has also dropped underneath the two moving averages, making this sell-off more significant than previous sell-offs during the bullish trend.
The first support level that I will be watching closely is at $2.74. A clear break below this level will put $2.71 and $2.67 in focus. Above $2.74, $2.84 is now the first important resistance level. $2.89 and $2.93 will be next. Buyers will have to bring price back above $2.84 to have the breakdown fill repaired in my view.
RSI has moved slightly into overbought territory, so there may be a short-term bounce, but overall the price momentum is weak overall. I am currently bearish on Natural Gas below $2.84. Natural Gas trading above $2.89 will give me reason to change that outlook, but until then, I consider $2.74 the next important level.
Natural Gas Price Forecast
Every new Natural Gas analysis as it publishes, today's technical signal and key levels, live price — on one page.
See all Natural Gas forecastsWTI Crude Oil Technical Analysis: USOIL Holds $94.89 as $97.23 Breakout Remains in Play
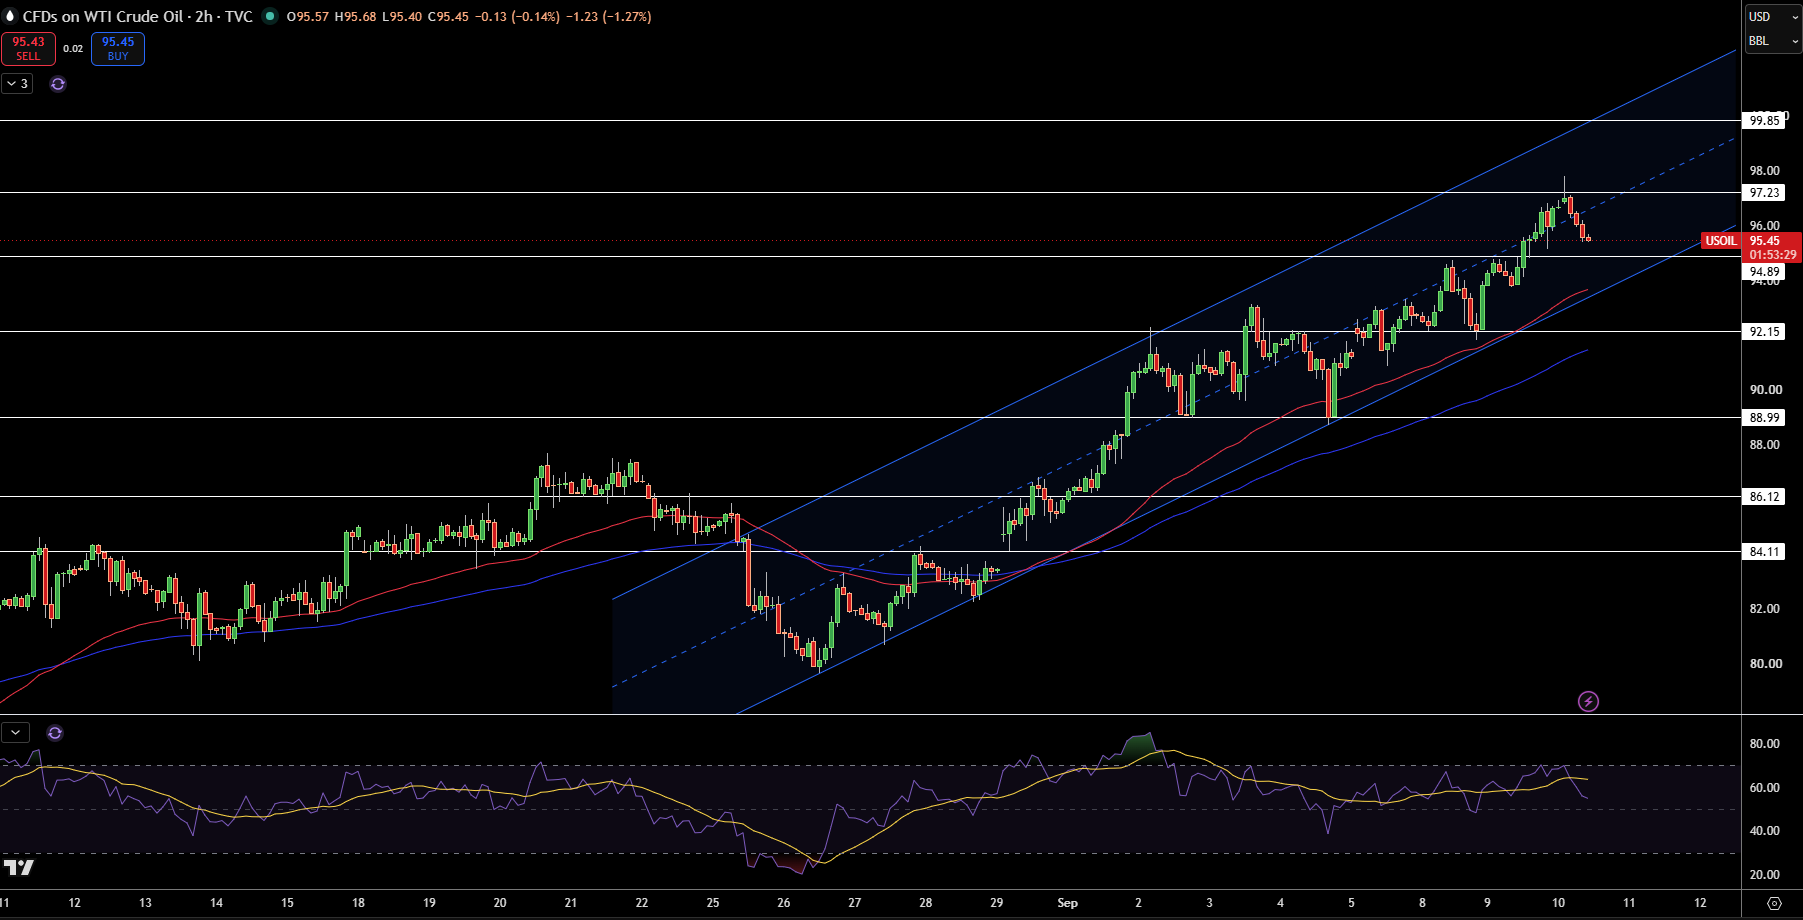
WTI crude is presently at $95.45 on the 2-hour chart. What I notice, is that pull back from the $97.23 area hasn’t broken the rising channel. The pullbacks have been forming lower highs and lower lows, but now buyers have defended the breakout zone at $94.89.
The level that I am watching first for resistance now is $97.23. If that resistance breaks, $99.85 will become the next higher target along with the upper channel. For support, $94.89 will be the first to break and $92.15 will be the second level. If $92.15 breaks, the bullish structure of the channel will start to break down.
RSI is still above the neutral point and is not at an overbought level. I will maintain my bullish prediction as long as WTI remains above $94.89. If it breaks below $92.15, I will reassess my position, but if $97.23 breaks, it will increase the probability of my going to $99.85.
Brent Crude Oil Technical Analysis: UKOIL Holds Above $99.41 as $101.96 Resistance Comes Into Focus
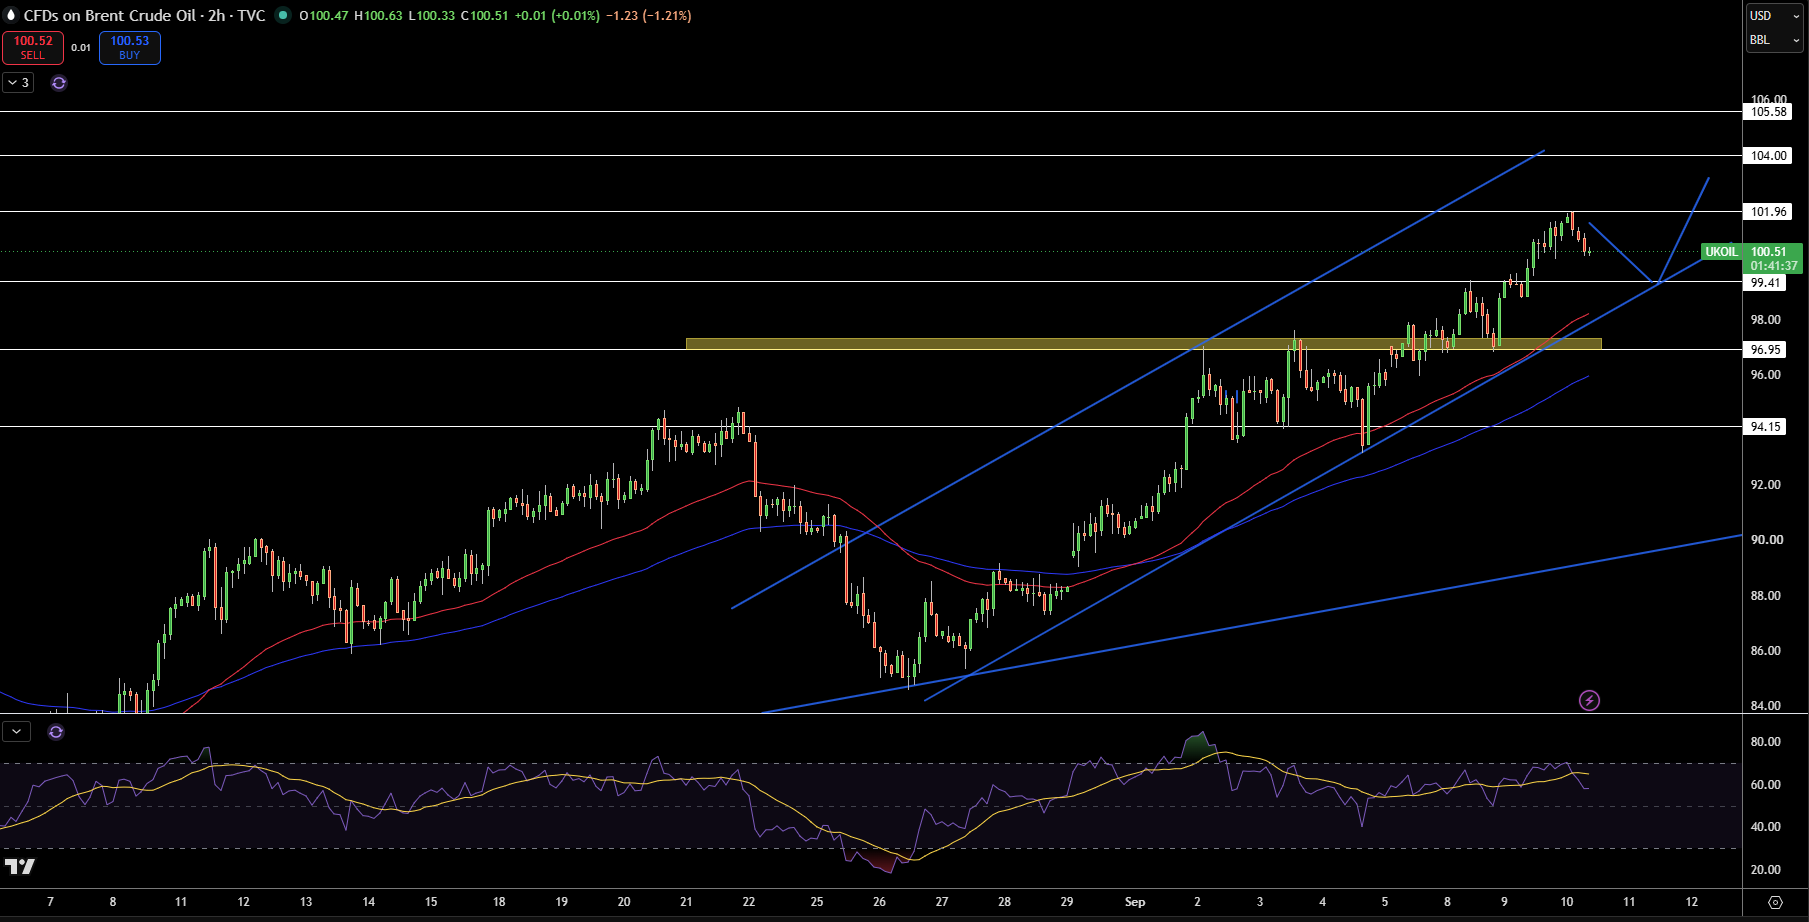
Brent crude is at $100.51 on the 2-hour chart. Price extended above the $96.95 level. Bid support quickly formed at $99.41 and kept price in the rising channel and the overall higher low sequence.
The next milestone I am watching is $101.96. If it breaks above that, I see the path opening up to $104.00 and the region of interest that spans up to $105.58. If we were to break below $99.41, then $96.95 is the next support level. Breaking below here would suggest that the breakout is the start of a downtrend.
RSI is currently in the upper half of its range, but is not yet showing signs of being excessively bullish. For now, bullish sentiment is still justified while Brent is trading above $99.41 with $101.96 acting as the resistance level to be broken in order to remain bullish. A break below $96.95 would no longer warrant a bullish trade.