
Oil News: Hormuz Deal Hopes Clash With Fresh Supply Threats
Oil fundamentals this week face a mixed bag of news. There is optimism for an easing of the tenuous Iranian shipping situation through the Strait of Hormuz. However, the situation remains very volatile. While Oman and Iran are finalizing a deal to create new shipping lanes, Iran has stated that the Strait of Hormuz will not be opened fully until the US meets several demands, including providing compensation for US assaults. This announced deal follows the Iranian aligned Houthis reportedly attacking the Saudi Arabian Jazan refinery. The conflicts in the region have reportedly attacked 15 of the Abu Dhabi National Oil Company’s vessels that were transiting through the Strait of Hormuz.
Evidence of the attacked shipping vessels has started to impact Chinese and Asian trade. During the months of June and July, China’s imports of crude oil fell to just 7.78 million bpd, which translates to 4.21 million bpd less than the three month average prior to the Iranian Conflict that was 11.99 million bpd. During July 2023 alone, crude oil imports to China fell 24.3% compared to July 2022. July 2023 crude oil imports for the rest of Asia totaled just 22.82 million bpd, or about 4 million bpd less than the average crude oil imports prior to the Iranian conflict, which shows that Middle Eastern exports are constrained by about 5 million bpd.
While supply outside the Gulf is showing some improvement, it is minimal and constrained by other shipping issues. Russian crude and condensate production jumped by an estimated 100,000 bpd in July to just above 9 million bpd, due to increased exports and recovering refinery runs. Russian drone strikes on refineries and constrained Black Sea shipping will limit that improvement.
Natural gas revolves around two things: storage and LNG security. The latest EIA storage data shows U.S. inventories are relatively healthy which provides some domestic security, while Hormuz remains critical to global LNG movement. The EIA’s following Short-Term Energy Outlook is due August 11 and will be the next major U.S. Gas movement trigger, along with updated production, storage and LNG-export forecasts.

Natural Gas Technical Analysis: Break Above $2.73 Improves Short-Term Momentum
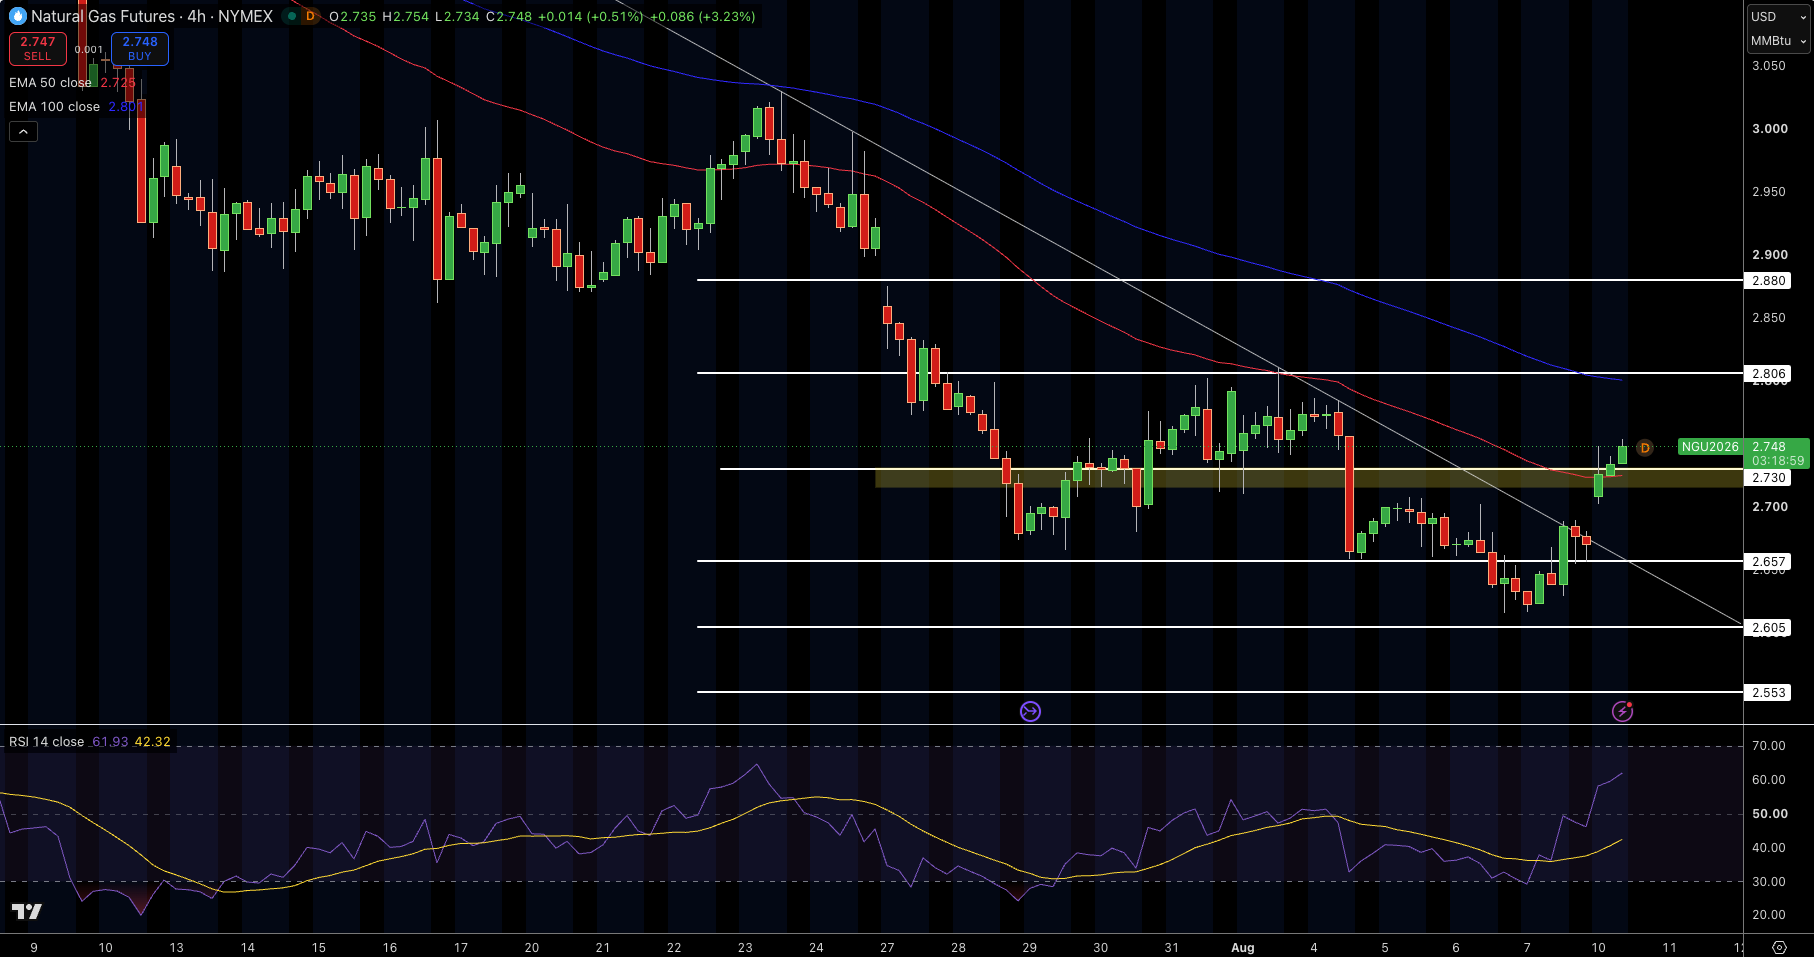
Natural gas is trading around $2.75 after breaking through the former $2.73 resistance zone, and is now targeting the descending line that has been in place since late July. The move has brought price action above the 50 period EMA situated around $2.73, with the 100 period EMA at $2.81, the next significant barrier. After multiple attempts at $2.66 support, increased bullish demand has been shown with the defensive presence, resulting in an RSI increase above 61, confirming the stronger short-term momentum with no extreme overbought levels hit.
Immediate resistance is around $2.81, followed by $2.88. New support is at $2.73, with $2.66 and $2.61 acting as lower support. I believe that $2.73 support is the first step in attempting $2.81, while a move below the $2.73 zone should be seen as a natural gas move to a bearish range.
Natural Gas Price Forecast
Every new Natural Gas analysis as it publishes, today's technical signal and key levels, live price — on one page.
See all Natural Gas forecastsWTI Crude Oil Technical Analysis: WTI Tests Triangle Resistance Near $78.00
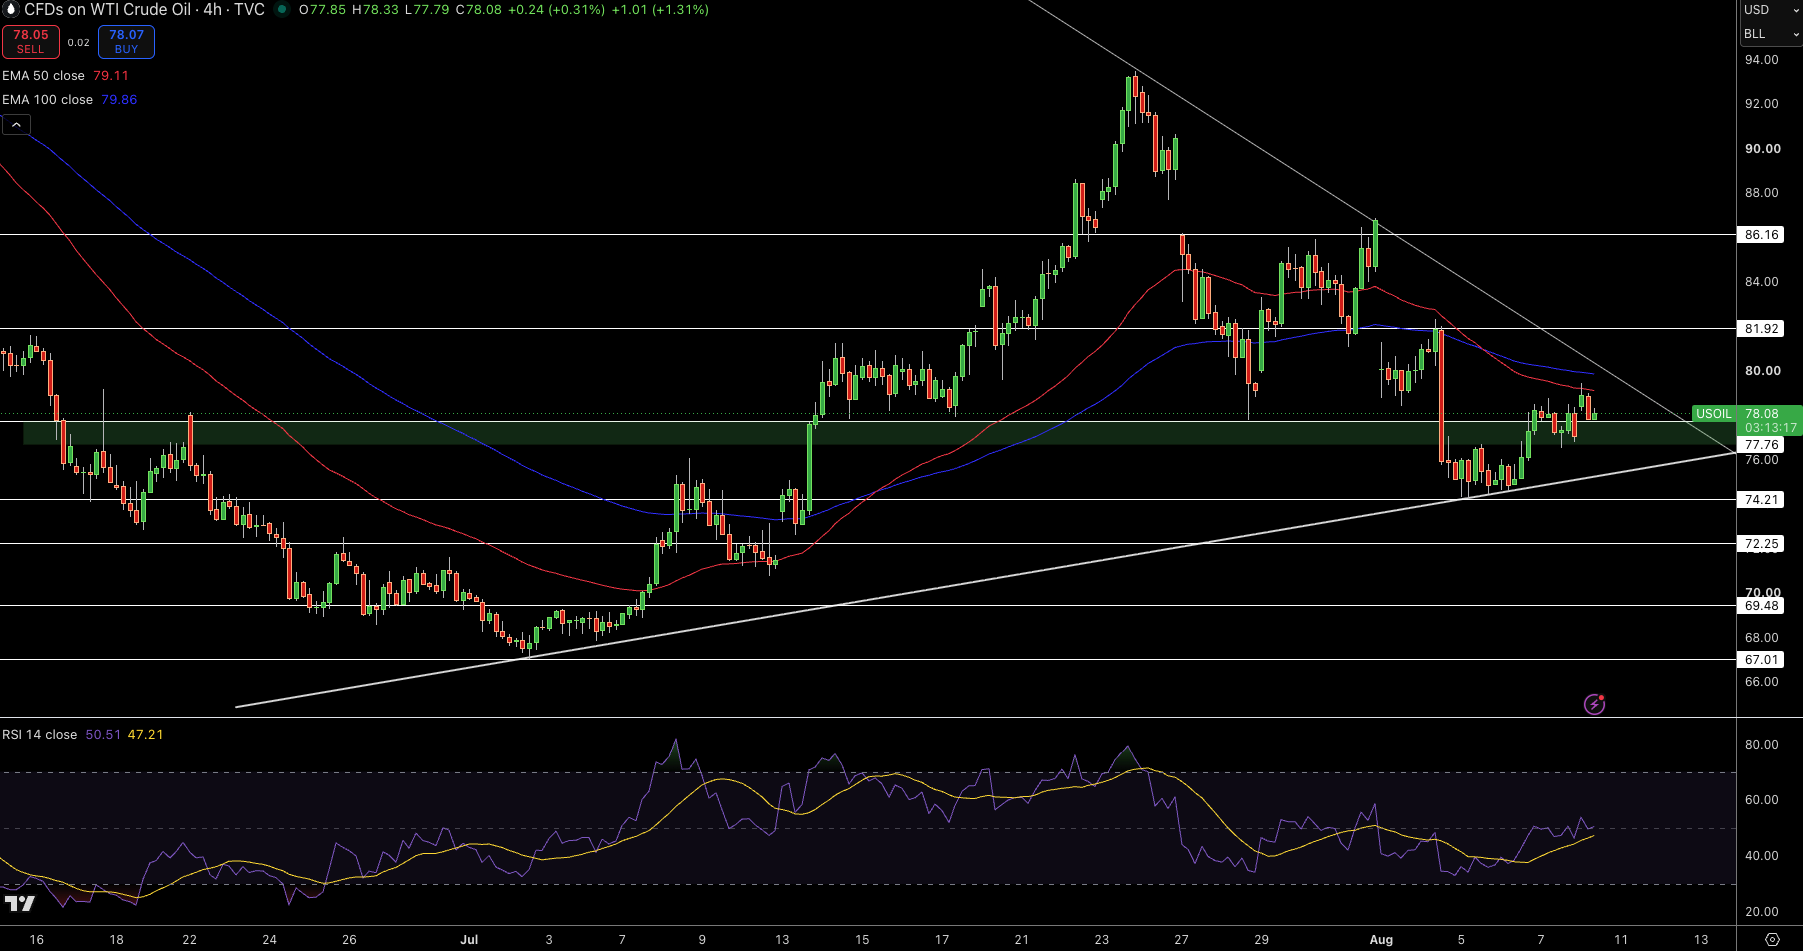
Currently, WTI crude is valued at approximately $78.08, recovering from a recent low at about $74.21. Resistance is seen from the falling trendline and the 50-period EMA at $79.11. We see insufficient evidence to turn the short-term bearish to bullish given prices remain below the 100-period EMA at $79.86. Recent price action shows buyers defending the $77.76 support zone. In addition, higher lows along the rising trendline see a triangle pattern developing.
The RSI sits around 51, and as such, we have no strong directional evidence. 79.10–79.90 is seen as strong resistance and a break of this area is required to target $81.92. Additionally, if rejection occurs along the rising trendline, we may see $77.76 retested.
A break below $77.76 is seen as $74.21 targeted, followed by $72.25. Given the current price action along the triangle pattern, I see no set-up. Confirmation is seen with a break of the resistance trendline, and the EMA’s.
Brent Crude Oil Technical Analysis: Brent Compresses Below $84.40 as Triangle Nears Breakout
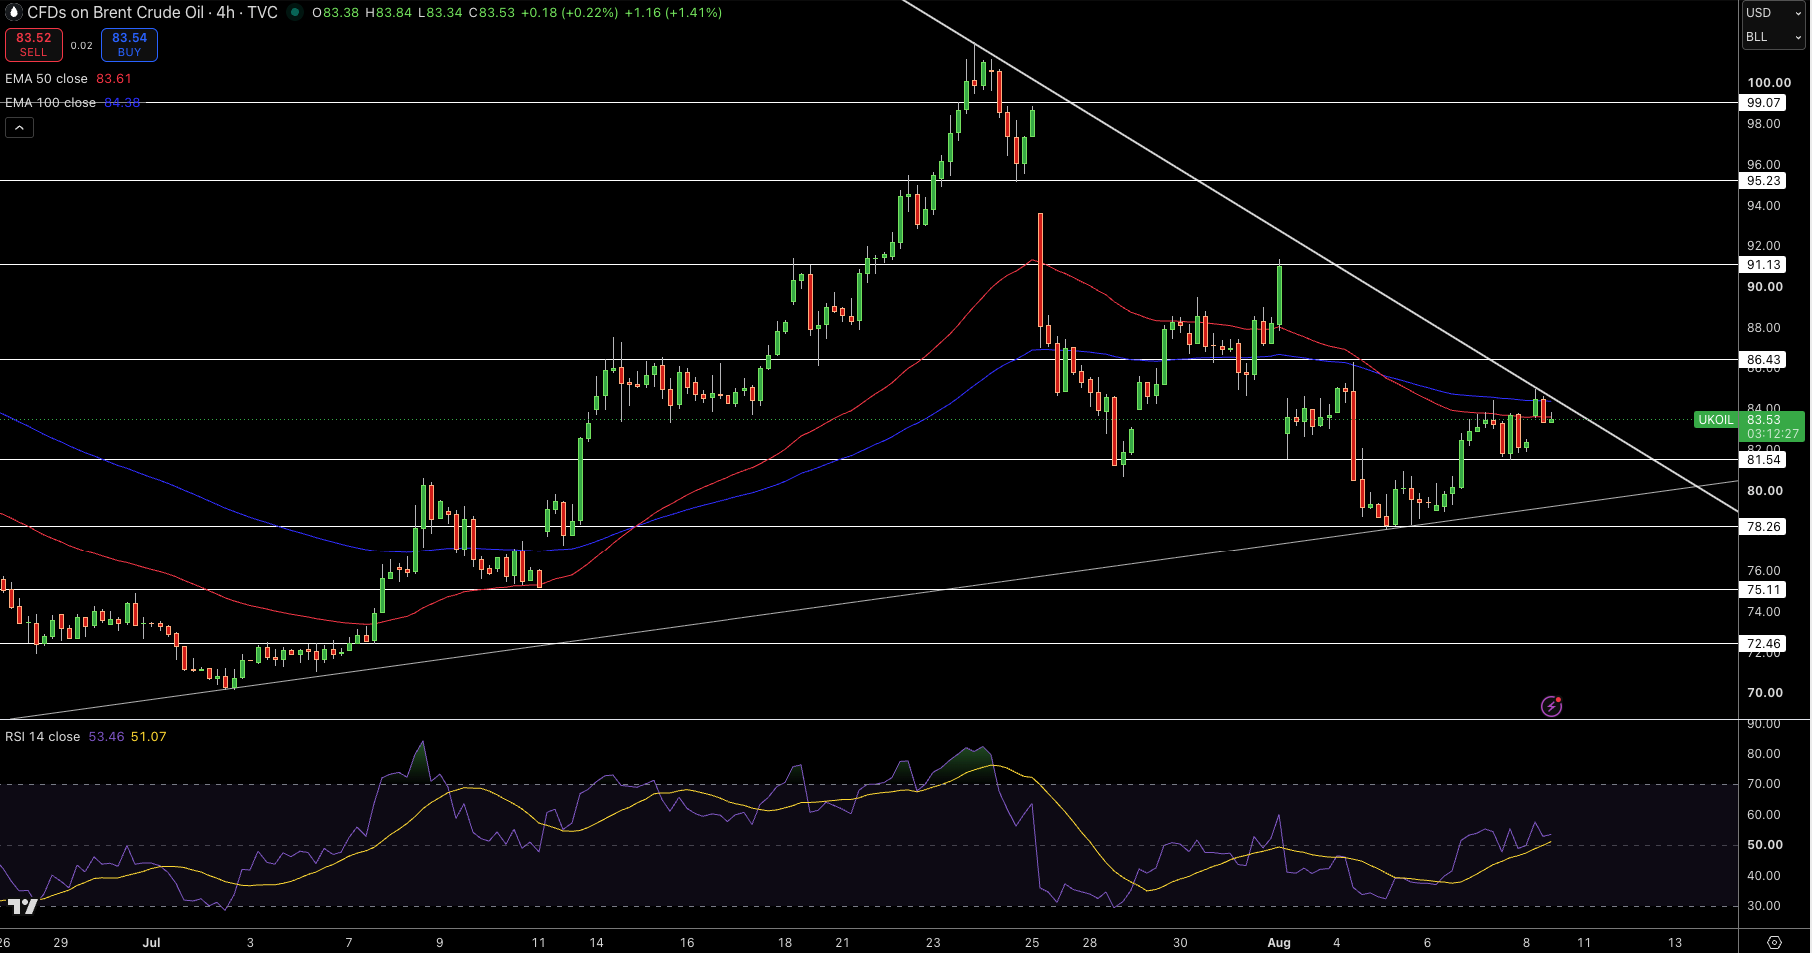
Brent crude is currently around $83.53 following a consolidation phase that has the price boxed in by a bearish resistance line and a long-term bullish support line. The price of Brent crude is around the 50-period EMA ($83.61), holding below the 100-period EMA ($84.38). The short-term price trend is neutral, with a bearish sentiment. Recent candlesticks show a desire for buying above $82.17, and so far, there has been no success breaching the clustered resistance of $84.40-$86.33.
With an RSI around 53, there is no cause for concern as there is no overbought trend and there is room for more buying activity. Improving the overall sentiment of the market for Brent crude is a breach of the $84.38 level and the bearish resistance line, with the first target at $86.33, and the next target at $91.13. Lack of a breach of resistance will bring Brent crude back to $82.17, with the trend support line around $78.26.
I believe that Brent crude is approaching a significant breakout point, as the current consolidation phase cannot (and should not) last much longer.