
This stability and potential cuts positively influence the natural gas market by maintaining balanced supply and supporting prices amid anticipated summer demand.
Natural Gas Price Forecast
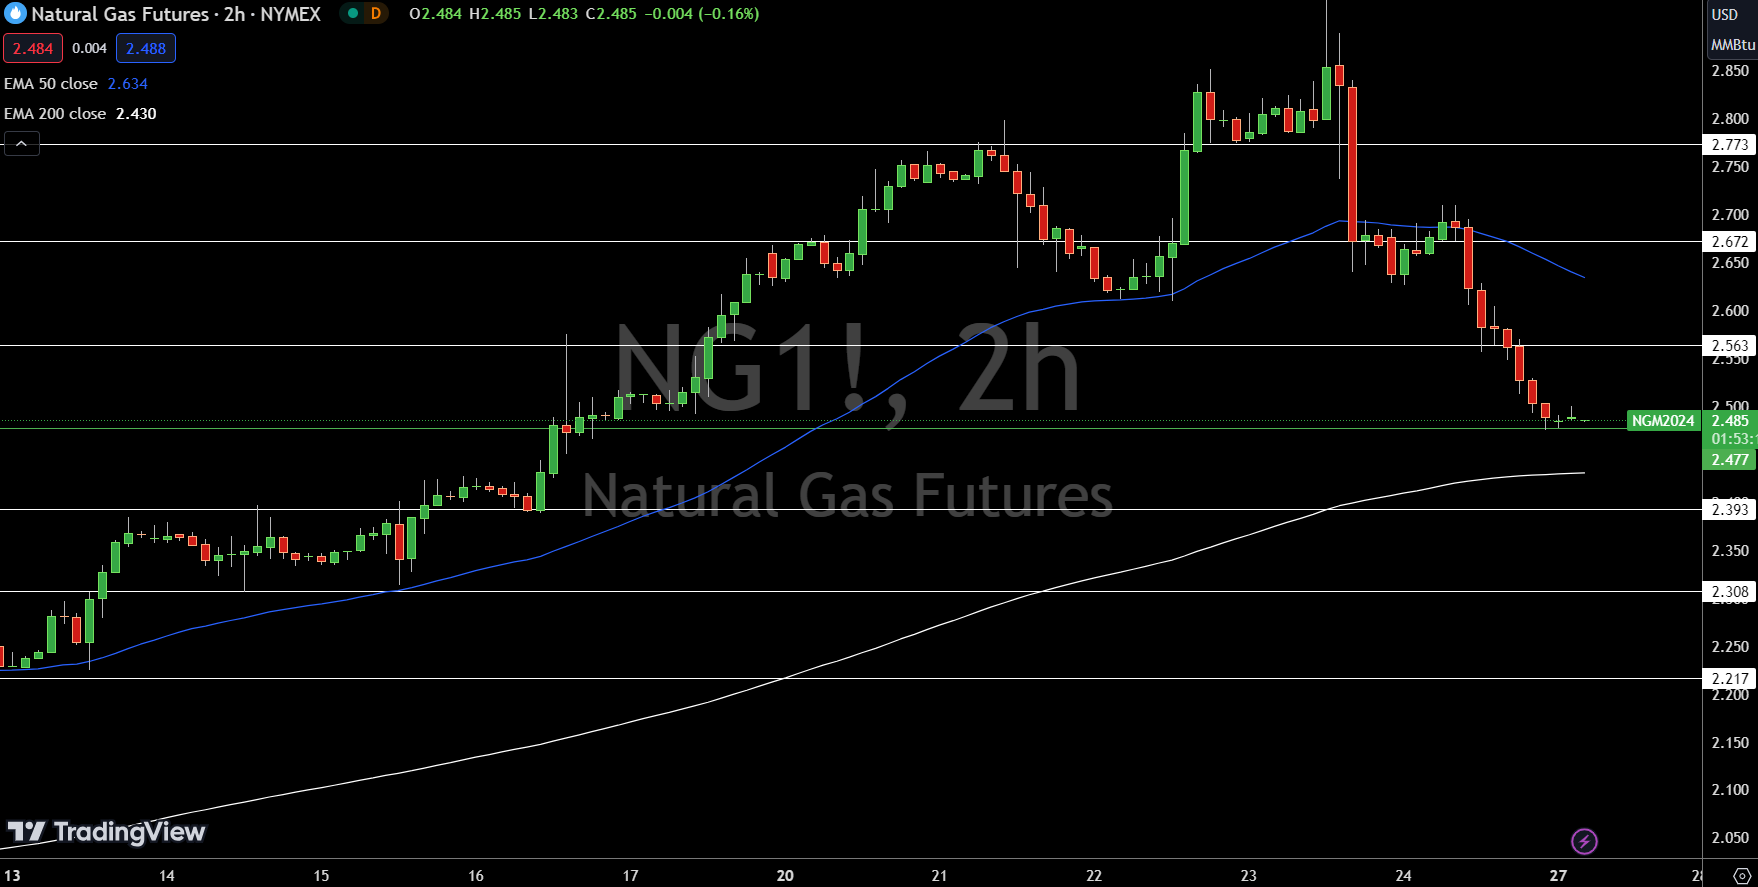
Natural Gas (NG) is trading at $2.485, up 0.40%. The pivot point is $2.48, a crucial level for market direction. Immediate resistance levels are $2.56, $2.67, and $2.77.
On the downside, support levels are $2.39, $2.31, and $2.22. The 50-day Exponential Moving Average (EMA) is $2.63, indicating a resistance level, while the 200-day EMA at $2.43 suggests significant support.
The outlook remains bullish above $2.48; however, a break below this level could trigger a sharp selling trend.
WTI Oil Price Forecast
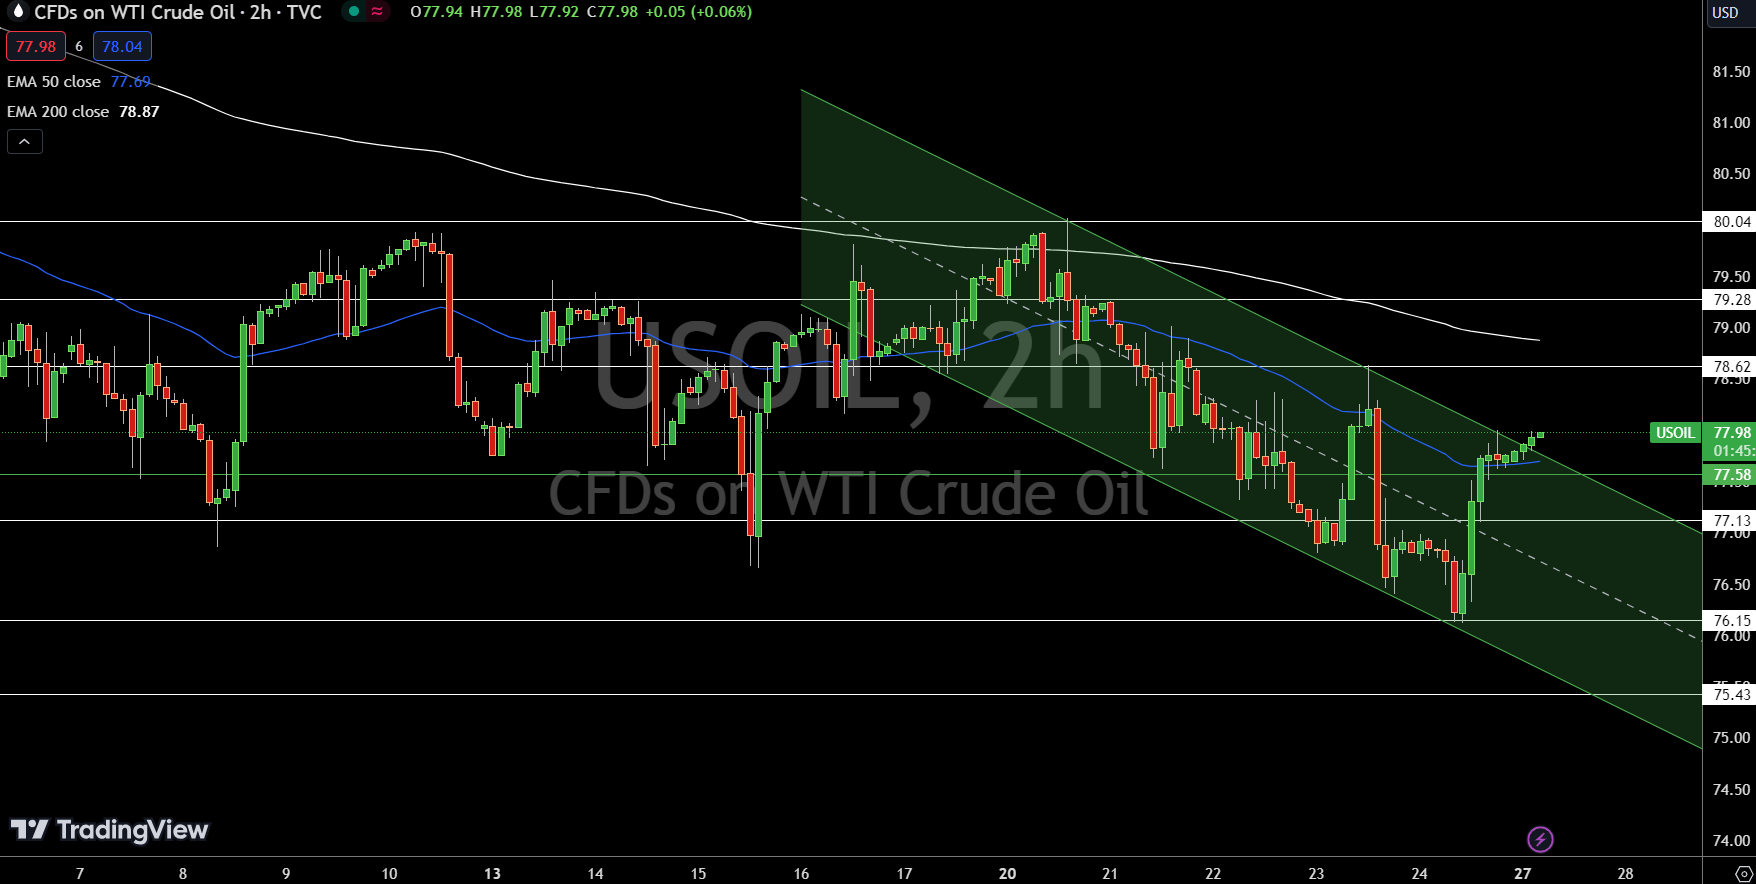
USOIL is currently trading at $77.98, reflecting a 0.28% increase. The pivot point, marked at $77.58, is a critical level for determining market direction. Immediate resistance levels are $78.62, $79.28, and $80.04, while support levels are $77.13, $76.15, and $75.43.
The Relative Strength Index (RSI) stands at 58.00, indicating moderate bullish momentum. The 50-day Exponential Moving Average (EMA) is positioned at $77.69, and the 200-day EMA is at $78.87, suggesting mixed signals.
Overall, the outlook is bearish below the pivot point of $77.58, but a break above this level could boost bullish sentiment, whereas falling below could lead to increased selling pressure.
Brent Oil Price Forecast
For a look at all of today’s economic events, check out our economic calendar.