
Oil News: U.S. Inventory Data and OPEC+ Supply Shift Drive Energy Markets
Fresh U.S. inventory data, latest decisions on production levels by OPEC+, and persistent geopolitical risks in the Middle East are currently shaping crude oil fundamentals. The U.S. Energy Information Administration (EIA) reported that commercial crude inventories increased by 2.5 million barrels to 407.0 million barrels in the week ended July 31. Analysts had expected a 1.2 million-barrel draw.OPEC+ left its fourth-quarter strategy unmoved as members continue reviewing production capacity in the run-up to 2027 quota deadlines. While OPEC+ confirmed a 188,000-barrel-per-day production increase for September, completing the unwinding of the 1.65 million bpd voluntary production cuts introduced in 2023, the group left its fourth-quarter strategy undecided as members continue reviewing production capacity in the run-up to 2027 quota deadlines.
Geopolitical risks in the Middle East are still important.In the week ending July 31, analysts expected a 1.2 million-barrel draw; however, the actual figure was a 2.5 million barrel build. U.S. crude oil inventories now stand at roughly 6% below average seasonal inventory levels, while gasoline and distillate inventories continue to fall which highlights persistently strong fuel consumption despite the ongoing peak summer driving season.
As usual, the fundamental aspects of natural gas are constructive. While U.S. natural gas storage levels are healthy, the U.S. Energy Information Administration (EIA) expects U.S. LNG (liquified natural gas) exports to average 17.2 Bcf/d in 2026, supported by new export capacity and robust international demand. Investors are watching the U. Natural Nonfarm Payrolls report for this week, where economists expect the economy to add a little over 95,000 jobs after 121,000 in June. A softer job market would support expectations for less restrictive Federal Reserve policies, with further implications for industrial energy demand and the broader commodity complex.

Natural Gas Technical Analysis: NG Holds Key Support but Downtrend Still Dominates
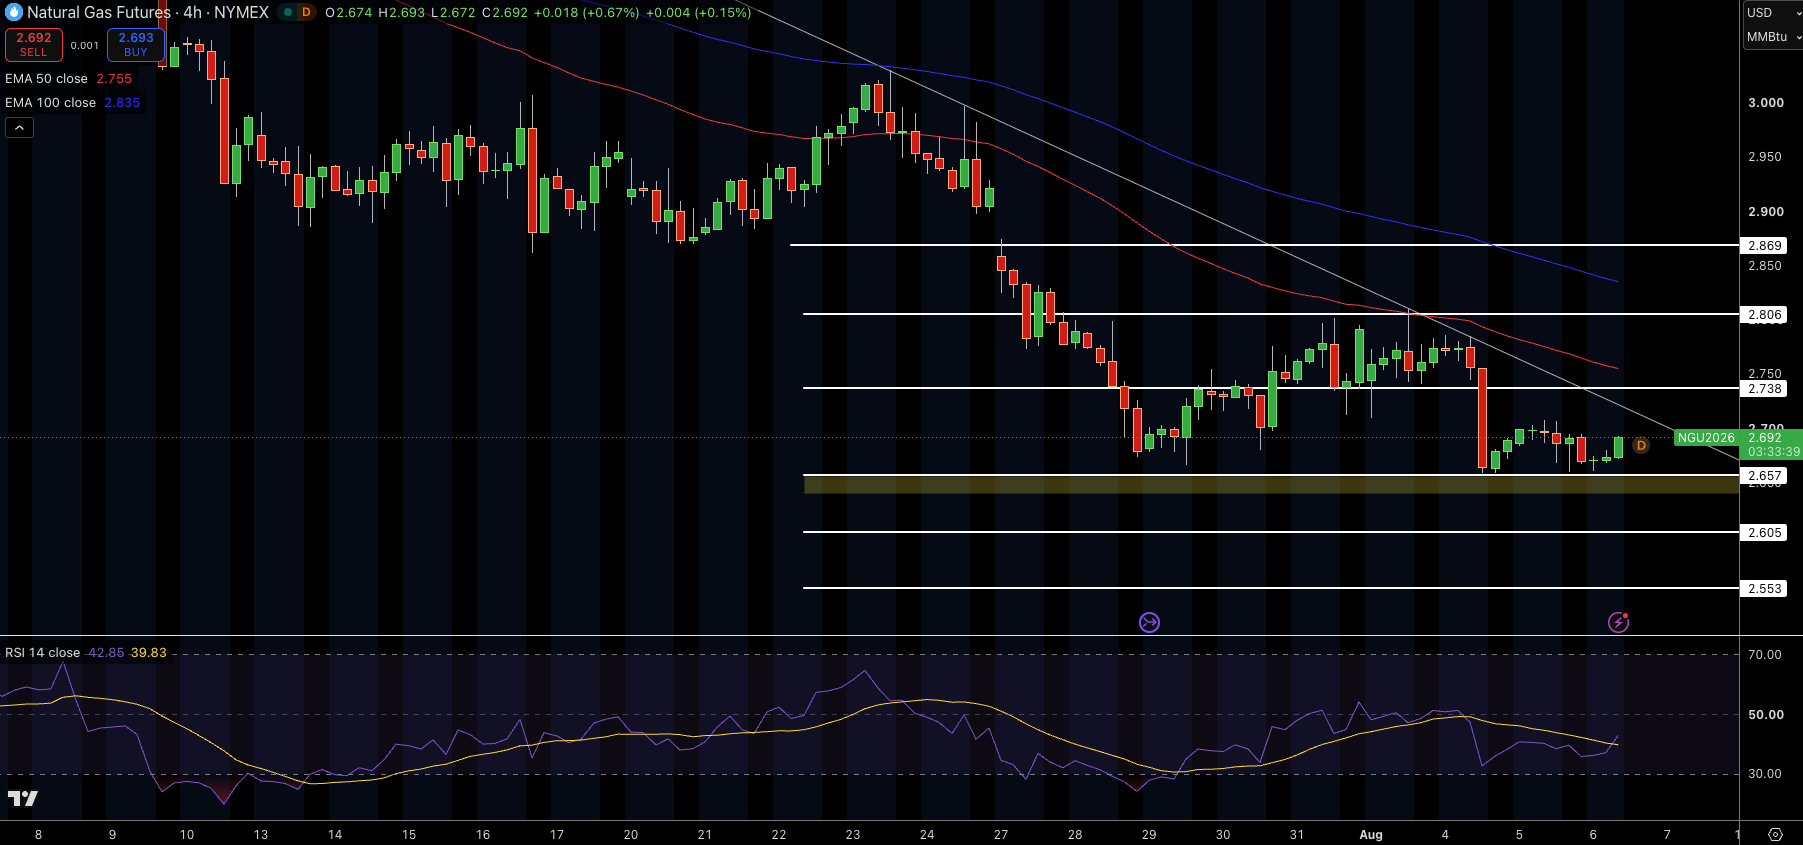
Natural gas futures settle around $2.69, finding support above the critical zone around $2.64-$2.66, after a number of unsuccessful attempts to break below this level. A down trend still dominates despite Pricest holding just above the rising trendline around $2.64. The 50-EMA and the 100-EMA are descending and resting at $2.76 and $2.84 respectively. A rejected pricing signal from the $2.74-$2.80 range, which is now the first zone of major resistance, indicates strong selling pressure.
There is also RSI at around 43, which indicates weak momentum, as well as trend indicators aligned in a bearish bias. Natural gas futures holding just above the rising trendline at $2.64. A break above $2.74 would be the first sign that price will reverse its downtrend and that the bulls are back in control. Until the descending trendline at $2.76 and the 100-EMA at $2.84 are broken, the technical outlook will remain bearish.
WTI Crude Oil Technical Analysis: Bears Defend $77.80 Resistance as WTI Holds Near Multi-Week Lows
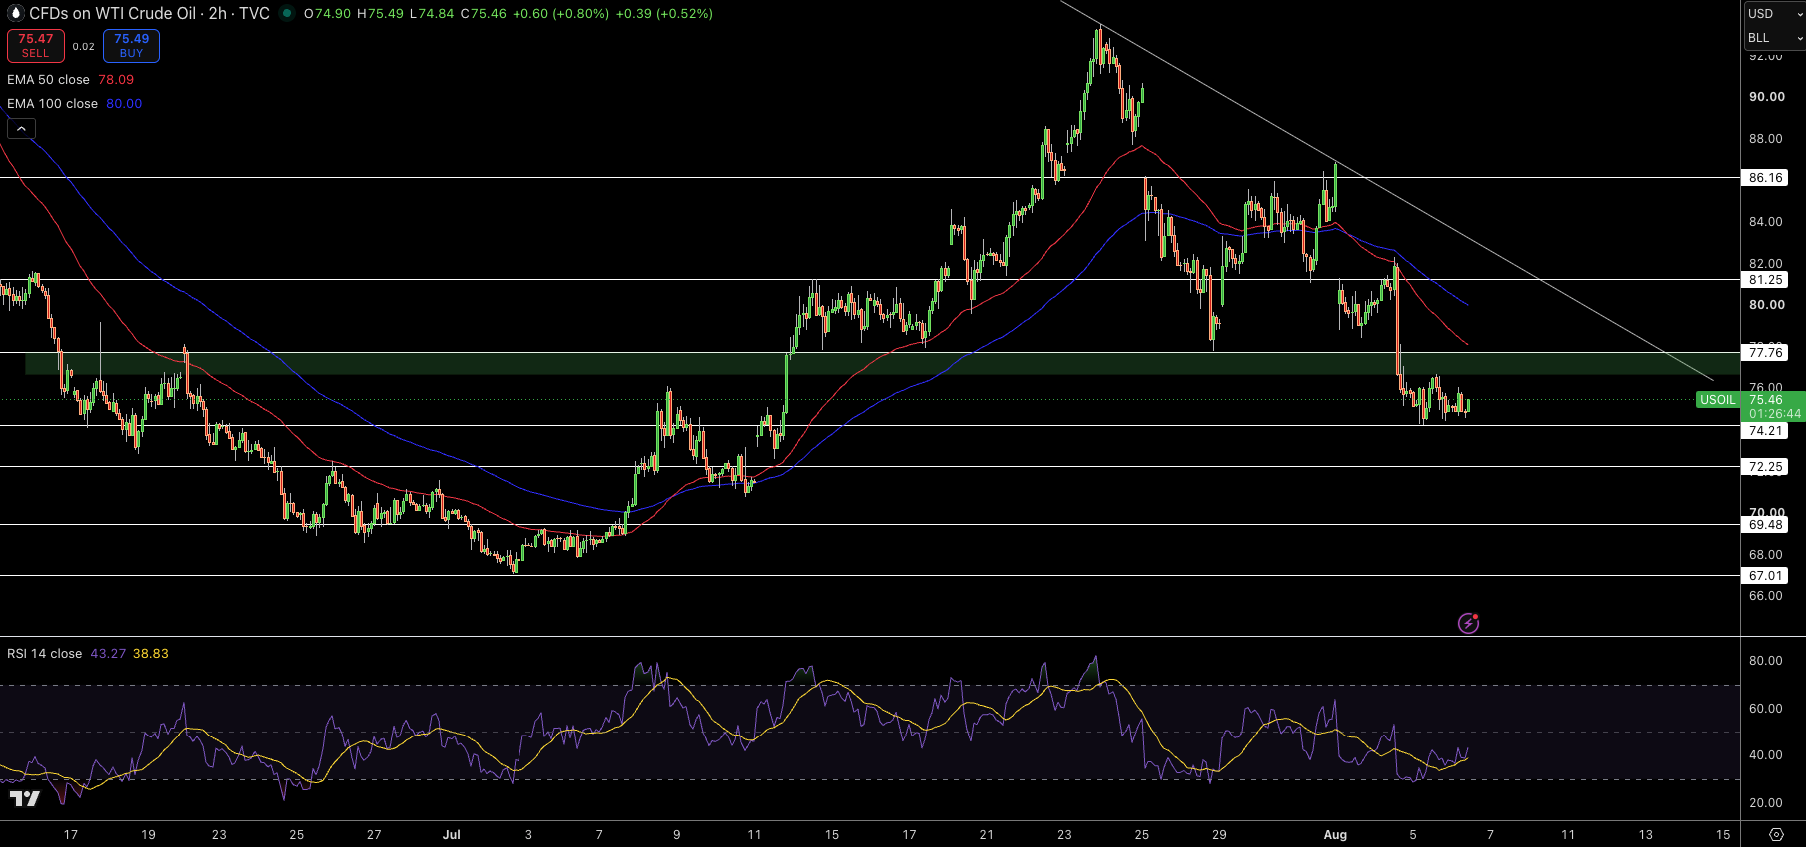
WTI crude oil consolidates around $75.46 after a sharp breakdown below the key $77.80-$76.80 support zone, which has now turned into immediate resistance. Price is still well below both the 50-EMA ($78.09) and 100-EMA ($80.00), confirming that the broader short-term trend is still bearish.
While the latest candle shows stabilization above $74.20, buying pressure remains weak with RSI recovering to only 43, still suggesting sellers are still in control of the market. A strong move above $77.80 is needed to confirm a stronger recovery toward $81.25, while failing to reclaim this area could initiate further selling toward $74.20, followed by $72.25.The overall structure continues to favor selling into rallies unless the buy side reclaim the lost support areas.
Natural Gas Price Forecast
Every new Natural Gas analysis as it publishes, today's technical signal and key levels, live price — on one page.
See all Natural Gas forecastsBrent Crude Oil Technical Analysis: Brent Stabilizes Above Trendline but Momentum Remains Bearish
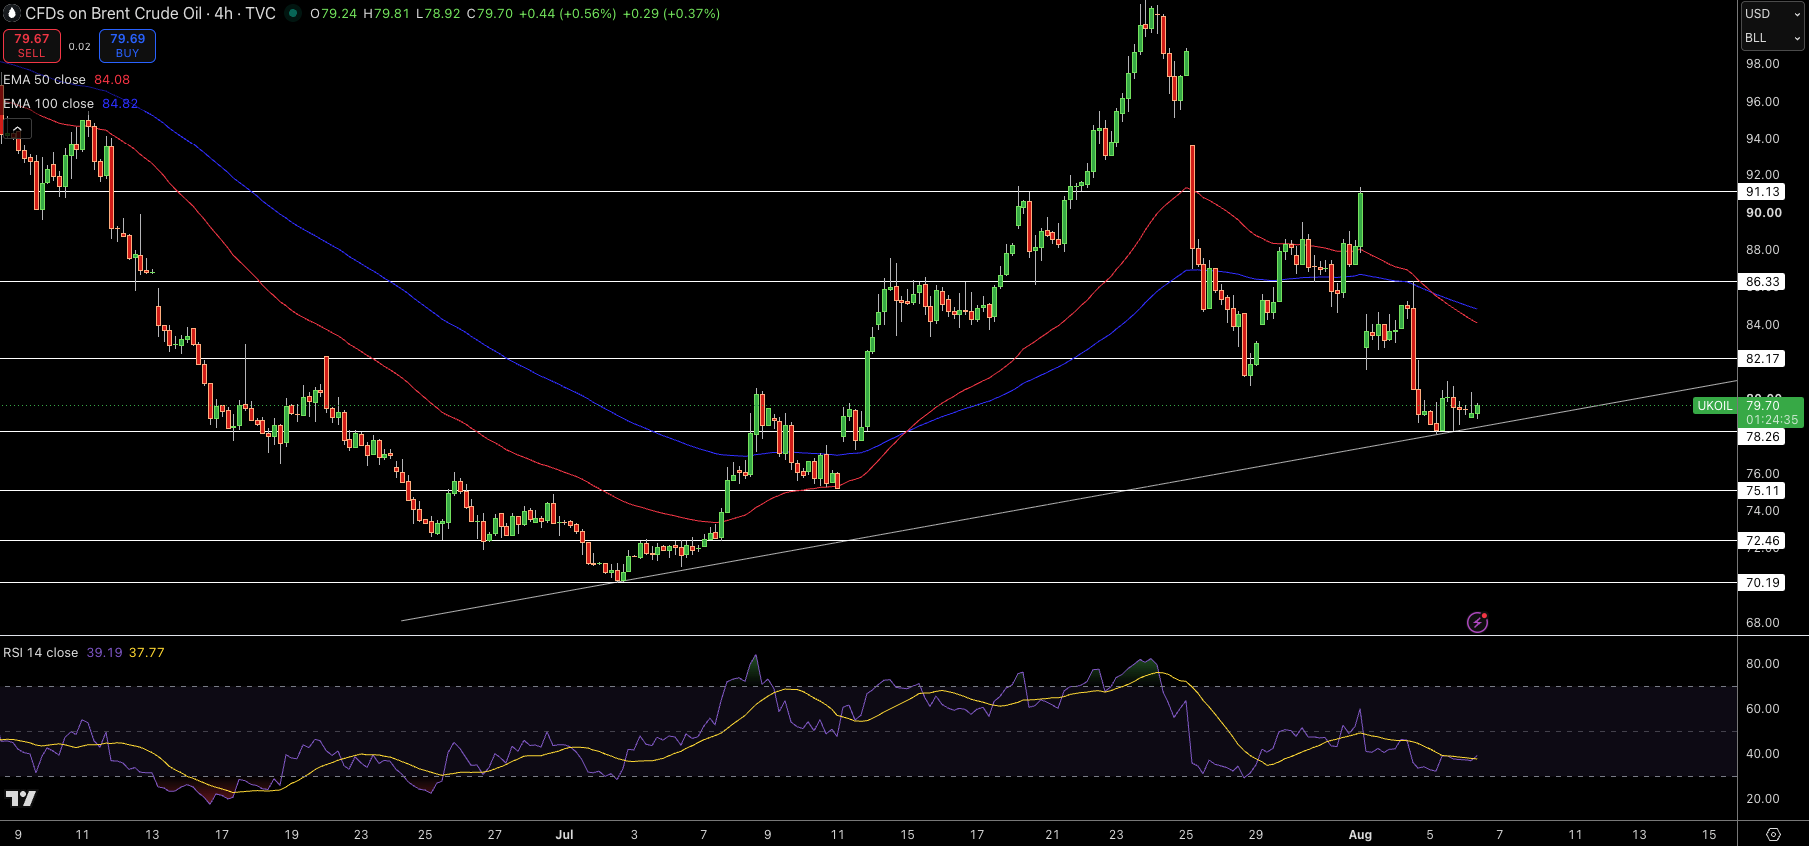
Brent Crude Oil is currently trading at $79.70. It is attempting to stabilize after a sell off. Price is sitting just above a rising trendline at $78.30, where buyers have appeared. however, it is sitting below the 50-EMA (at $84.08) and 100-EMA (at $84.82). The repeated rejection from $82.20 has firmly shifted the momentum in favor of sellers, with $82.20 – $83.00 as the first major resistance zone.
Rising momentum and weak price action has left RSI subdued near 39, indicating that momentum is easing, although it has yet to clearly invert. A break below $78.30 could also expose $76.00 and then $75.10, with a break above $82.20 being the first sign that buyers are regaining control, Until then, Brent will continue to trade within a larger corrective phase.