Advertisement
Advertisement

Natural Gas and Oil Forecast: WTI Nears $83.50; Bearish Correction Ahead?

By: 
Arslan Ali
Natural Gas and Oil Forecast: WTI Nears $83.50; Bearish Correction Ahead?

Key Points:

  • Oil prices steady near two-month highs, driven by expected summer fuel demand and rate cuts.
  • Hurricane Beryl threatens Mexico's oil production, adding to geopolitical fears and market volatility.
  • U.S. gasoline demand to rise during Independence Day travel, but weak Asian demand tempers gains.

Market Overview

Oil prices remained steady near two-month highs on Tuesday, influenced by expectations of increased fuel demand during the summer and potential U.S. interest rate cuts to stimulate economic growth.

Vandana Hari of Vanda Insights noted that oil price movements are more driven by sentiment and geopolitical fears, particularly due to the possible escalation of tensions between Israel and Iran, and the impact of Hurricane Beryl. The hurricane poses a threat to oil production in Mexico’s Bay of Campeche after hitting the Caribbean as a severe storm.

Meanwhile, in the U.S., gasoline demand is set to increase as travel is expected to rise significantly during the Independence Day holiday. However, softening demand in Asia and reduced imports by China are tempering oil price gains.

Natural Gas Price Forecast
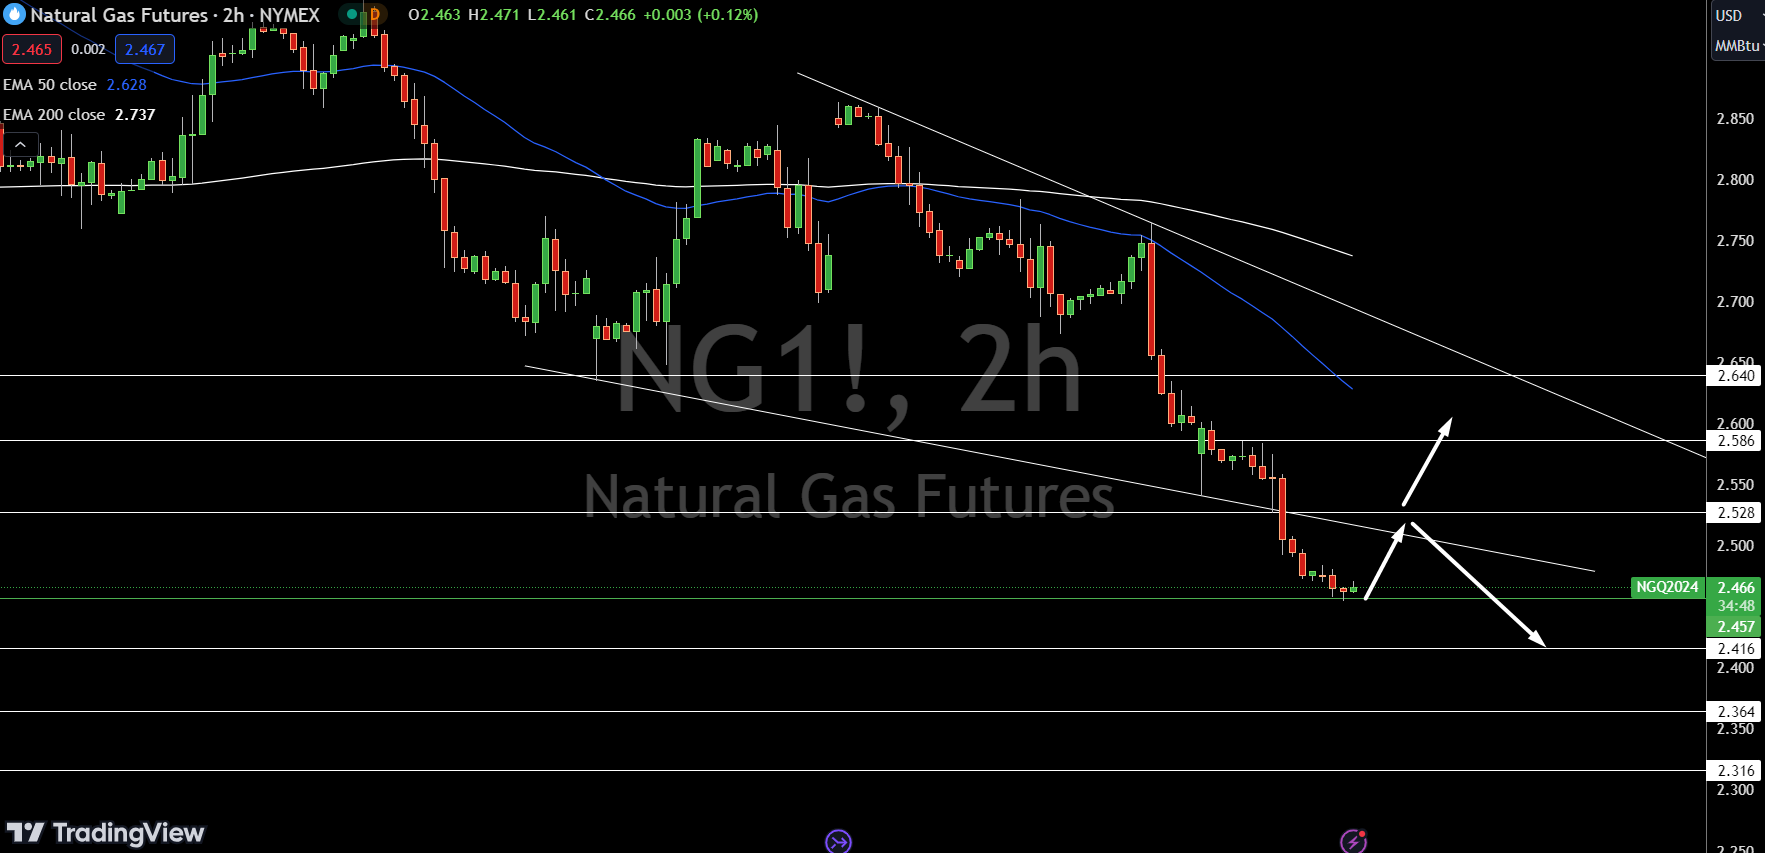
Natural Gas (NG) Price Chart
WTI Price Chart
WTI Price Chart

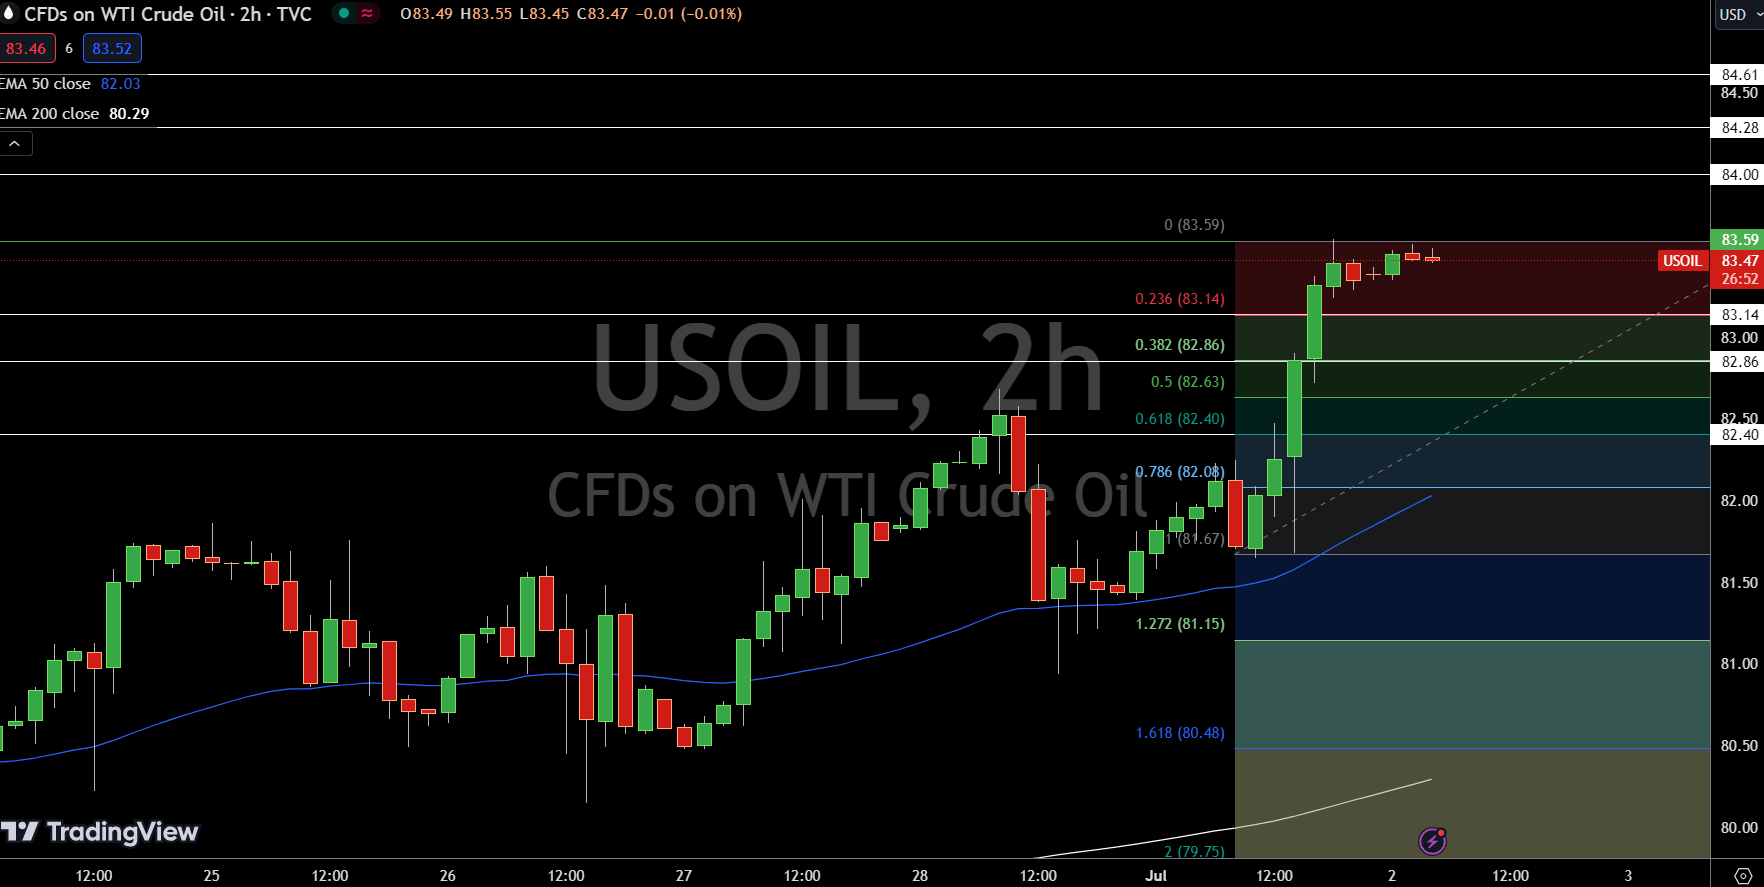
Today, USOIL is priced at $83.47, reflecting a modest increase of 0.14%. Analyzing the 4-hour chart, the pivot point is located at $83.59. Resistance levels are observed at $84.00, followed by $84.28, and then $84.61.

On the downside, immediate support can be found at $83.14, with additional support levels at $82.86 and $82.40.

Technical indicators signal caution. The 50-day Exponential Moving Average (EMA) is positioned at $82.03, suggesting support below current prices, while the 200-day EMA, at $80.29, indicates a longer-term bullish trend. In conclusion, the market stance on USOIL is bearish, below $83.59.

Brent Oil Price Forecast
Brent Price Chart
Brent Price Chart

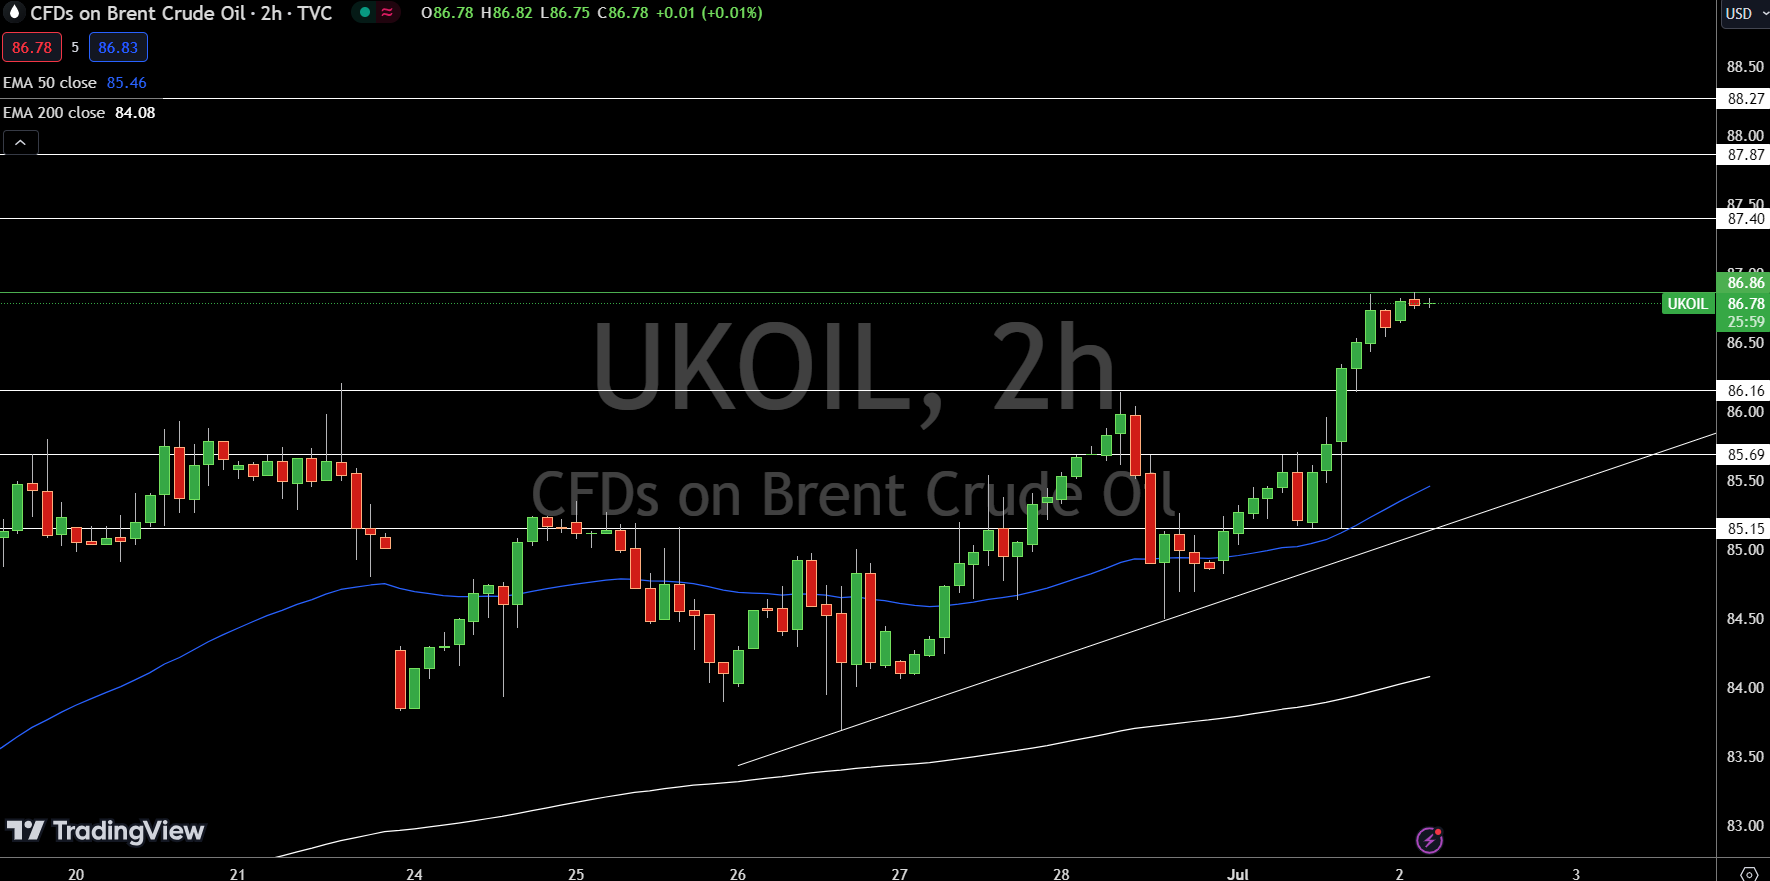
UKOIL is currently priced at $86.78, showing a modest increase of 0.18%. On the 2-hour chart, the pivotal point is marked at $86.86. The immediate resistance level is at $87.40, followed by subsequent resistance at $87.87 and $88.27. Support is found at $86.16, with further support at $85.69 and $85.15.

Technical indicators provide a mixed outlook. The 50-day Exponential Moving Average (EMA) stands at $85.46, supporting bullish sentiments, while the 200-day EMA at $84.08 underscores a sustained upward trend. In conclusion, UKOIL displays a bearish trend below $86.86.

About the Author

Arslan AliTechnical Analysis Expert

Arslan is a finance MBA and also holds an MPhil degree in behavioral finance. An expert in financial analysis and investor psychology, Arslan uses his academic background to bring valuable insights about market sentiment and whether instruments are likely to be overbought or oversold.

Advertisement