Triangle Breakout Faces First Test
Natural gas signaled an initial bullish reversal above $2.89, which marked resistance for the current bottom consolidation range. Consolidation took the form of a small symmetrical triangle that developed over almost five weeks. A 22-day high of $2.93 was reached during the session, successfully testing resistance near the 50-day moving average, currently near $2.93 and falling. Before the breakout is confirmed, natural gas needs to post a daily close above $2.89. If that happens, the 50-day moving average could either continue to define dynamic resistance or be reclaimed, opening the way toward higher potential targets.

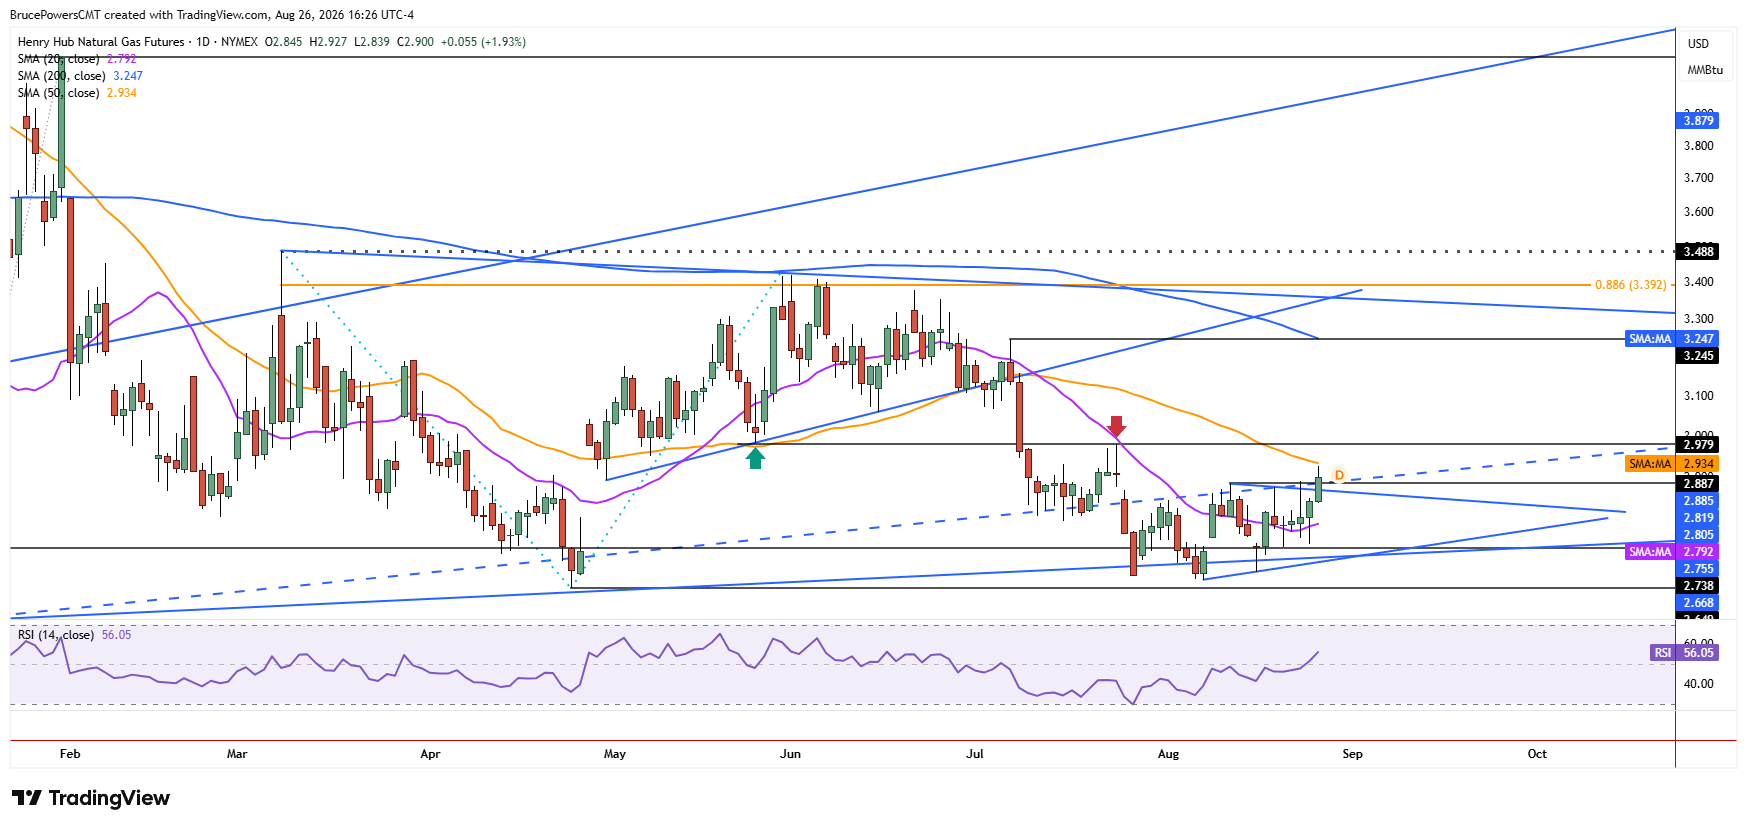
$2.98 Comes Into Focus
An initial upside target above the 50-day moving average is the recent lower swing high of $2.98, which was also a higher swing low during the prior advance. The 200-day moving average near $3.25 and the lower swing high of $3.25 from early July then mark the next higher price zone based on the structure of the trend. That high preceded the breakdown from the prior uptrend, which occurred the next day with a sharp decline below multiple indicators that had been showing support. In addition, the 200-day moving average was recognized as resistance during the prior advance that peaked at $3.42, ultimately resulting in a new lower swing high.
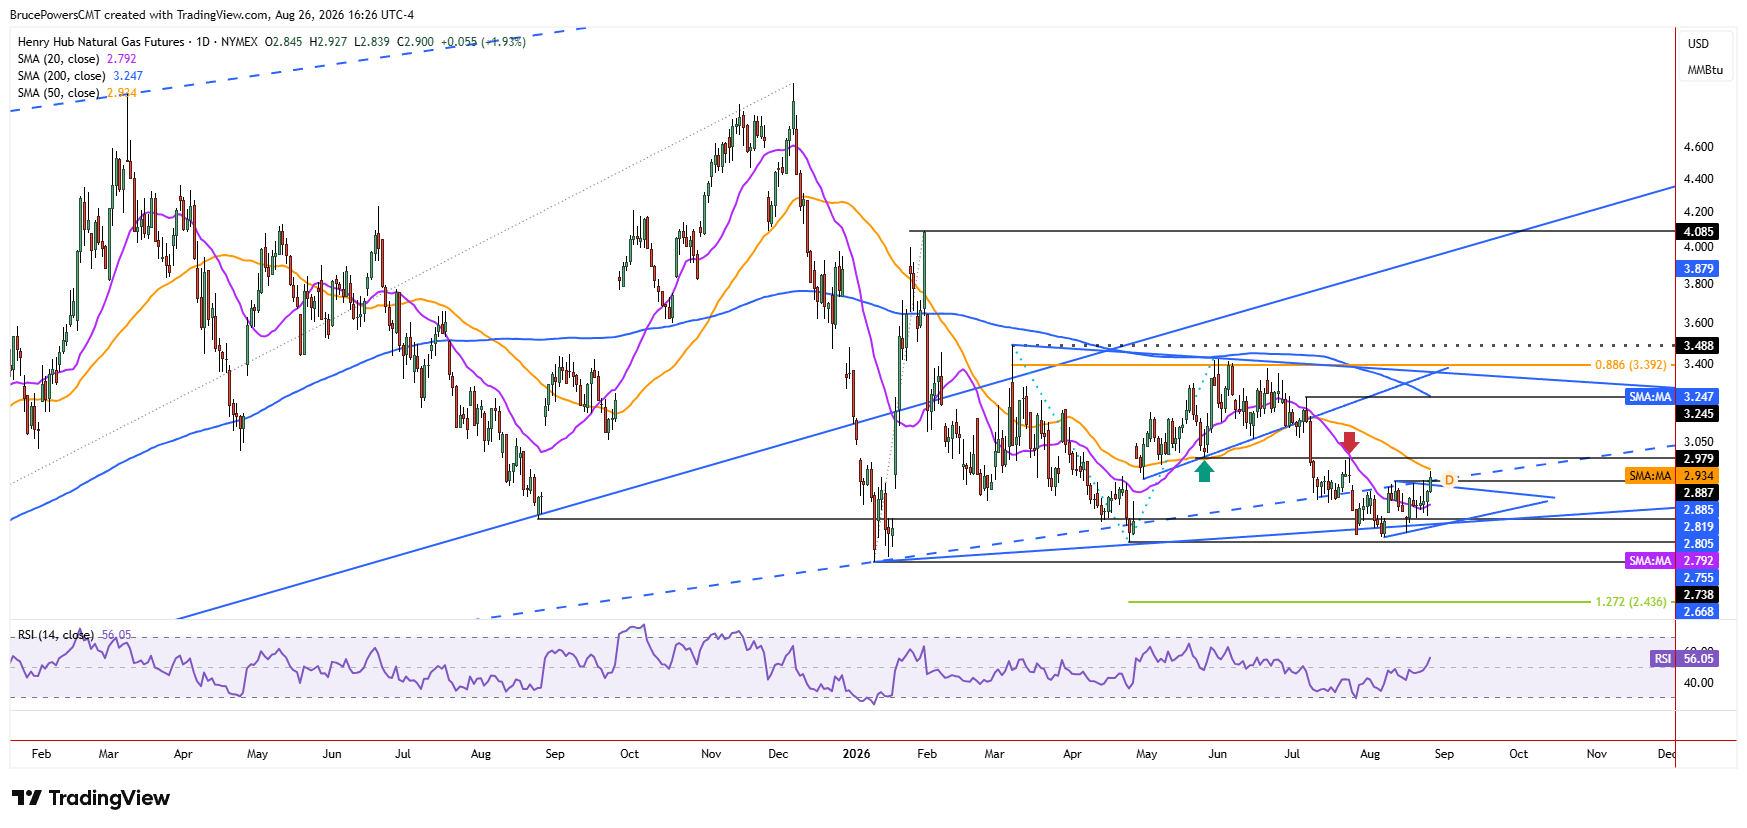
Support Zone Takes Shape
Given the new bullish reversal signal it looks like natural gas is confirming a support zone near recent lows, beginning with the August low of $2.67 and extending lower to the January low of $2.58. If Wednesday’s bullish signal is followed by further signs of strength, the top of a larger range that has covered much of 2026 beginning in March, may eventually be tested as resistance. The 200-day average also represents dynamic resistance near the top of the range, especially since it was confirmed as resistance with the high during the previous advance. A sustained move above that average would therefore represent a more meaningful shift in the developing trend.
$2.84 Sets Short-Term Risk
Near-term support is Wednesday’s higher daily low of $2.84, as a drop below it would show weakness and could send natural gas back into the symmetrical triangle formation. For now, the $2.89 breakout level and $2.84 low provide the clearest short-term levels to watch. Despite the
potential for higher prices, resistance near the 50-day moving average remains a potential roadblock. How price responds around that average should help determine whether Wednesday’s reversal develops into a sustained advance or remains another failed attempt to break higher.
Natural Gas Price Forecast
Every new Natural Gas analysis as it publishes, today's technical signal and key levels, live price — on one page.
See all Natural Gas forecastsIf you’d like to know more about how to trade natural gas, please visit our educational area.