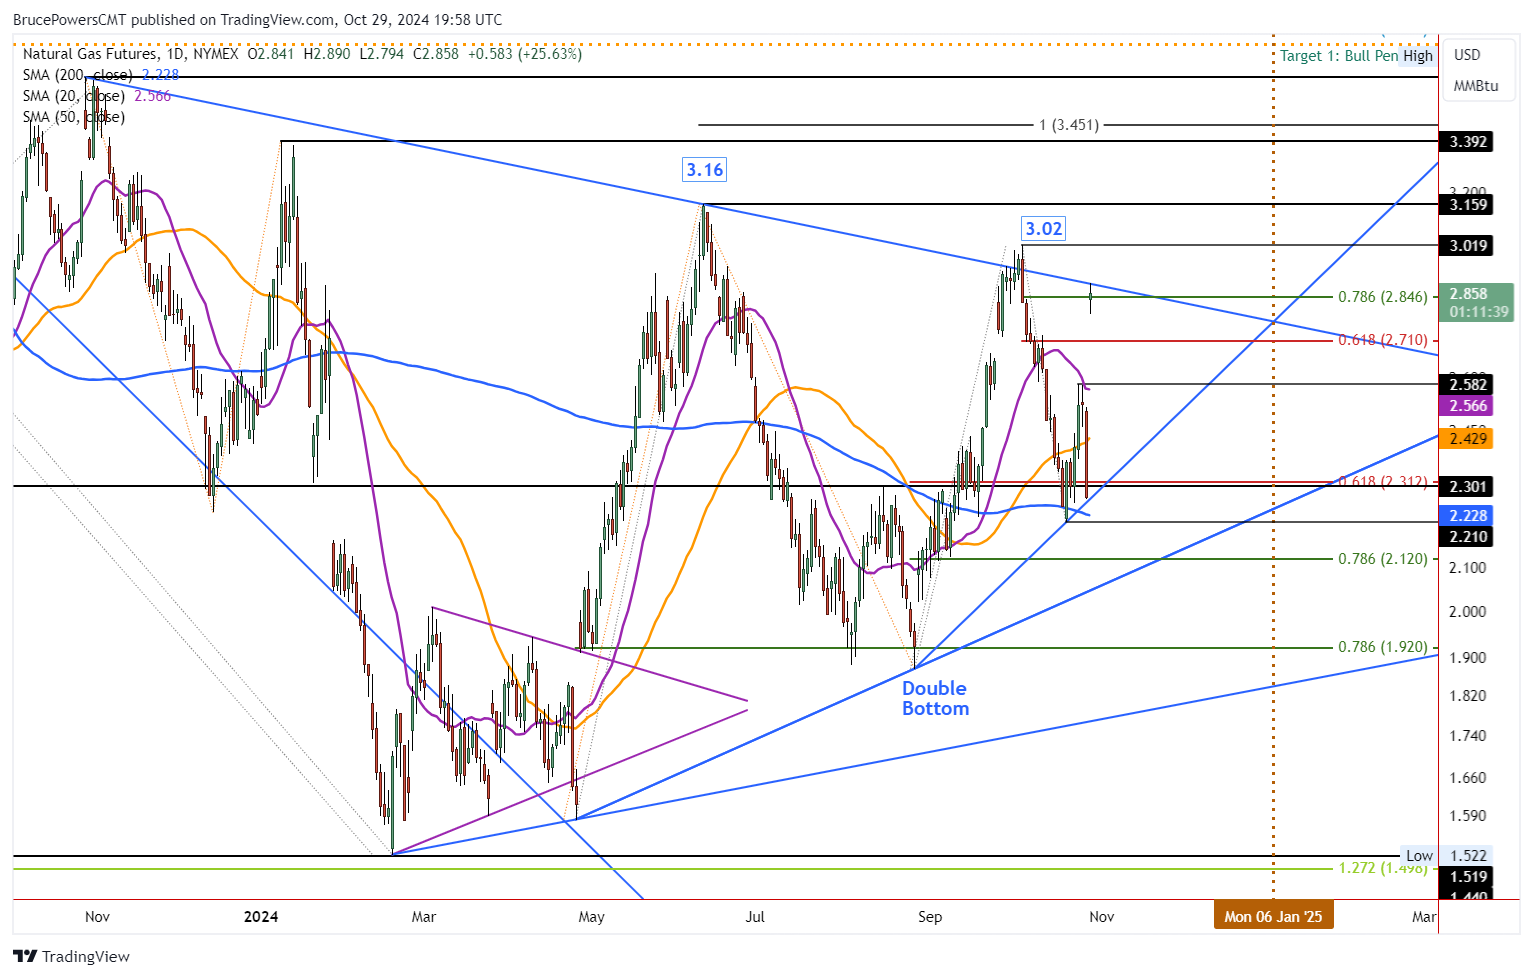
Natural gas saw buyers on Tuesday as it reversed higher from Monday’s sharp selloff. Support around the 200-Day MA at 2.23 was sustained, leading to a bullish reversal. The high for the day was 2.89. That was at potential resistance from the downtrend line that marks the upper boundary of a large symmetrical triangle pattern. Given the markets’ recognition of the line, it wouldn’t be surprising to see a pullback before natural gas attempts to go higher.

20-Day MA at 2.57 Marks Support
Both the 20-Day and 50-Day MAs were reclaimed and now represent potential support. The 20-Day line is at 2.57 and the 50-Day line at 2.43. Support could be seen around either moving average if a bearish pullback occurs. Further, a minor swing high is near the 20-Day level at 2.58. Finding support around the 20-Day MA would be a stronger indication than if natural gas falls to test support around the 50-Day MA.
Bull Breakout Above 2.89
Although a bearish pullback may occur prior to an upside breakout, the breakout could happen sooner. Strength is next indicated by a rally above today’s high of 2.89, which would provide the first indication of a potential upside breakout of the triangle. However, since the recent high of 3.02 is near, it needs to be exceeded for a higher confidence level that a breakout may be sustained. Today is essentially the fifth attempt to challenge resistance around the top trendline. Therefore, it has a chance of being successful if it triggers. Until then natural gas remains inside a consolidation range.
Indications of Underlying Strength
The recent higher swing low shows strength and is a clue that supports an eventual bullish resolution of the consolidation phase. Moreover, the 200-Day MA was recently successfully tested as support and each time price rallied. Natural gas has been flirting with the 200-Day line since a bull breakout in September 2023.
At some point natural gas will move into a trending environment and the recent test of support at the 200-Day line may turn out to be the beginning of that process. Note that the recent test of support at the 200-Day line followed a rally higher. Each of the previous three approaches to the 200-Day line led to a breakdown below the line. A change of character may now be beginning.
Natural Gas Price Forecast
Every new Natural Gas analysis as it publishes, today's technical signal and key levels, live price — on one page.
See all Natural Gas forecastsFor a look at all of today’s economic events, check out our economic calendar.