November Gas Is Trying to Turn a Weather Bounce Into a Trade
November Nymex Natural Gas is clinging to a small gain Tuesday, and Monday’s weather bounce is the only reason it’s there. Shorts covered when the northern and western United States turned cooler. The supply picture never budged.
On the daily chart, Monday confirmed Friday’s closing price reversal bottom and put the contract back on the strong side of its 50-day moving average. Short-term momentum turned up with it, though the main trend is still pointing lower.
At 12:43 GMT, November natural gas futures are trading at $3.079, up $0.013 or +0.42%.

The Weather Is Better, Not Bullish
Monday’s lift came straight out of Commodity Weather Group, which turned cooler across the northern and western United States for October 12 through October 15. The same update put warmth back in the Midwest, and buyers couldn’t hold the move once that showed up.
Nobody should mistake that for a bullish forecast. NatGasWeather has the next 15 days leaning bearish, 60s to 80s for most of the country and 90s still hanging on in California and the Southwest. A few 50s across the northern tier won’t swing a national number.
I’m watching the gap between the GFS and the European model. The GFS has more heating degree days in it, and that difference is about the only thing buyers are trading right now. Production, storage and mild shoulder-season demand are all on the other side.
Light Builds Aren’t Enough to Dent the Surplus
Natural Gas Price Forecast
Every new Natural Gas analysis as it publishes, today's technical signal and key levels, live price — on one page.
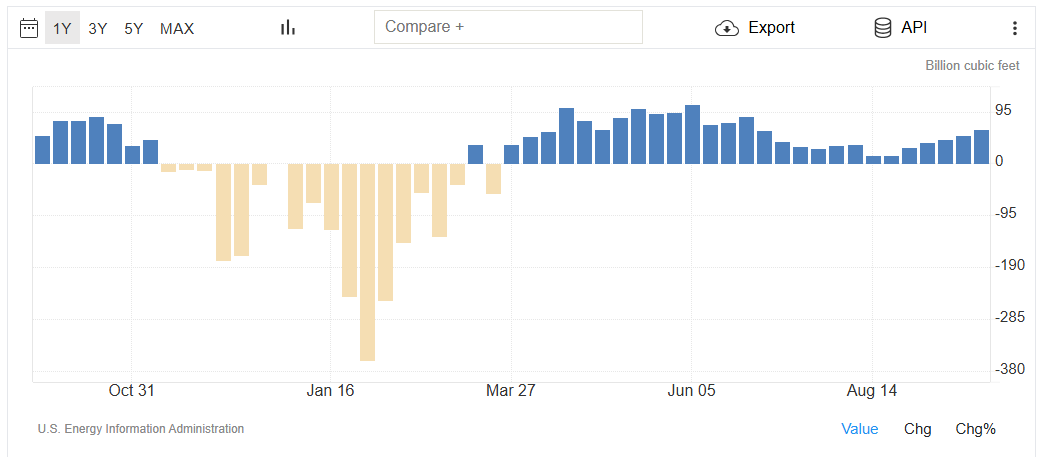
See all Natural Gas forecastsThursday’s EIA storage report probably isn’t the one that changes this. The estimate is a 79 Bcf injection for the week ended October 2, a little more than last year’s 77 Bcf and a long way under the roughly 96 Bcf five-year average.
Last week was the same story. A 64 Bcf build came in under the 80 Bcf five-year average and working gas still sits at 3,415 Bcf, 79 Bcf over the five-year average and 138 Bcf short of a year ago. The EIA has the end of October around 3,969 to 3,985 Bcf.
Going into winter with this cushion, a smaller-than-normal build isn’t bullish. It just makes sellers a little more careful about leaning on the short side when the models start adding heating demand.
Output Is Still Running Over the Bulls
Lower-48 dry gas output was 111.9 Bcf per day Monday, 3.3% above a year ago, and the EIA just made it worse for the bulls. The agency lifted its 2027 dry-gas production estimate to 116.0 Bcf per day from 115.3 and expects storage to end the injection season at a 10-year high.
Demand’s actually decent. State demand ran 69.9 Bcf per day, up 8.5% year over year, while estimated LNG flows slipped 0.6% from the prior week to 18.8 Bcf per day. It’s just not enough against that kind of supply.
Baker Hughes had gas rigs down two at 133 Friday, a week after a three-year high of 135. Two rigs don’t make a supply story. And the winter chatter is still about a Super El Niño, pointing to a warm Northern Hemisphere and weaker heating demand.
AL92 Is Not a Natural Gas Supply Story
AL92 is organizing faster than expected and has an 80% chance of becoming a tropical depression over the next 48 hours and seven days. It still doesn’t touch supply. Forecast guidance sends it east-northeast and then north toward the central or eastern Gulf, away from the deepwater production hubs off Texas and western Louisiana, and Sabine Pass, Cameron and Corpus Christi all sit west of the projected path.
Producers haven’t issued any shut-in alerts or platform evacuation notices. Offshore Gulf is only about 2% of U.S. dry-gas output anyway, with the Permian, Haynesville and Marcellus supplying this market.
Where it could matter is demand. Rain and cloud cover across the Florida Panhandle, the Florida Peninsula and the Southeast could knock down regional cooling demand this week.
Daily November Natural Gas Futures Technical Analysis
November natural gas futures are nearly flat shortly before the regular session opening on Tuesday after posting a choppy, two-sided trade during the pre-market session.
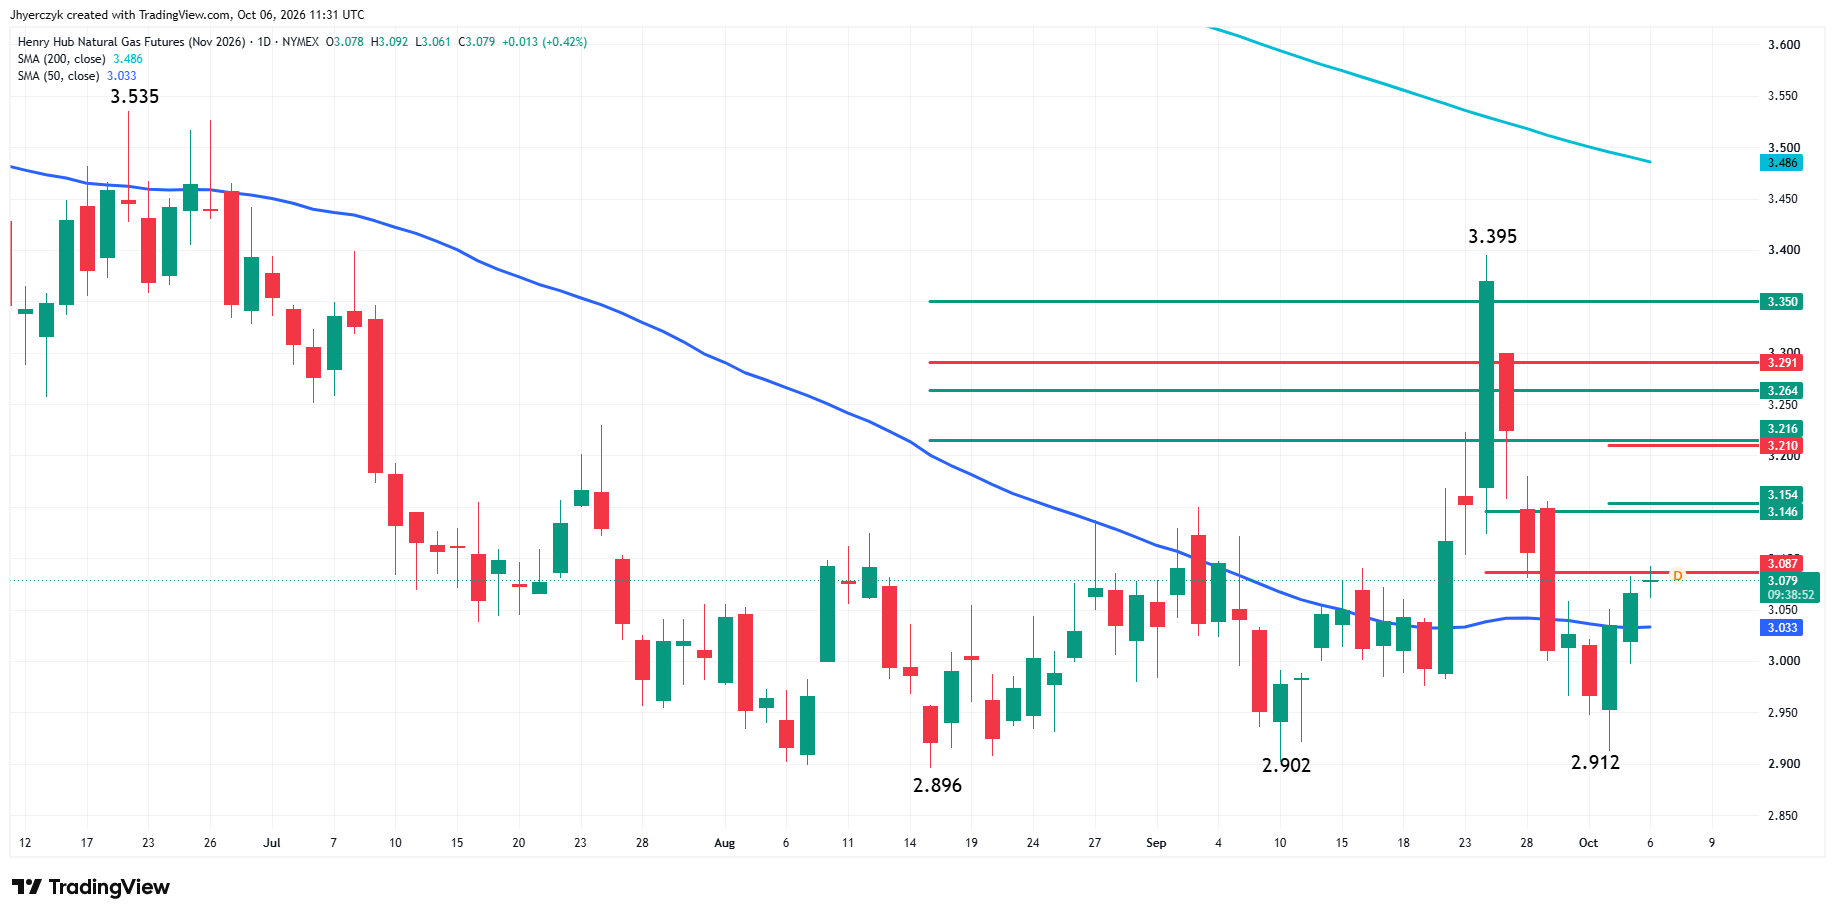
The main trend is down according to the daily swing chart, but Friday’s closing price reversal bottom and Monday’s subsequent confirmation have shifted momentum to the upside. The closing price reversal bottom is not a change in trend, but it could lead to a two- to three-day counter-trend rally. The main trend will change to up on a trade through $3.395. A failure to hold $2.912 will negate the closing price reversal bottom and signal a resumption of the downtrend.
The first resistance zone target is $3.087 to $3.146. The closing price reversal bottom target zone is 50% to 61.8% of the break from $3.395 to $2.912. This area is $3.154 to $3.210. With the main trend down, sellers could reemerge on a test of the resistance clusters at $3.146 to $3.154 and $3.210 to $3.216.
Near-term support is the 50-day moving average at $3.033. The move to the strong side of this indicator is also helping to generate some of the current upside momentum.
Major support under the 50-day moving average is $2.912, $2.902 and $2.896.
What to Watch
Thursday’s EIA storage report hits a market that’s still carrying a surplus, and the weather is all the buyers have. One warmer Midwest run cut Monday’s move short, and the GFS is carrying the cold by itself.
November gas held the 50-day moving average Tuesday morning and was sitting just under $3.087, with $2.912 the low underneath. My bias is to the short side, but the combination of the confirmed closing price reversal bottom and the crossing to the bullish side of the 50-day moving average indicates the potential for short-covering into at least $3.146 to $3.154 over the near term.
More Information in our Economic Calendar.