Near Protocol (NEAR) has dropped by over 45% from its June highs of around $3 and may decline further as traders attempt to reach a dense liquidation cluster sitting just 5% under the current price.

NEAR’s $1.62 Liquidity Cluster Raises Downside Risk
As of Thursday, Aug. 6, NEAR was trading near $1.72. A decline of roughly 5%–6% toward $1.62 could trigger approximately $4.58 million in cumulative long liquidations on Binance, according to monthly liquidation heatmap data provided by CoinGlass.
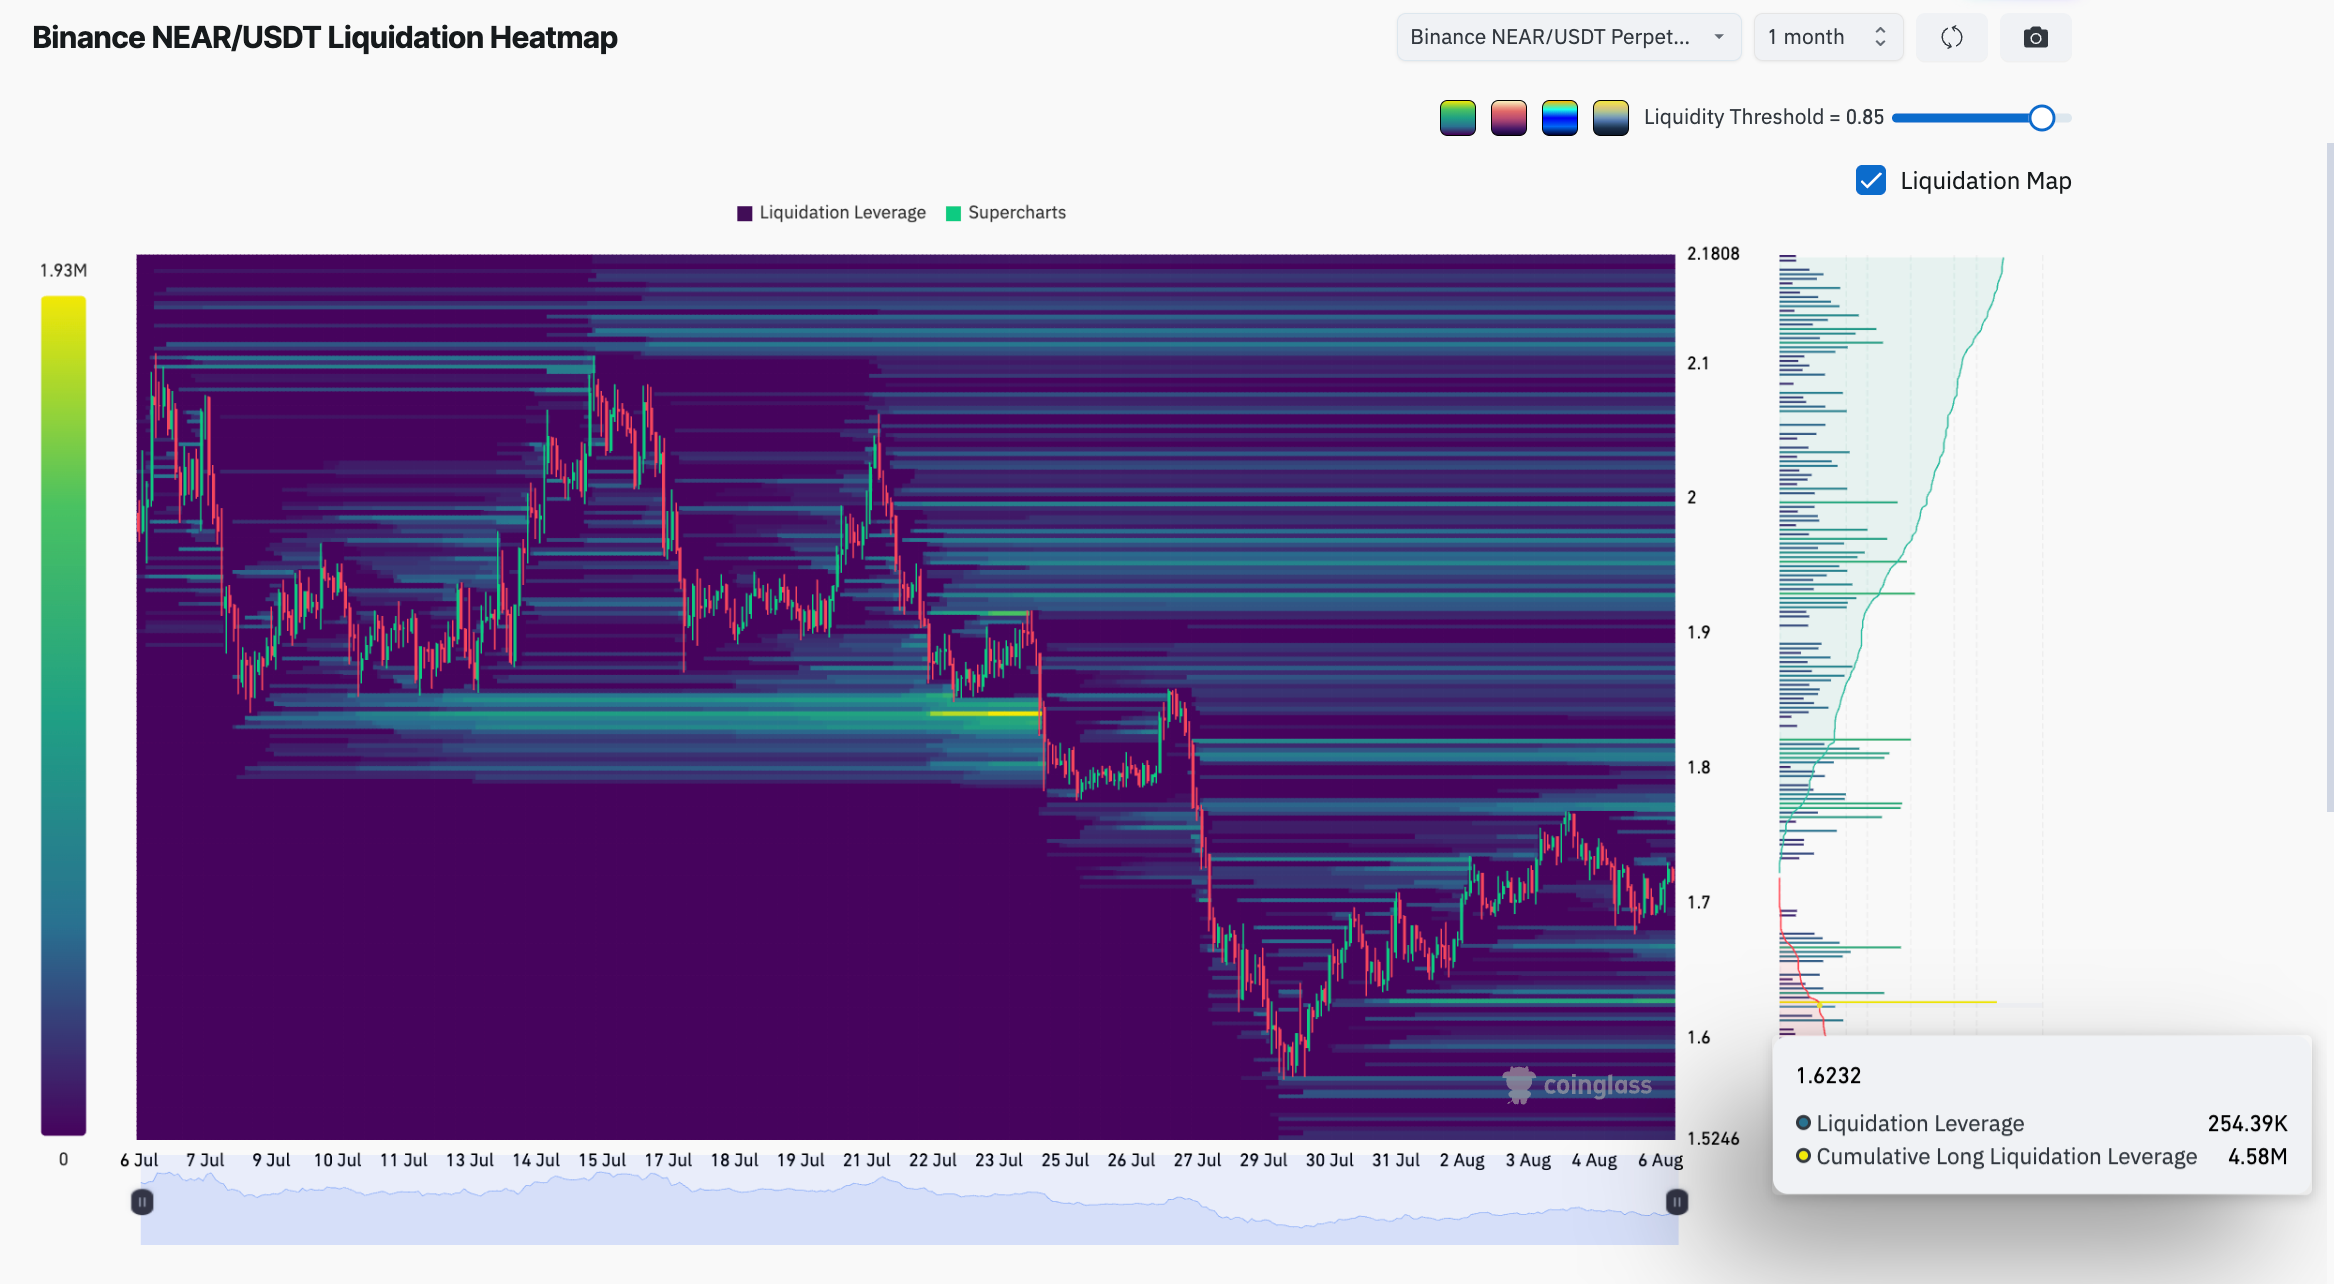
The heatmap shows a prominent concentration of leveraged long positions around $1.6232. Such clusters can act as short-term price magnets because a move into the region may force exchanges to close leveraged bullish positions automatically.
Forced liquidations can then create additional market sell orders, potentially accelerating the decline toward the psychological $1.60 support level.
NEAR’s funding rate was also slightly negative at around -0.0073%, indicating that perpetual futures traders were leaning bearish. However, positioning remains uneven.
Falling Wedge Offers Bulls a Potential Escape Route
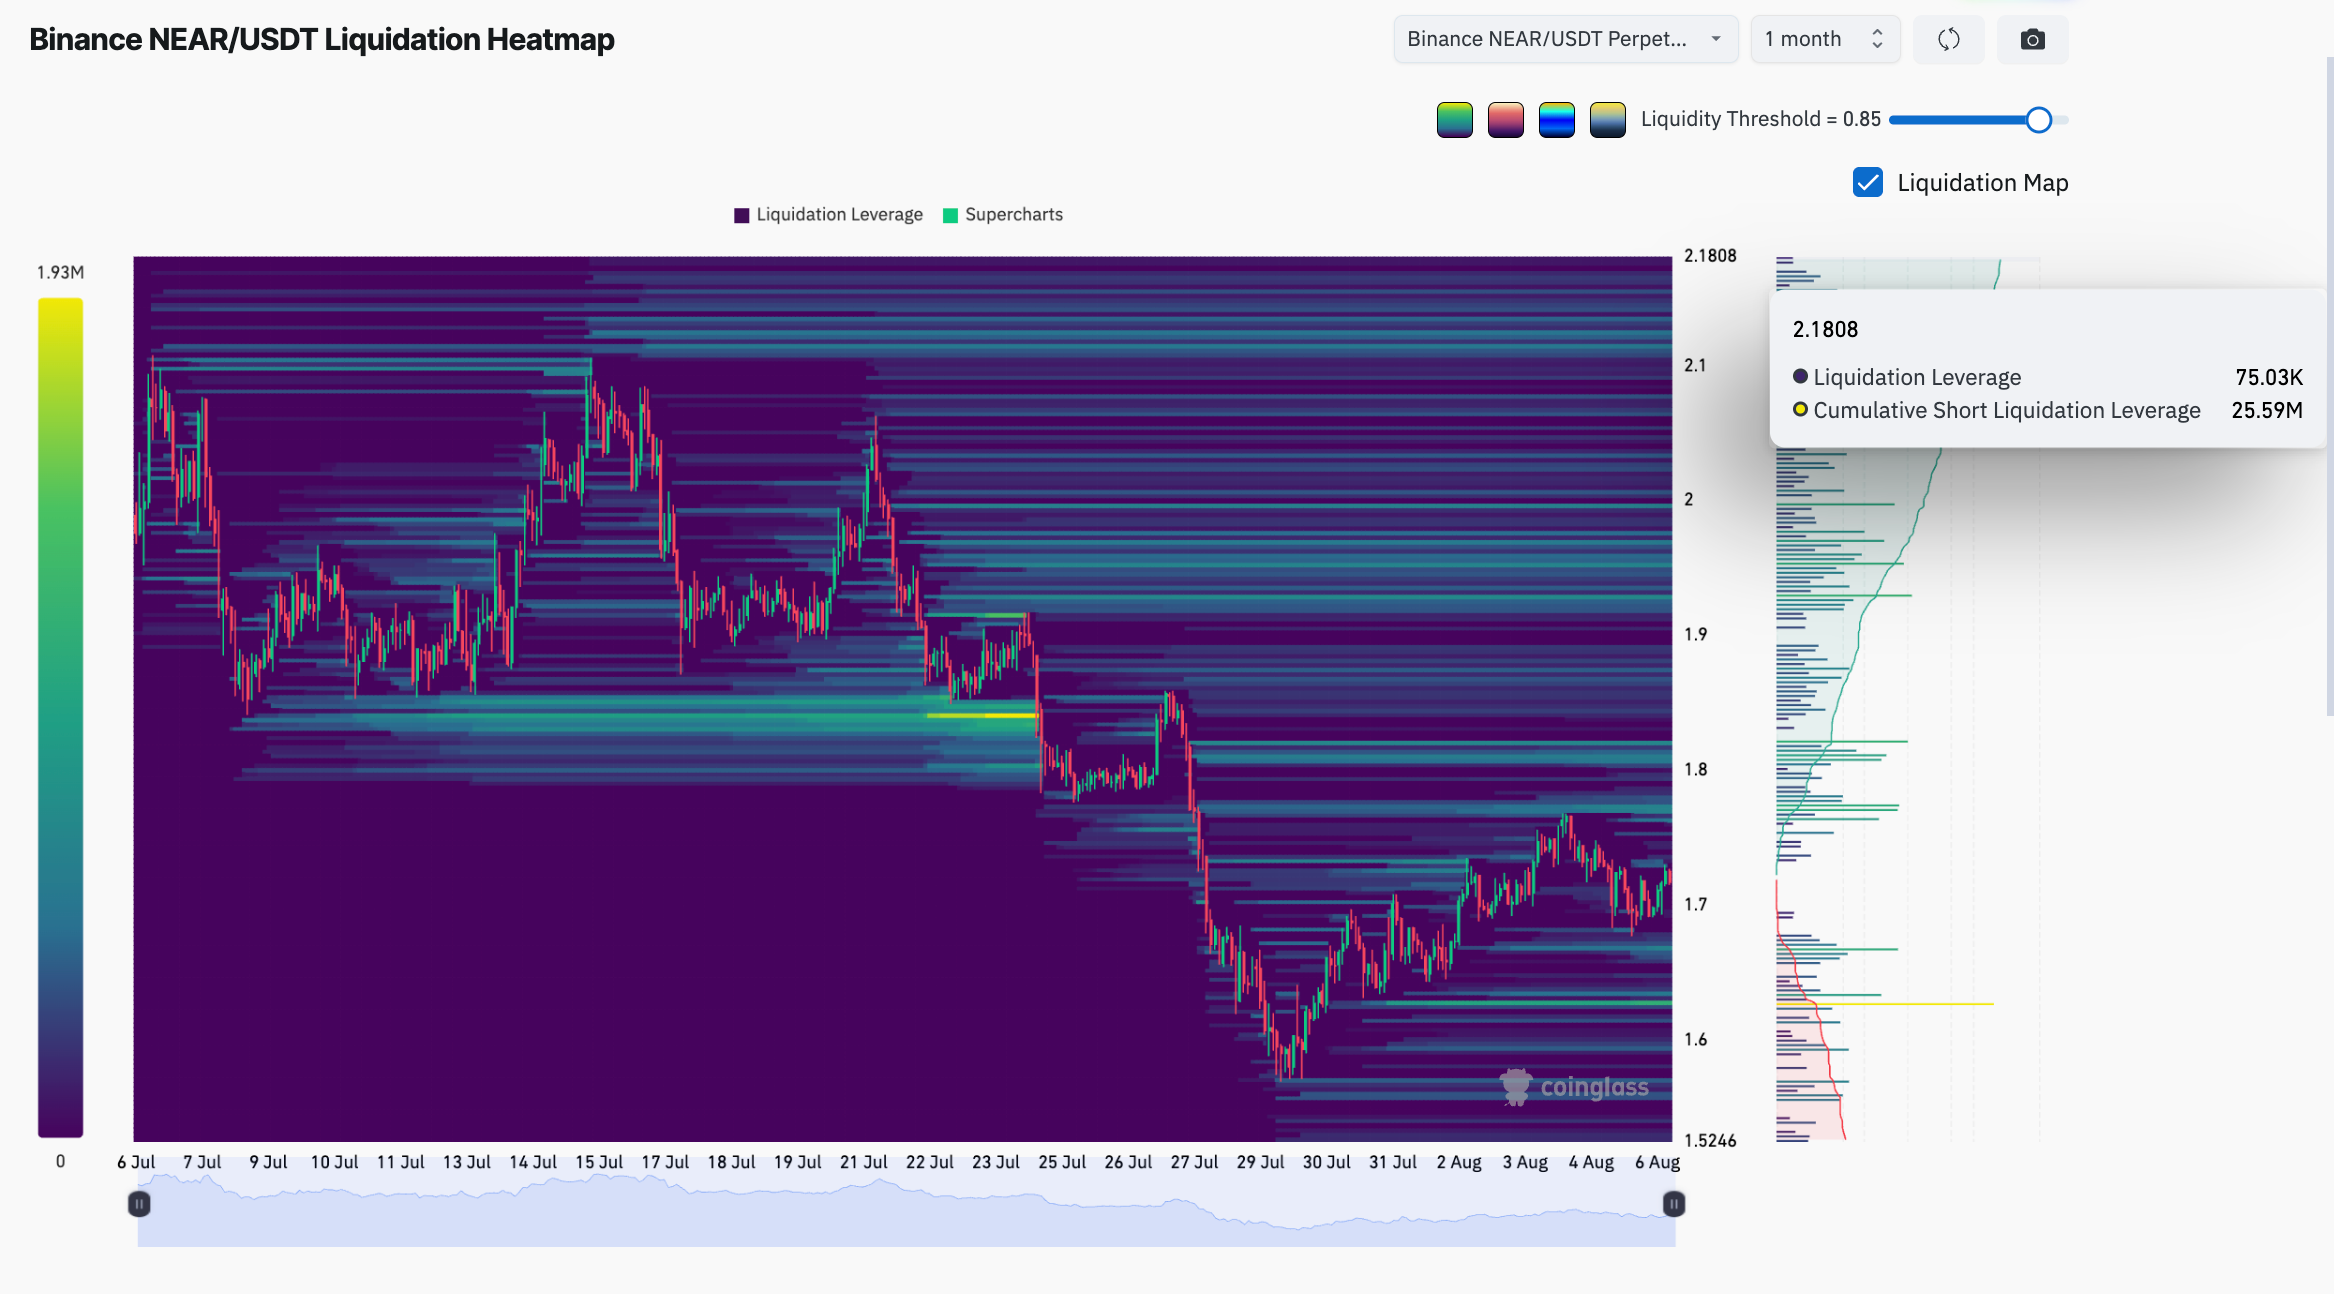
The heatmap shows approximately $25.59 million in cumulative short liquidations, compared with $7.91 million in cumulative long liquidations. The more than threefold imbalance means NEAR could still squeeze higher before pursuing the liquidity below.
NEAR is simultaneously trading near the upper trendline of a falling wedge on its daily chart. The pattern has developed through a sequence of converging lower highs and lower lows since the token peaked near $2.80 in June.
Falling wedges are generally considered bullish reversal patterns, but they require a decisive breakout above descending resistance for confirmation.
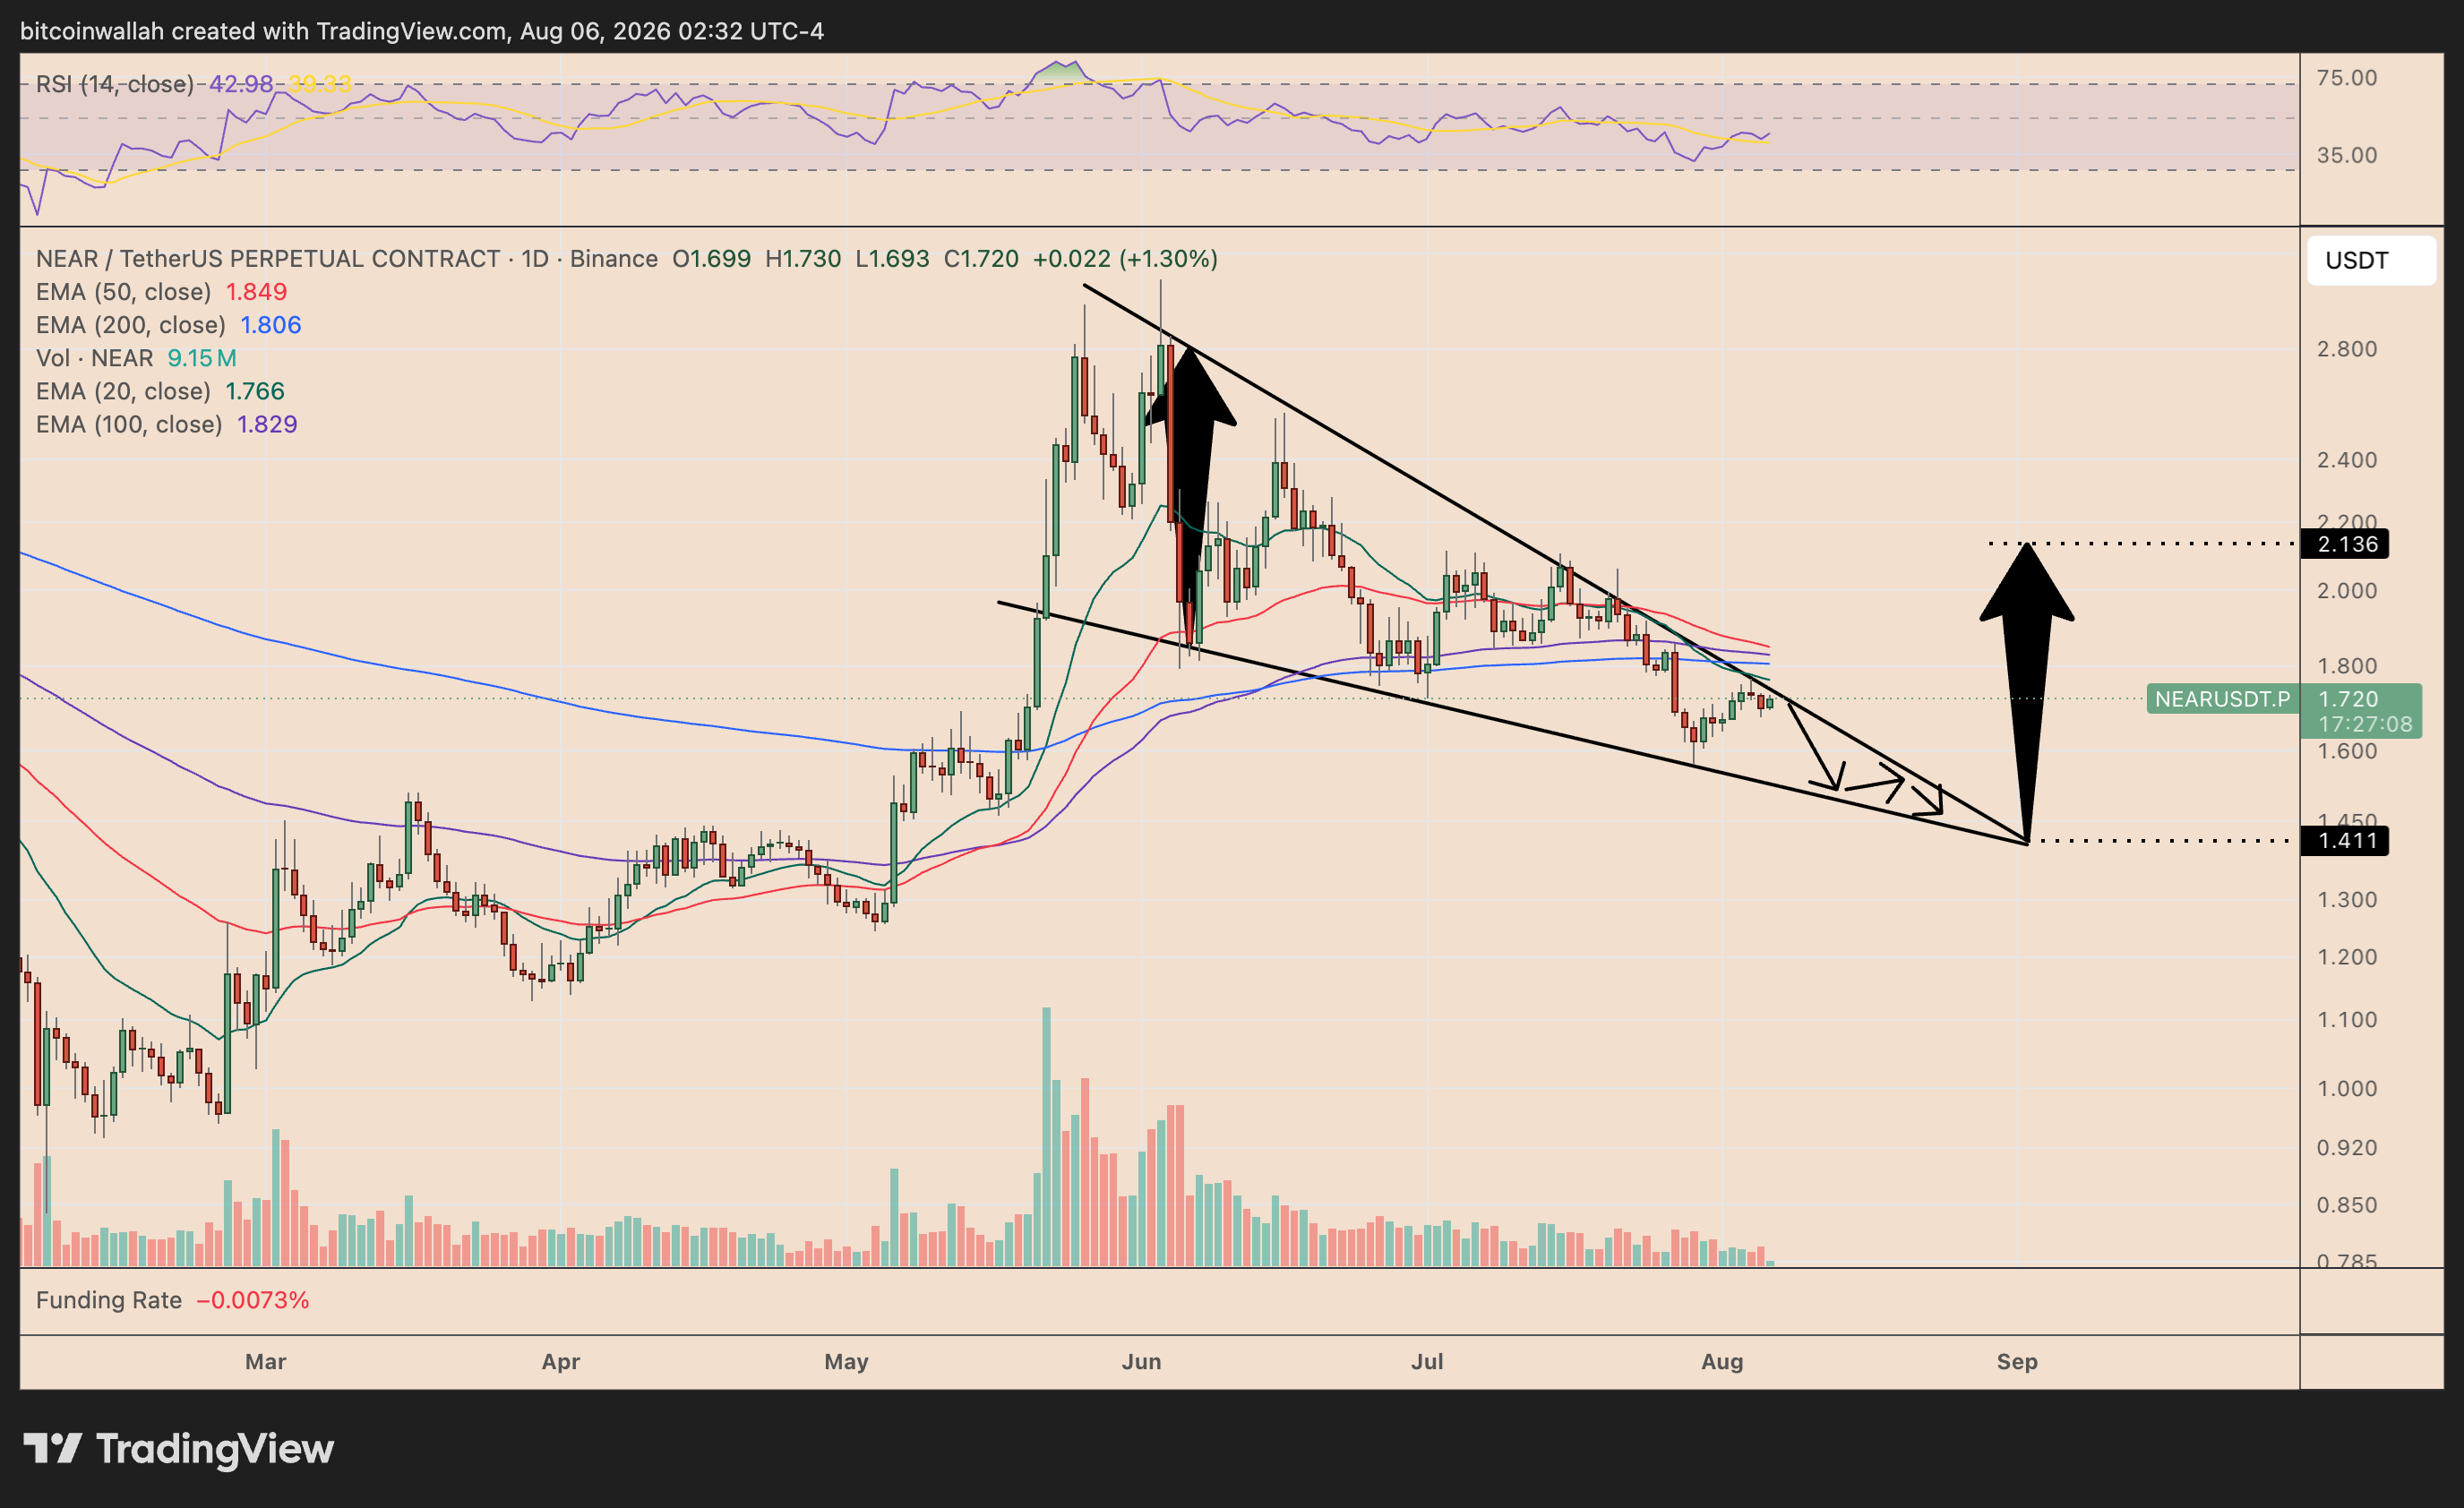
NEAR must reclaim the wedge’s upper boundary and its 20-day exponential moving average near $1.77. It would then face additional resistance from the 200-day, 100-day, and 50-day EMAs clustered between roughly $1.81 and $1.85.
Failure to overcome this resistance zone would leave NEAR vulnerable to a pullback toward $1.62, potentially wiping out the highlighted $4.58 million in leveraged long exposure.
Conversely, a confirmed wedge breakout could trigger short liquidations and open the path toward $2.00–$2.14.