Oil prices remained steady near recent highs as traders assessed risks for additional Middle East turmoil. The shipping through the Strait of Hormuz continued to be slow as many shipowners did not pass through it. The mixed signals from the United States and Iran also added to the confusion. Oil prices carry a risk premium as sporadic attacks and tensions continue to escalate between Iran, the UAE and Oman. But the lack of any major escalation has limited any fresh buying.
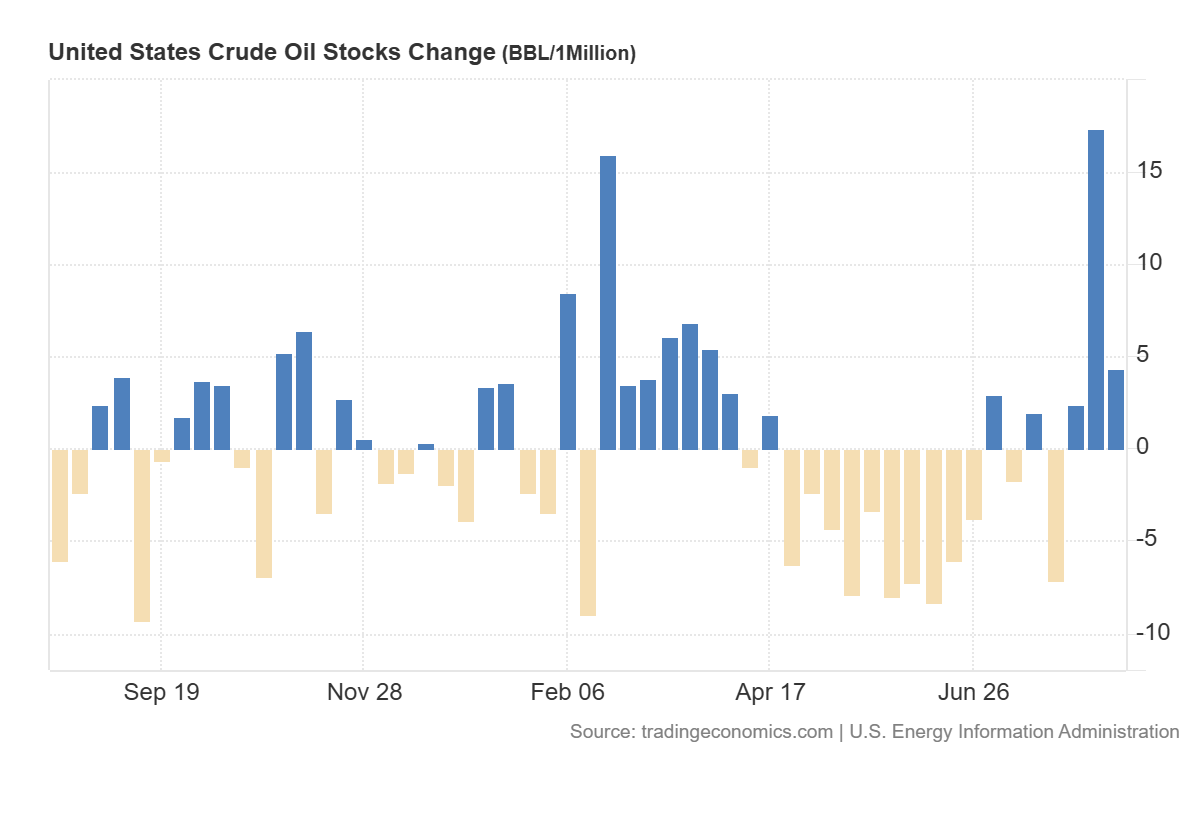
Growth in U.S. inventories could also limit additional gains. Crude inventories rose by 4.4 million barrels as seen in the chart below. The inventories of gasoline also increased. These data indicate that U.S. supply is still fairly comfortable and that demand may not be strong enough to propel a significant rally. As long as war and shipping risks persist, oil prices may gradually move higher. But a strong move in the oil market would likely require a major disruption to supply in the Strait of Hormuz.

WTI Crude Oil Price Forecast: $87-$89 Breakout Could Target $105
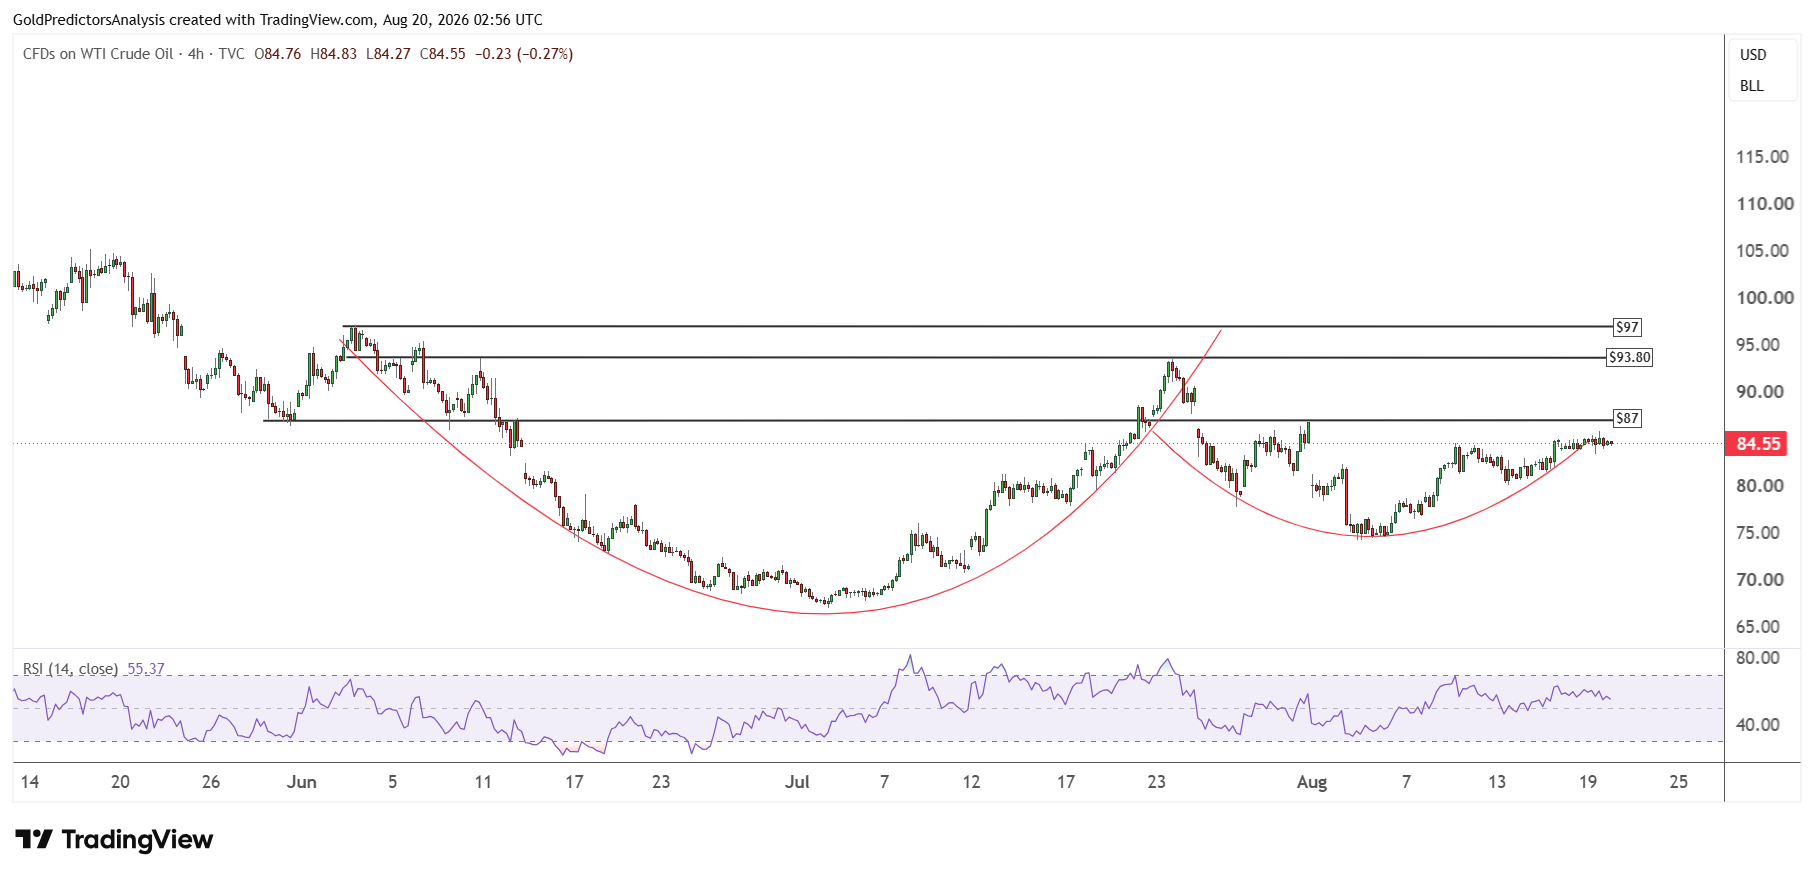
WTI crude oil is forming constructive price action above the $70 region as seen in the 4-hour chart below. The price has been forming a rounding bottom pattern above $70. A break above $87 will push the price towards $93.80 and the $97 area.
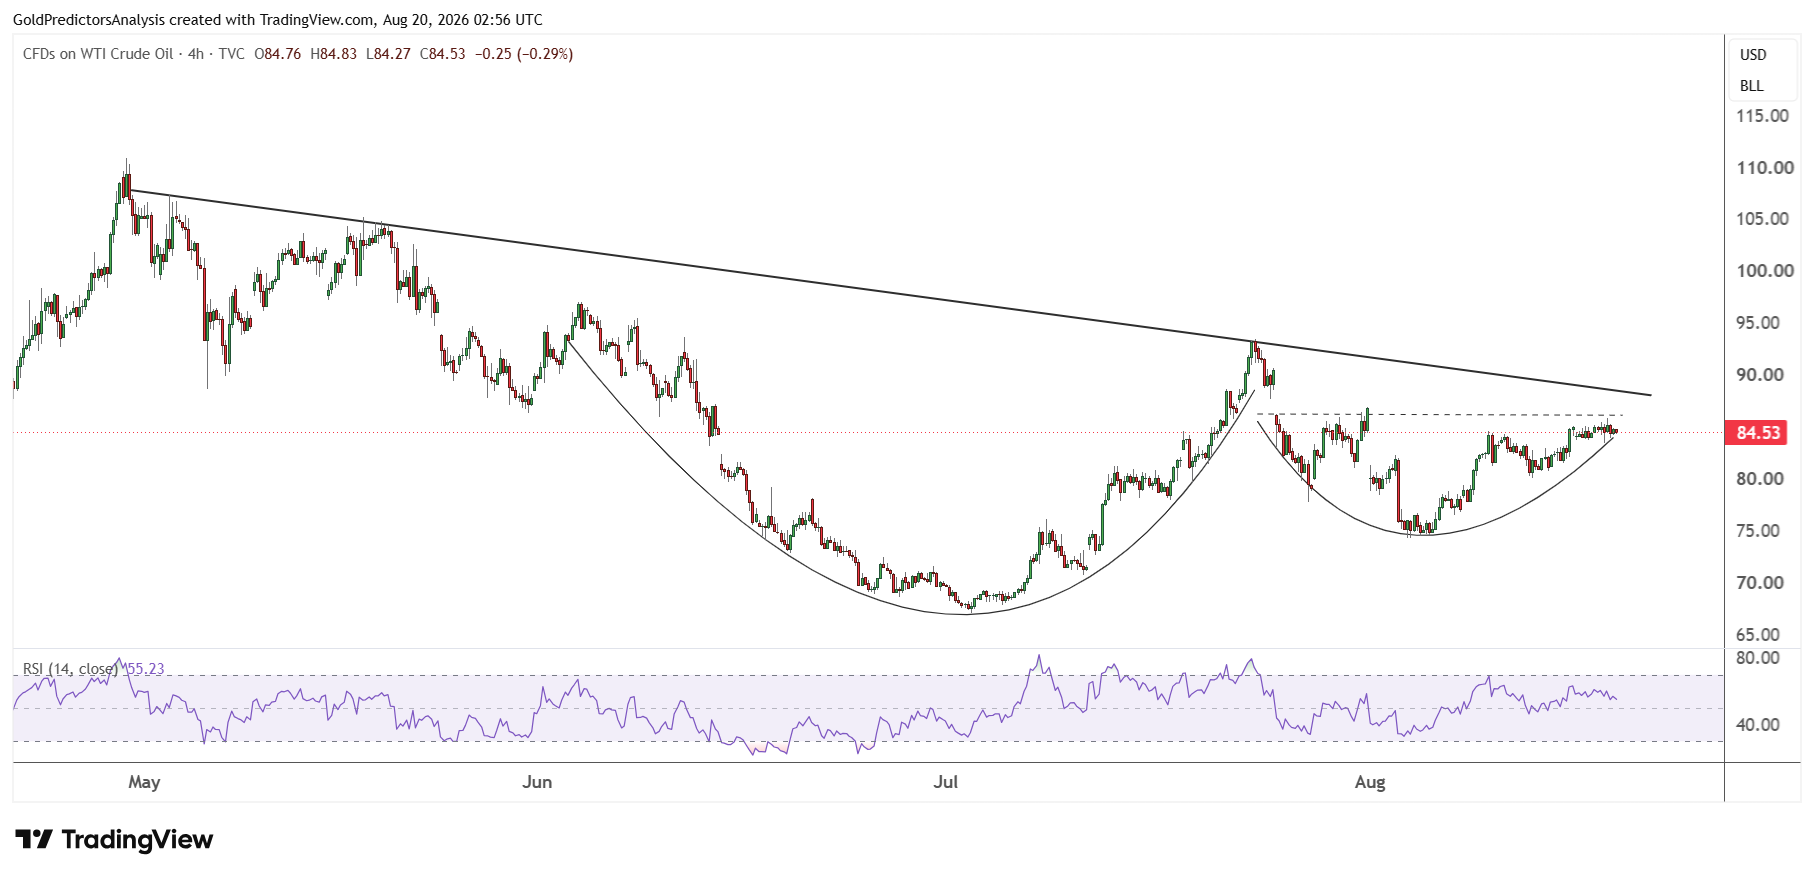
It is interesting to note that when the pattern is viewed from May, the price action is even more bullish. The rounding bottom pattern has formed below the descending trend line. This line will be broken around the $89 area.
A break above this descending trend line will likely confirm a bottom and push prices towards the $105 region. The RSI is also consolidating above the midline, which indicates the potential for further upside in the WTI crude oil market. But a break below $66 will negate the bullish structure and offer further downside.
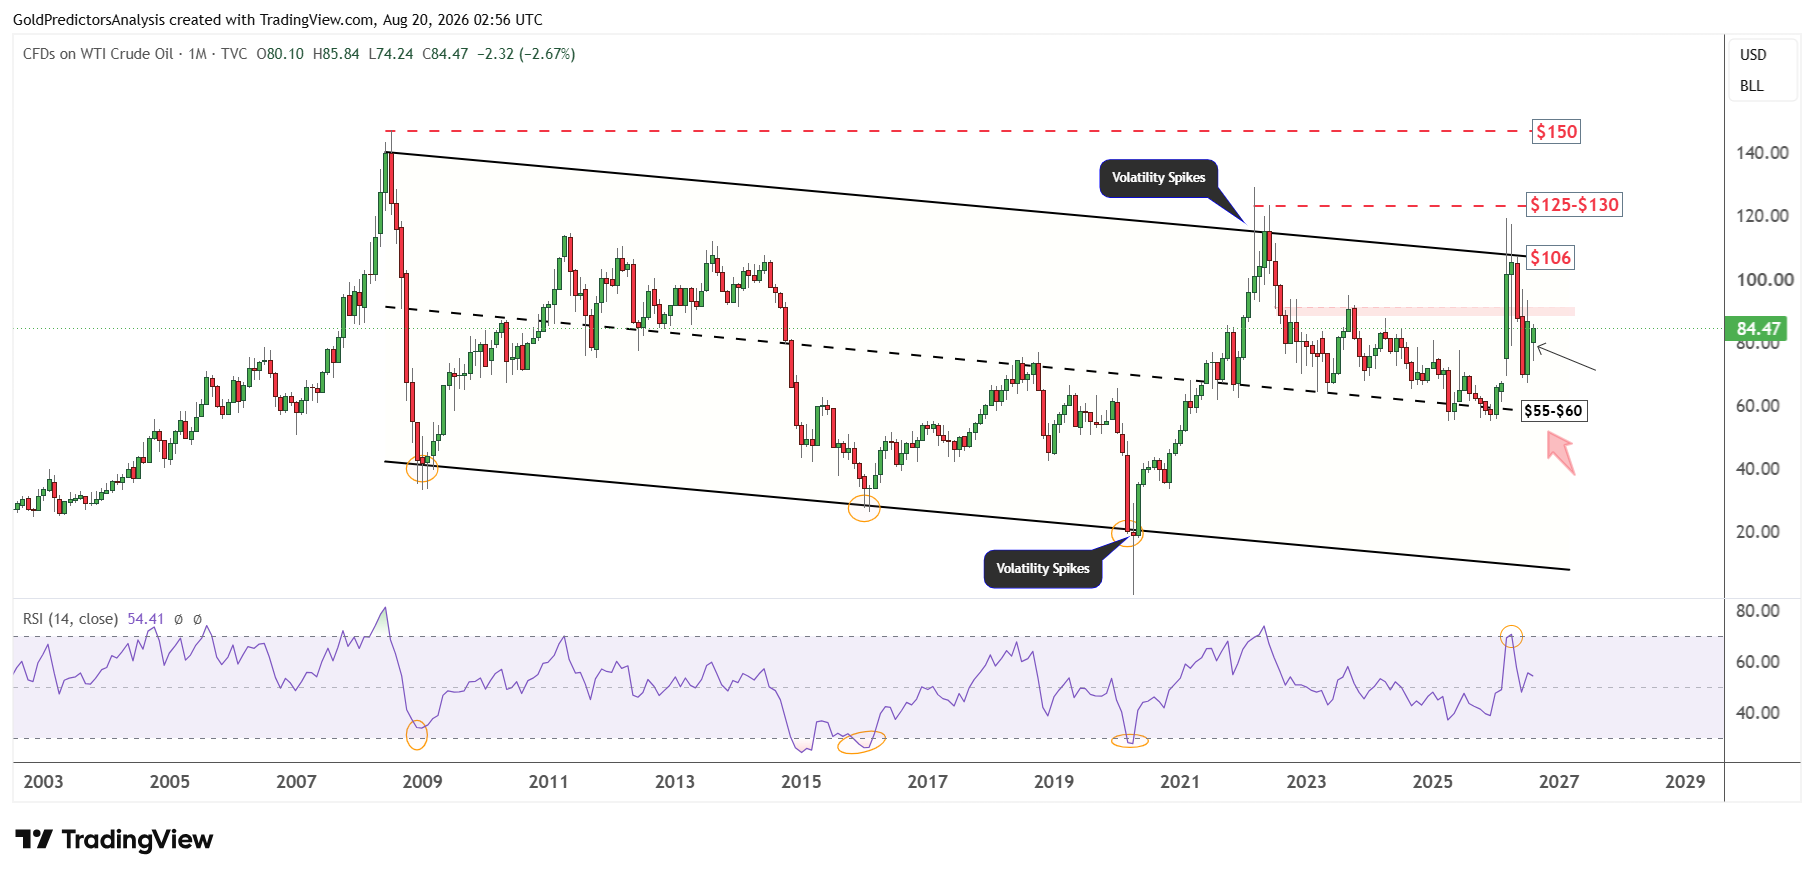
The long term outlook for WTI crude oil also remains constructive. The oil spike from around $66 towards $120 after the US-Iran war failed to break above the descending trend line of the channel. The strong drop from $120 back towards $67 was due to this strong resistance.
But WTI crude oil formed bottom in July after this drop. The price is now rebounding towards the $100 region. This indicates that if prices break above this descending channel, it will likely push the price towards the $125-$130 region. On the other hand, a break above $130 will likely push WTI prices towards the $150 area. The RSI is also rebounding from the midline which indicates constructive price action in the WTI crude oil market.
Brent Oil Price Forecast
Every new Brent Oil analysis as it publishes, today's technical signal and key levels, live price — on one page.
See all Brent Oil forecastsBrent Crude Oil Price Forecast: $100 Breakout Could Open $120-$127
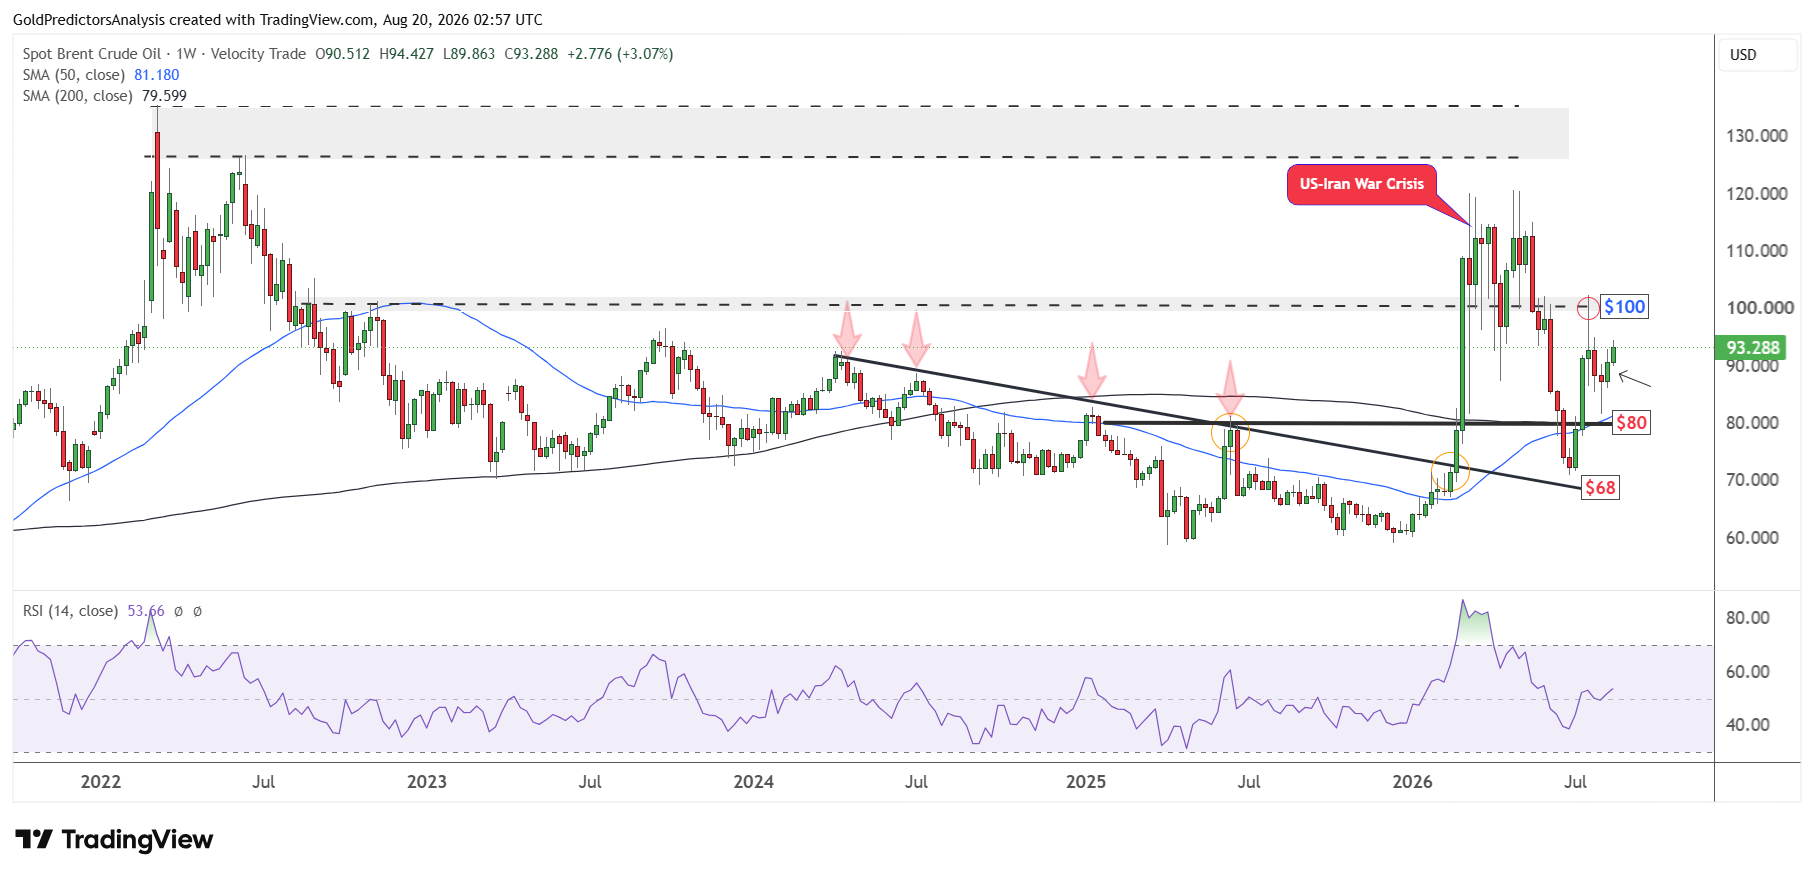
Brent crude oil shows even stronger price action compared to the WTI crude oil market. It is observed that prices remained above the $80 region after the drop. The sharp rebound during the first week of August 2026 triggered strong bullish weekly candles, which point towards the $100 area.
The 50 SMA has crossed above the 200 SMA on the weekly chart. The RSI also remains above the midline, which points to strong bullish momentum in the Brent crude oil market. A break above the $100 region will likely push Brent crude oil prices towards the $120 area. On the other hand, a break above $120 will take prices towards the $135 region.
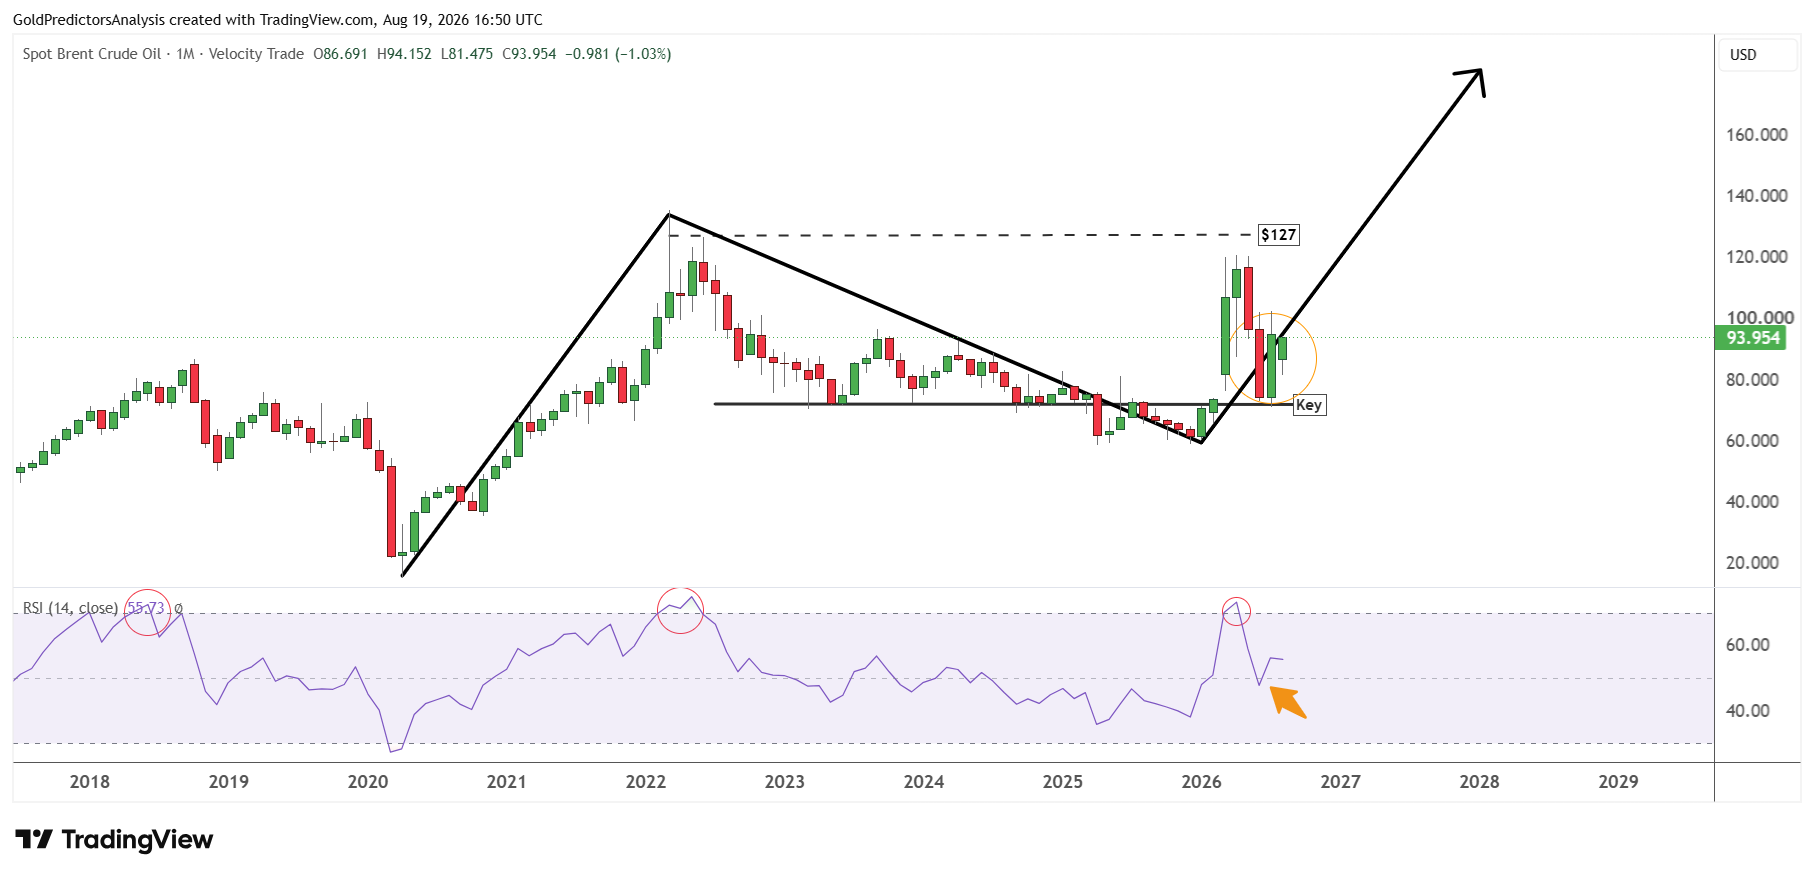
The monthly chart for Brent crude oil also shows constructive price action. It is observed that the strong rally from the April 2020 low towards the peak of March 2022, followed by the correction from March 2022 towards the lows of December 2025 has formed strong, constructive bullish price action.
The recent drop in June 2026 failed to break below the key level of $70 and the price rebounded strongly. The monthly candle for July indicates that the Brent crude oil market may push towards the $127 level. A break above $127 will open the door for strong rally in Brent oil towards the $160-$180 area.
The RSI also rebounds from the midline when Brent oil rebounds from the key level of $70. This indicates that the price may continue to rally in the short term.
Bottom Line
The outlook for oil prices remains constructive but the next move will depend on supply risks and technical breakouts. The tensions in the Middle East and slow shipping through Strait of Hormuz keep the oil prices elevated. But an increase in U.S. inventories may limit the rally unless the conflict causes major supply disruption.
WTI must break above the $87-$89 resistance zone to target $100 and $105. But a break below $66 would weaken the bullish outlook. Brent shows stronger momentum and could move towards $120-$127 if it breaks above $100. Brent oil must hold the key level of $70 to keep the bullish momentum. Therefore, oil prices may continue to rise gradually but a stronger rally will require a clear breakout or serious disruption to regional oil supplies.
Read more: Iran Tensions Push Brent Toward $100