


PUMP, the native token of Solana-based memecoin launchpad Pump.fun, has rallied by over 400% from its June lows. A bearish momentum divergence and a heavily skewed liquidation structure, however, raise sharp pullback risks.

Bearish RSI Divergence Warns of PUMP Price Pullback
PUMP recently pushed toward a fresh local high around $0.0059-$0.0060, bringing price close to the 0.618 Fibonacci retracement level at $0.006034.
However, the daily relative strength index has failed to confirm the higher high.
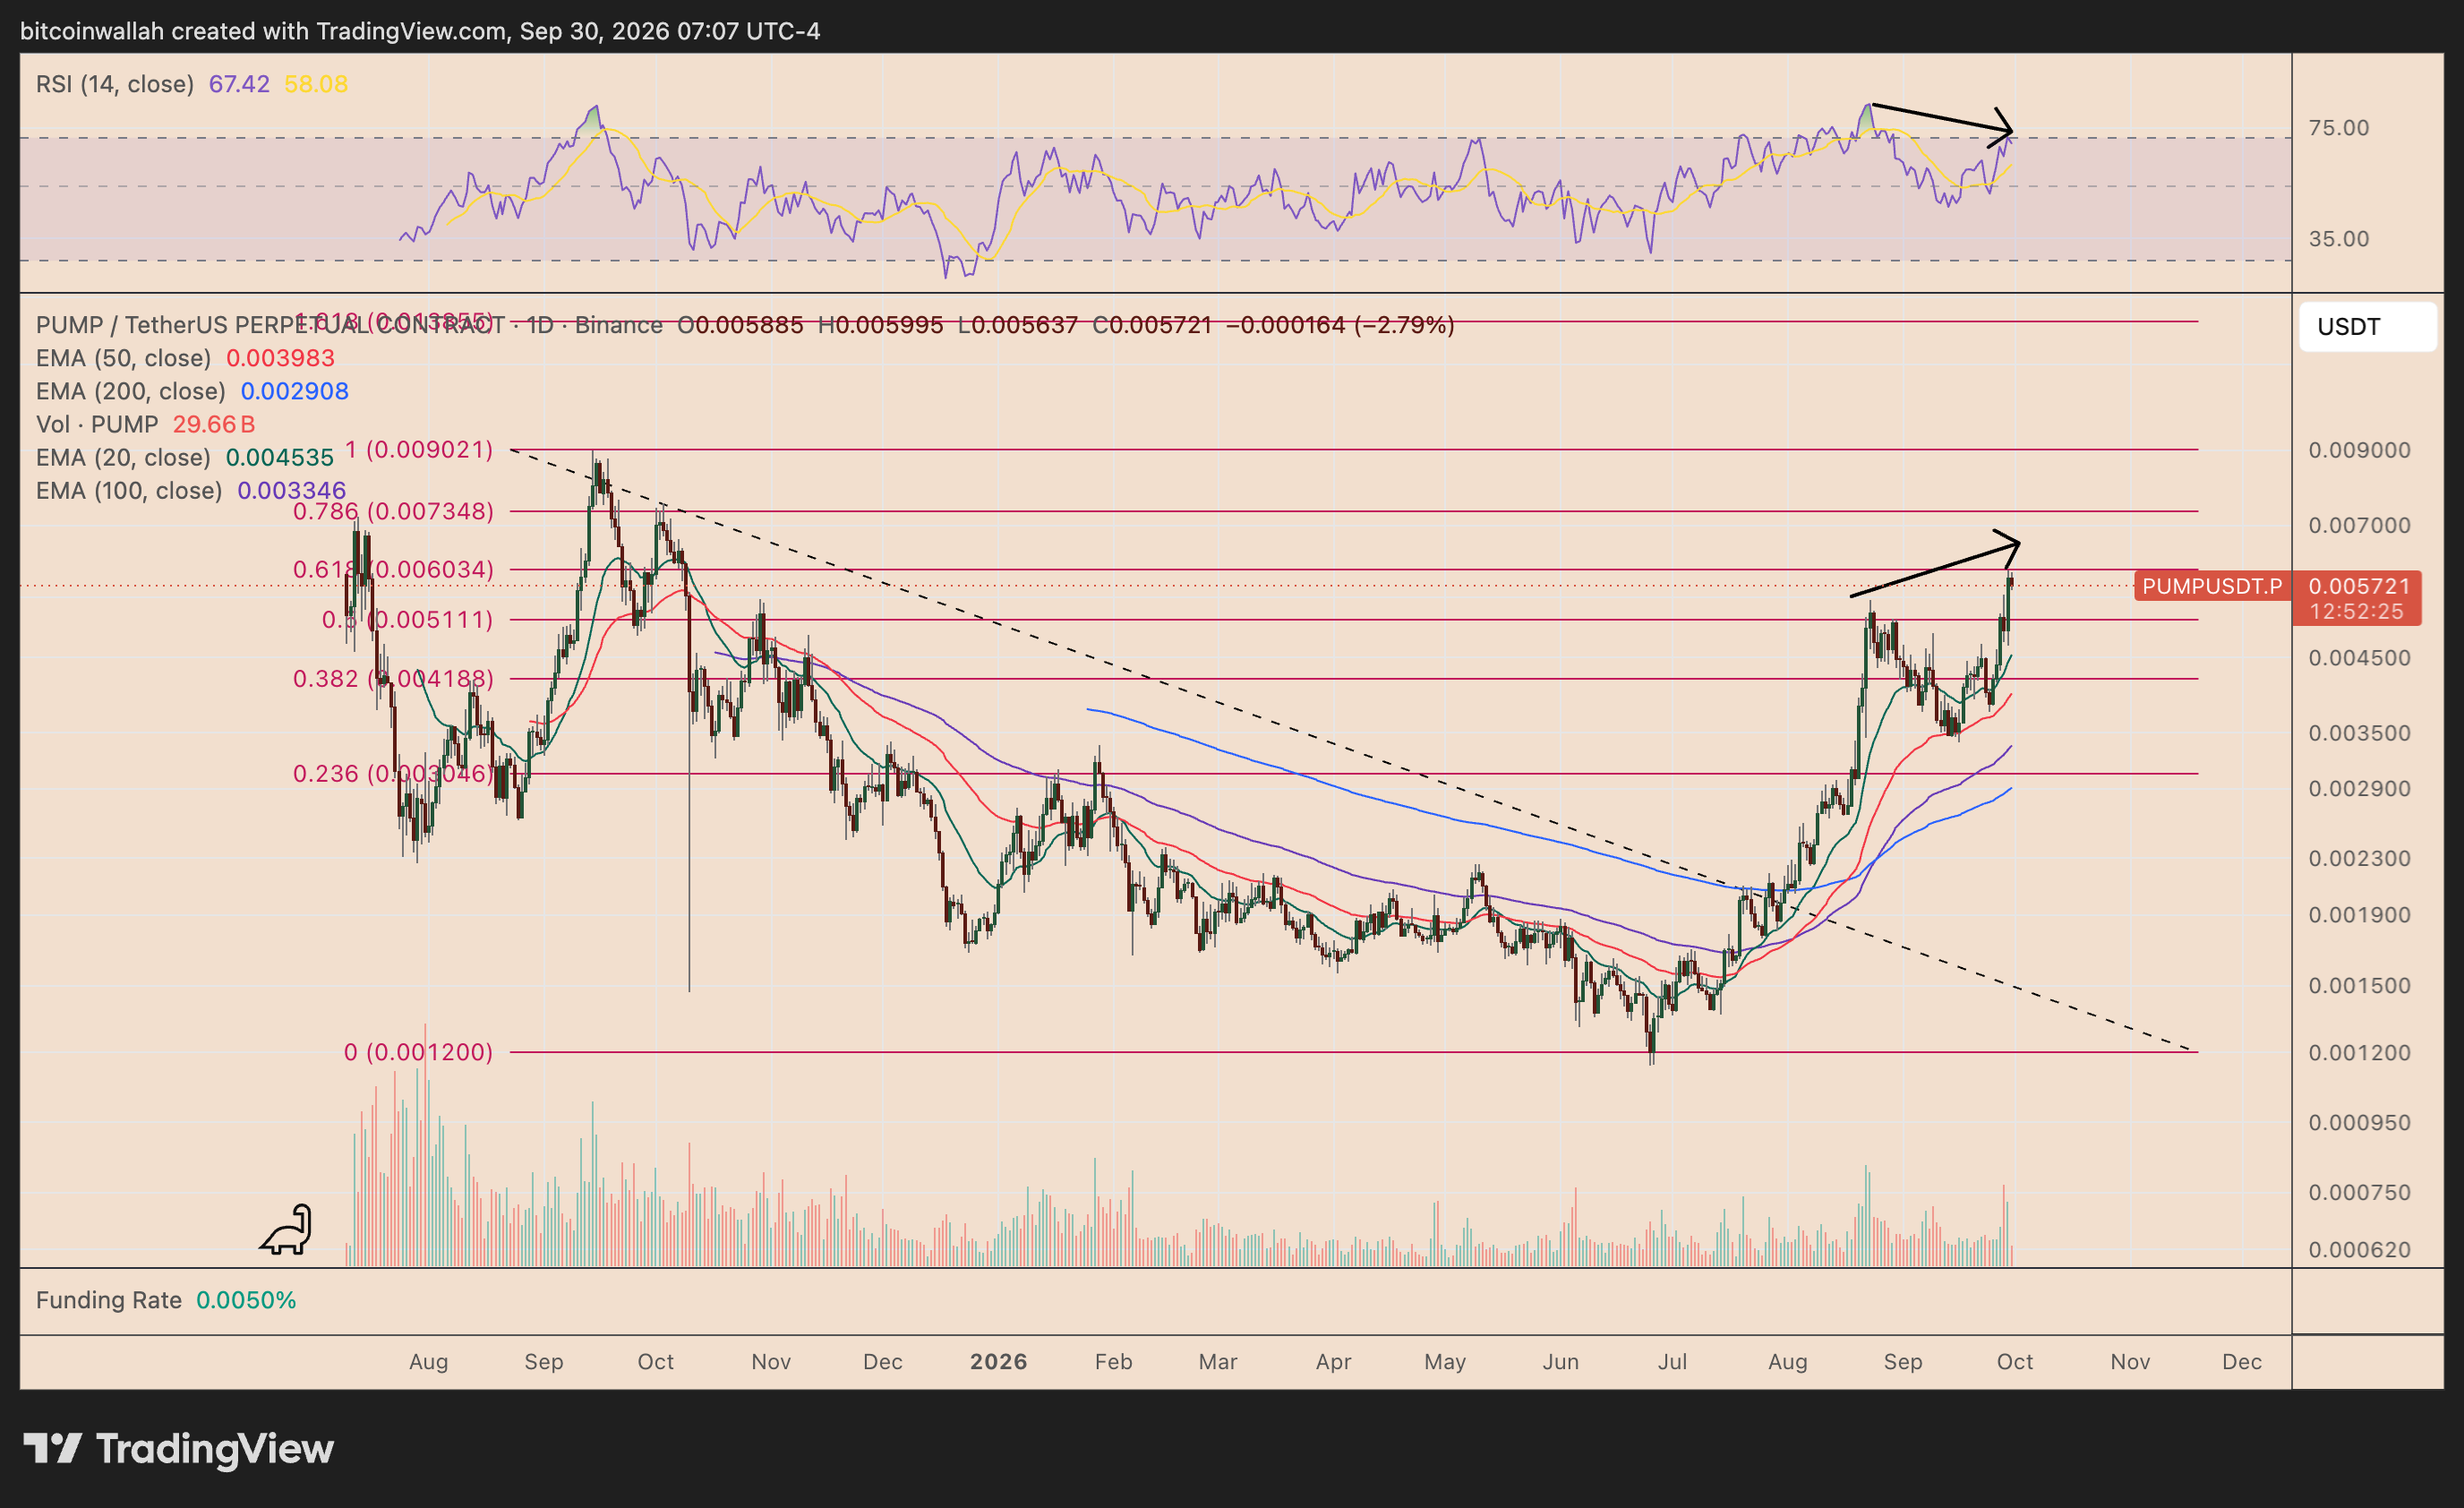
RSI remains elevated near 67, meaning another short-lived push toward or above $0.0060 cannot be ruled out. Still, a rejection around the 0.618 Fib resistance could trigger profit-taking.
The first major downside level sits at the 0.5 Fib near $0.00511. A stronger correction could then drag PUMP toward its 20-day EMA (green) around $0.00454, implying a decline of roughly 20% from recent highs.
Below that, the 0.382 Fib near $0.00419 would serve as the next major support zone.
$39.64M Long Liquidation Exposure Strengthens Bearish Case
PUMP’s liquidation map reinforces the downside setup by showing a sharp imbalance between long and short liquidation exposure.
If PUMP rallies toward $0.006164, approximately $2.79 million in short positions could be liquidated, according to data resource CoinGlass.
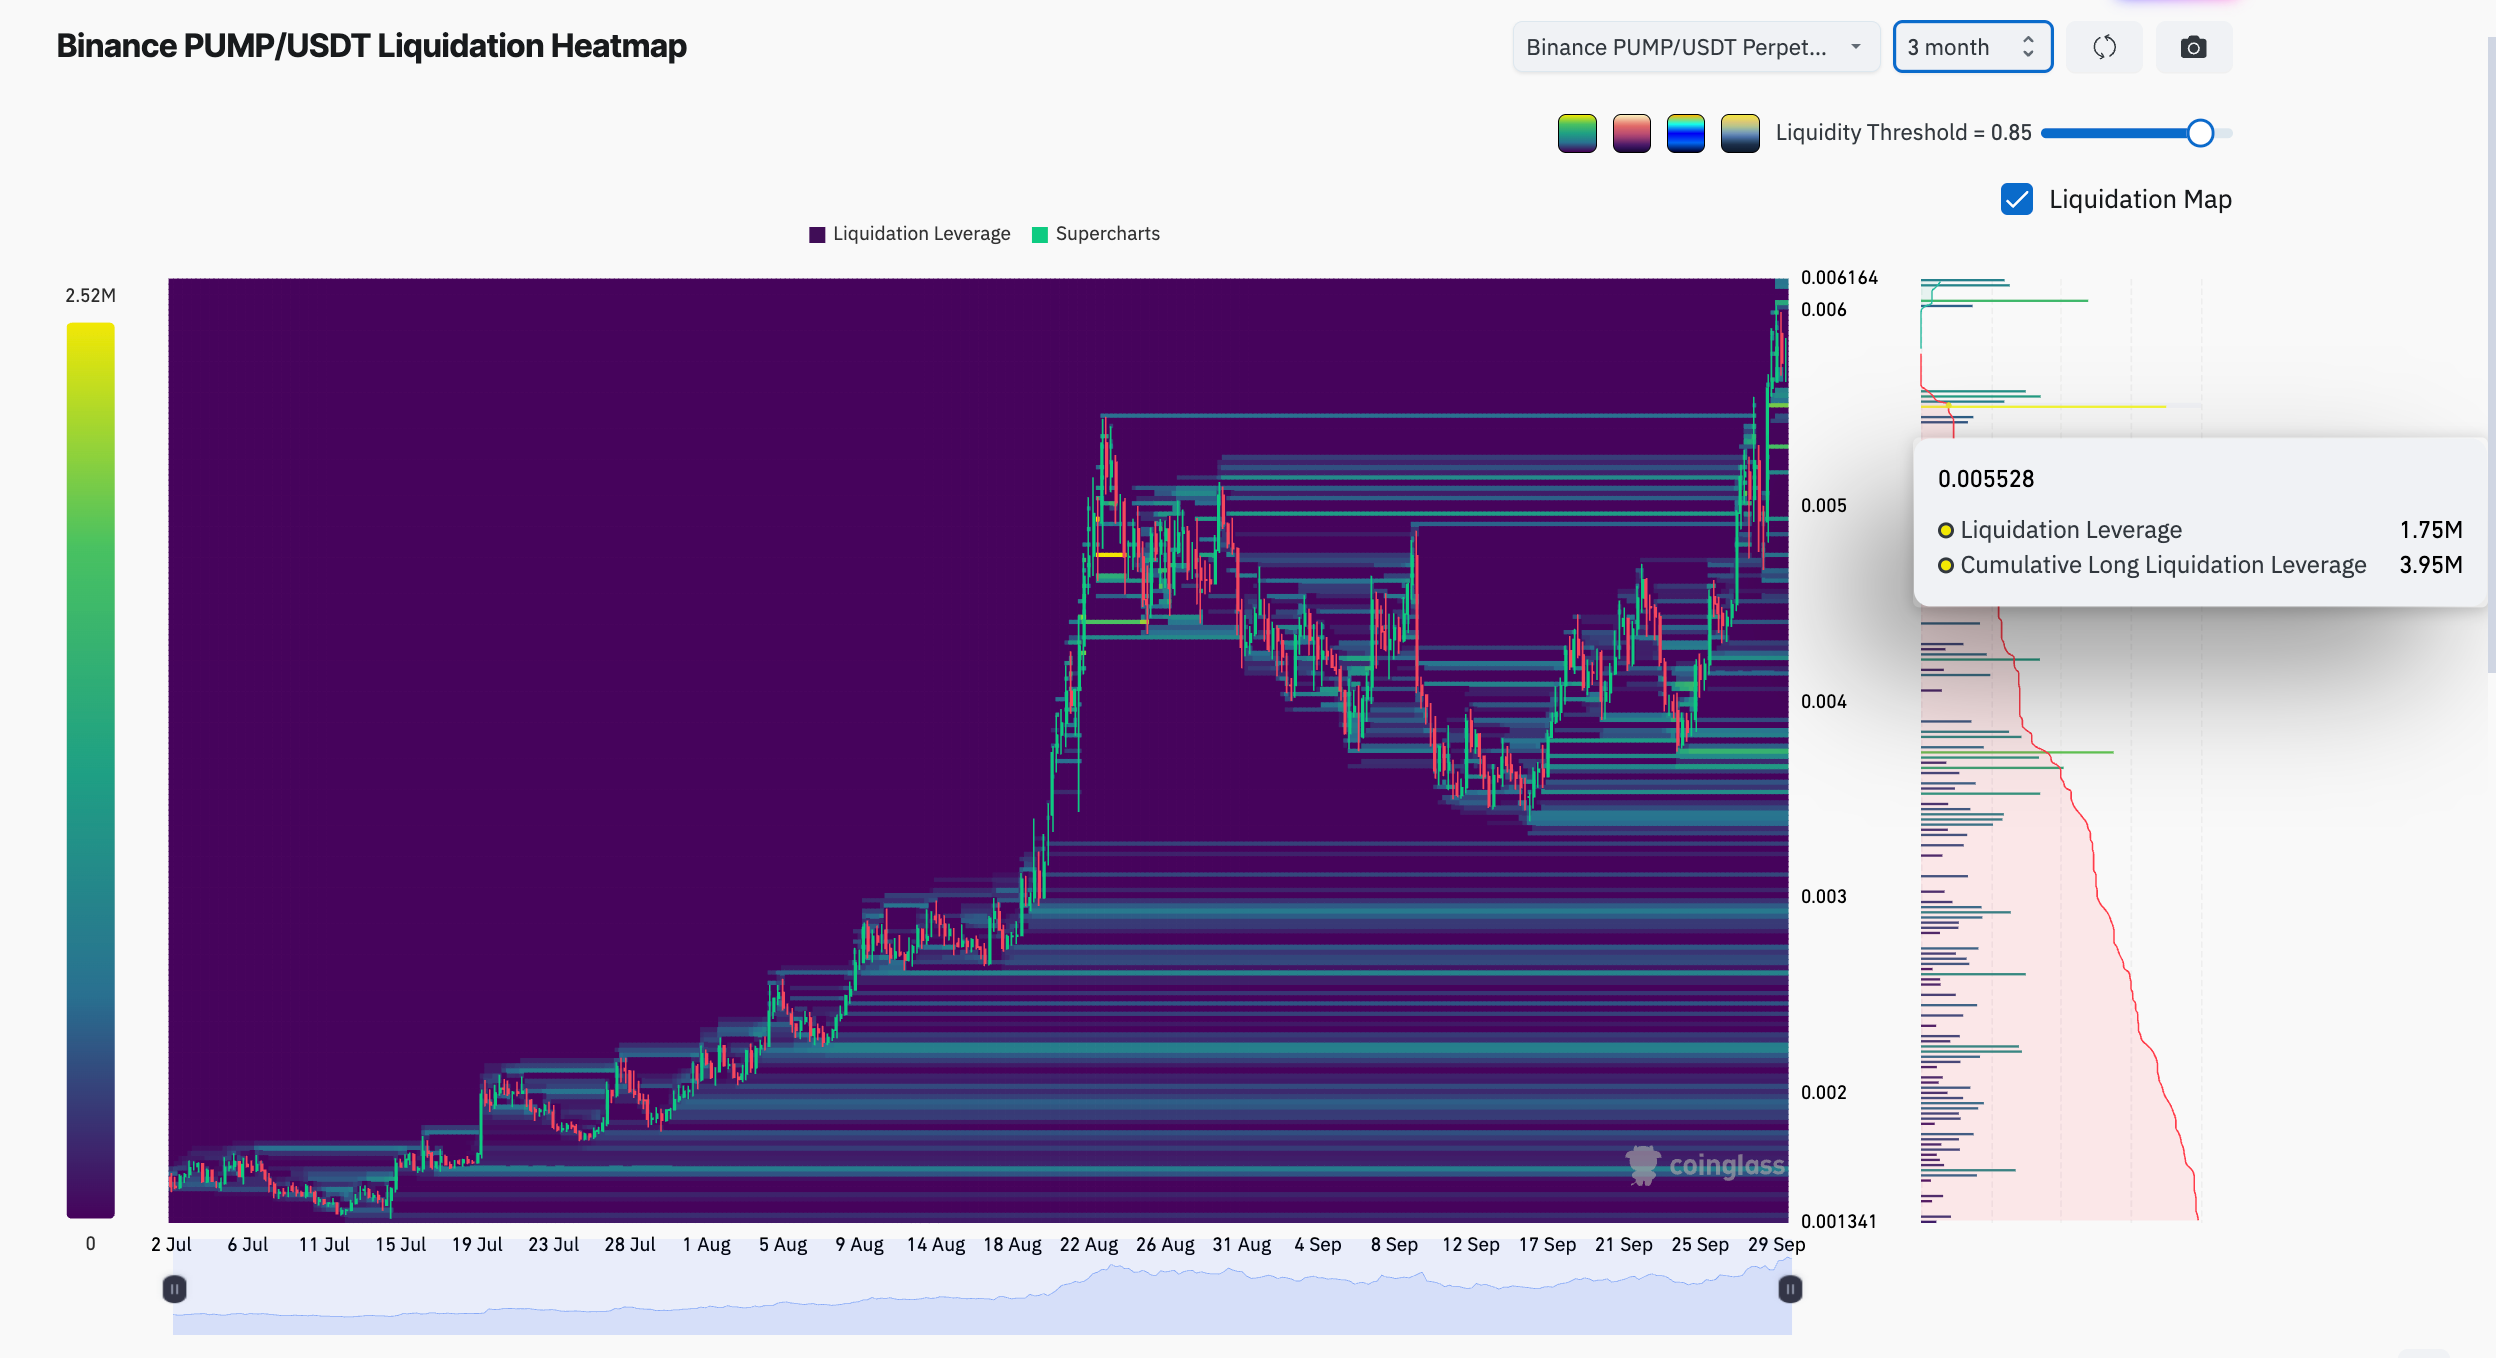
By comparison, a decline toward $0.001341 would expose around $39.64 million in cumulative long liquidations, more than 14 times the short-liquidation exposure above the market.
The biggest nearby liquidation cluster sits around $0.005528, where roughly $3.95 million in long positions are vulnerable.
That level could act as a near-term liquidity magnet. A move toward $0.00553 would put PUMP within striking distance of the $0.00511 Fib support.
If that level fails, liquidation pressure could accelerate the decline toward the 20-day EMA near $0.00454, followed by the $0.00419 Fib support.
The bearish RSI divergence and leveraged-long imbalance suggest that PUMP faces an elevated risk of a correction toward the $0.0051-$0.0045 region, with the 20-day EMA emerging as the key downside target.


