


NASDAQ 100 Technical Analysis
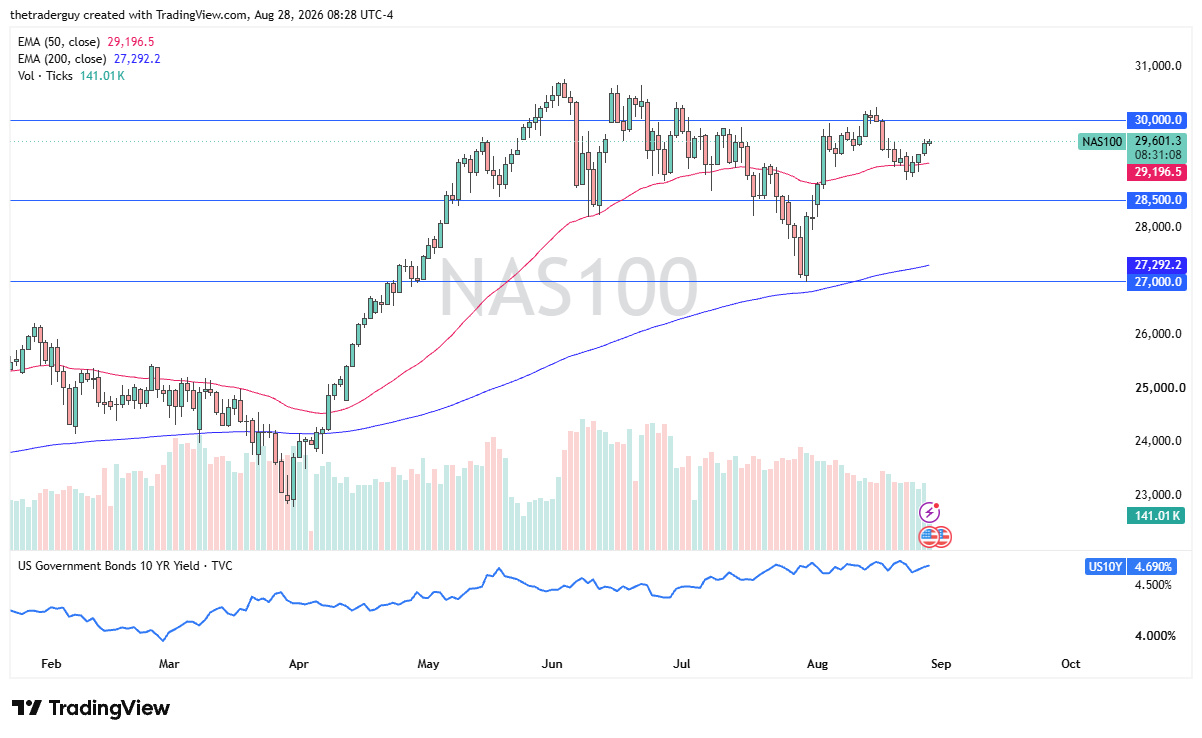
The Nasdaq 100 has been slightly positive during the early part of the trading session here on Friday, showing signs of life despite the fact that there is a speech by Kevin Warsh coming from the Jackson Hole Symposium. Kevin Warsh will give us a bit of a heads up as to what it is the Federal Reserve might be thinking, and that obviously has a knock-on effect in the stock market most days. So, with this being the situation, despite the fact that we have recovered quite nicely, it is a market that could turn around pretty quickly.
Dow Jones 30 Technical Analysis
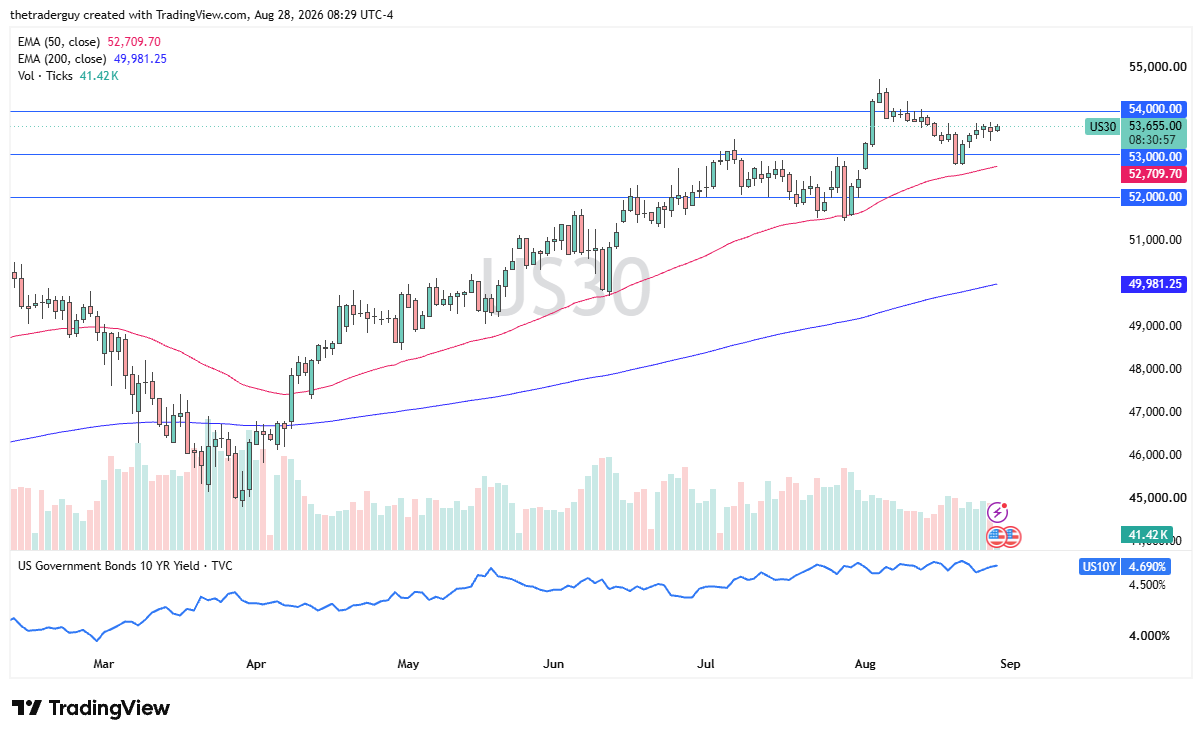
The Dow Jones 30 looks a little bit positive heading into that speech as well, with the 54,000 level above being a potential target. Short-term pullbacks could continue to see support down at the 53,000 level, an area that has proven itself to be important so far. And with that, market participants might be looking for value, but again, that speech is a major wild card.
S&P 500 Technical Analysis
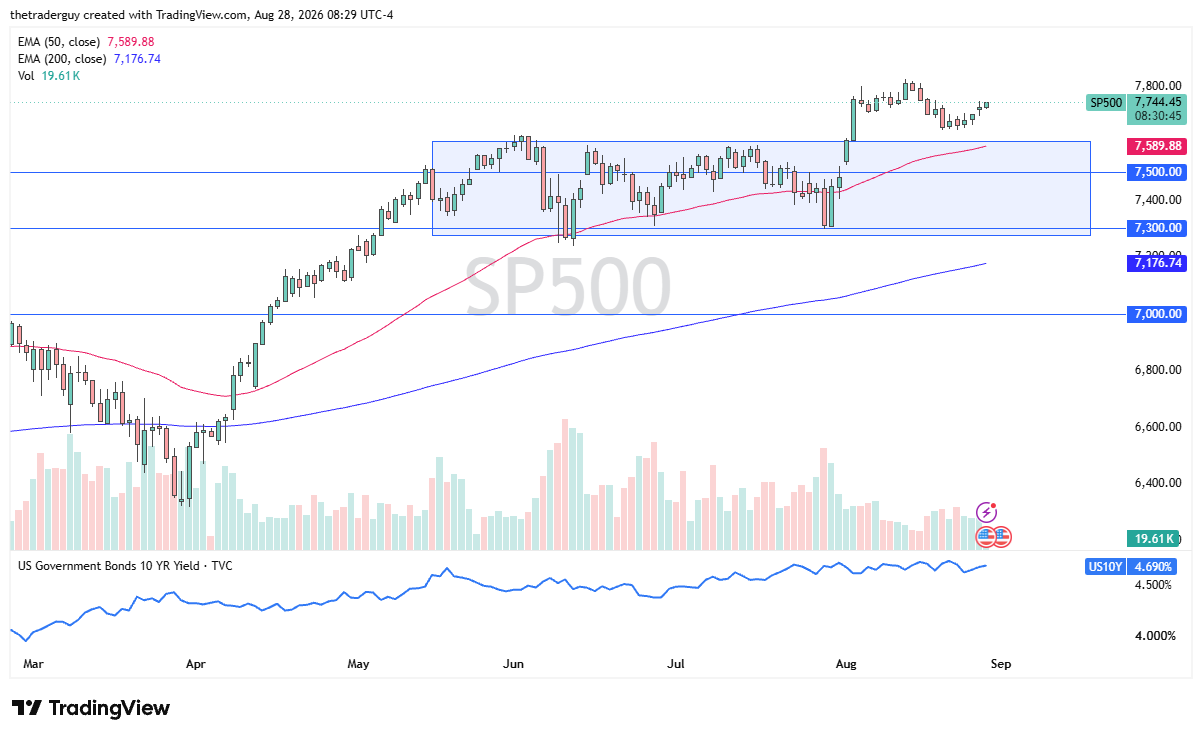
The S&P 500 looks a bit positive in early trading as well, as it looks like the market is eyeballing the 7,800 level, an area that had been resistance previously. Short-term pullbacks open up the possibility of buying opportunities in this overall trend. The 7,600 level is an area that has previously been resistance, and it could be support based on market memory and the 50-day EMA being there.
Ultimately, this long-term uptrend is something that I still believe is intact, despite the few concerns that are coming up later this afternoon and the never-ending drama coming out of the Middle East.
If you’d like to know more about chart patterns and how to trade them, please visit our educational area.