


Cybersecurity Cracks, AI Holds
The S&P 500 traded flat Wednesday while the Dow Jones Industrial Average outperformed and the Nasdaq Composite slipped. The session followed a strong push earlier in the week that took indexes to new highs but buyers could not find a reason to extend the move.
Cybersecurity stocks got hit hard after Zscaler disappointed on forward guidance and dragged the entire group lower. On the other side of the market, Micron kept running after crossing the $1 trillion market cap mark and oil dropped roughly 6% on reports that Iran plans to reopen the Strait of Hormuz to commercial shipping.
he mix of headlines left traders stuck between strong earnings momentum and fresh uncertainty about where the next push comes from.
Zscaler Dragged the Whole Group Down
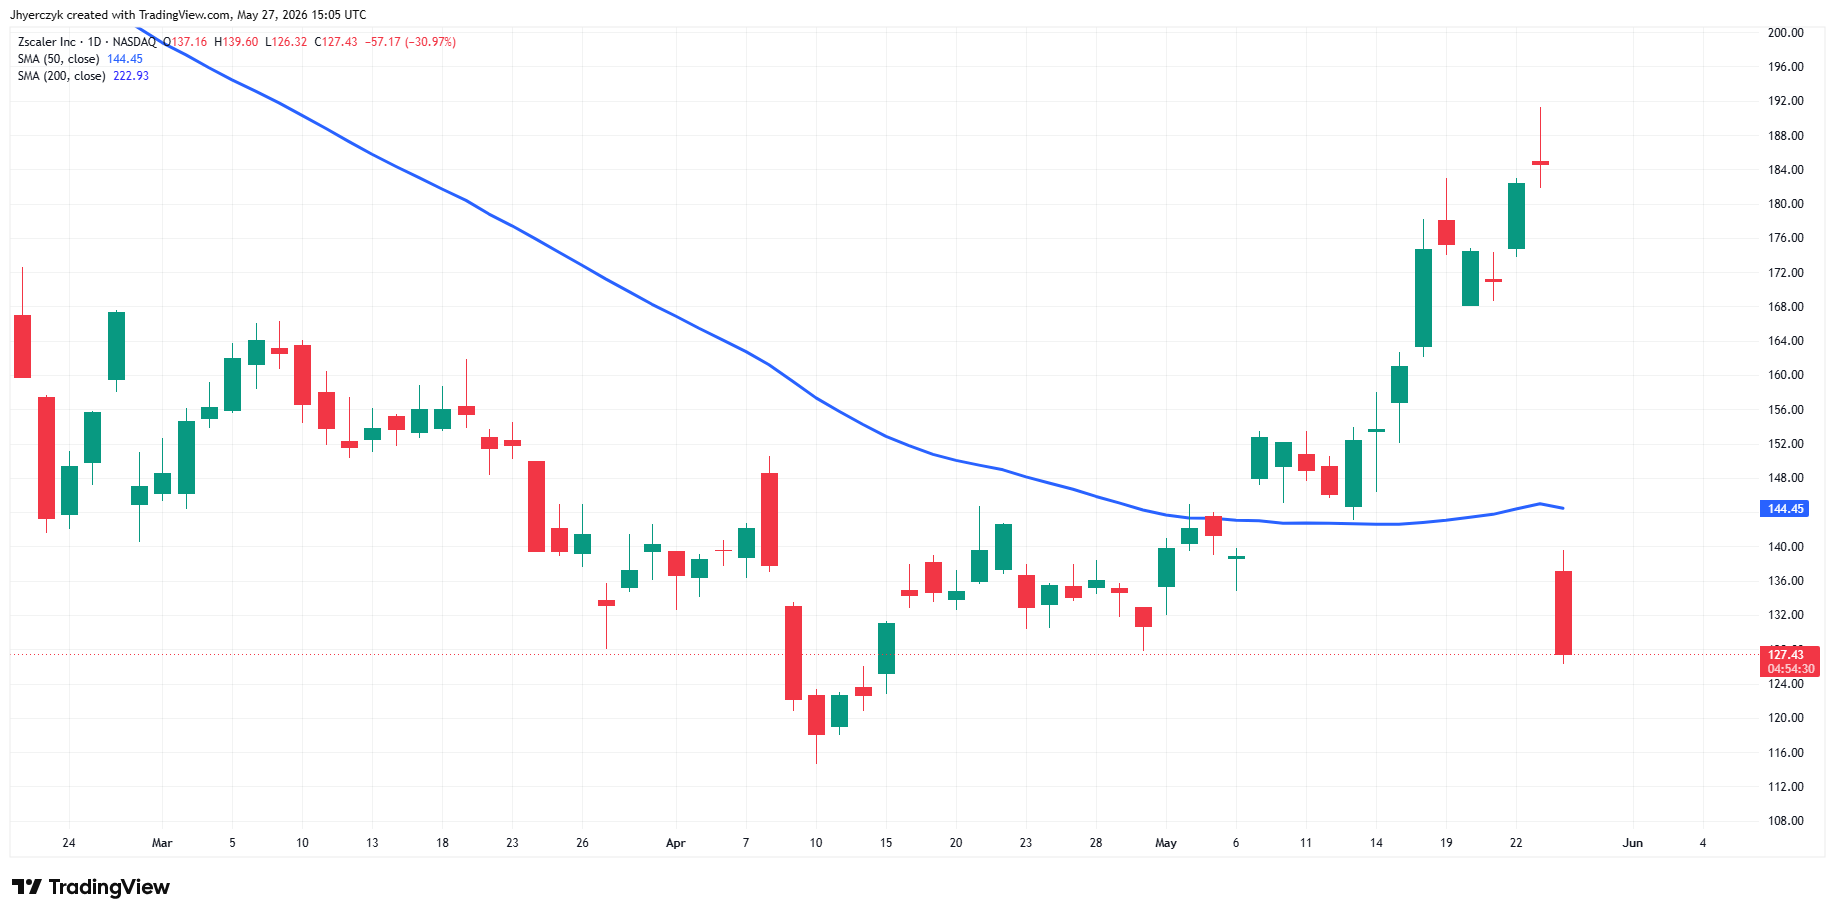
Zscaler beat on earnings and revenue and the stock got crushed anyway because forward guidance came in light. Palo Alto Networks sold off with it. CrowdStrike sold off with it. The Global X Cybersecurity ETF dropped as traders pulled money from the whole group without waiting to see if this was bigger than one name.
Two Memory Chipmakers Hit $1 Trillion in the Same Week
Micron crossed the $1 trillion market cap this week and SK Hynix in South Korea reportedly got there around the same time on the same AI demand story. UBS pointed to long-term supply agreements that memory producers have already locked in with AI infrastructure customers as the reason the run has room to continue.
Stocks in the News
Bath & Body Works ripped higher after raising guidance and beating on earnings. Semtech beat on earnings and revenue then raised the outlook for next quarter. Sandisk got an upgrade on pricing strength expected to hold through 2027. MGM gained on an analyst upgrade pointing to strong U.S. leisure travel demand. Modine Manufacturing extended its run after strong earnings and a major data center cooling deal.
Dick’s Sporting Goods slipped after keeping full-year guidance cautious despite a slight revenue beat. Insulet dropped on a voluntary medical device correction. Box missed on forward guidance even though the quarterly numbers beat.
Dow Jones Price Forecast
Every new Dow Jones analysis as it publishes, today's technical signal and key levels, live price — on one page.
See all Dow Jones forecastsOil Drops 6% and the Rate Story Changes With It
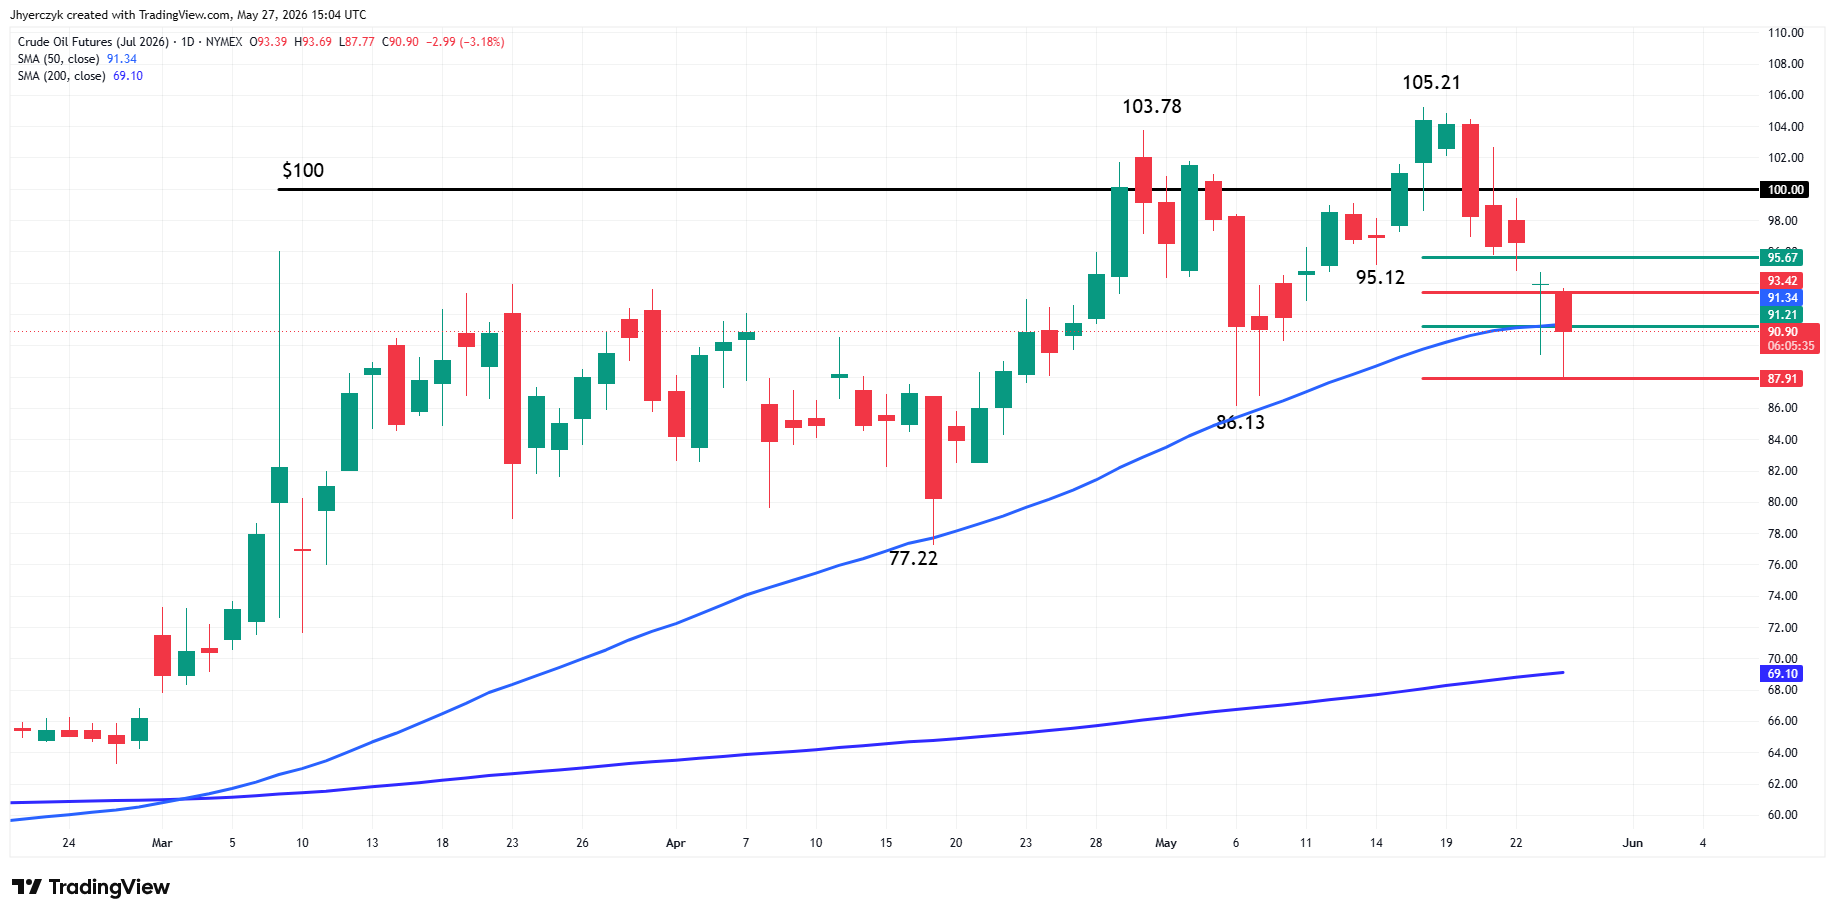
July WTI crude oil fell below $89 a barrel Wednesday after reports that Iran plans to restore commercial shipping through the Strait of Hormuz as part of a broader agreement with the United States. That is a 6% drop in one session. President Donald Trump said discussions with Iran were moving in a positive direction and that added to the selling pressure in crude.
When oil drops that hard and that fast it changes the inflation picture immediately. That takes transportation costs lower. It takes input prices lower. And it gives the Federal Reserve room it did not have a week ago. If the Strait of Hormuz reopens and June WTI crude oil stays below $89 the rate picture changes fast.
Daily S&P 500 Index (SPX) Technical Analysis
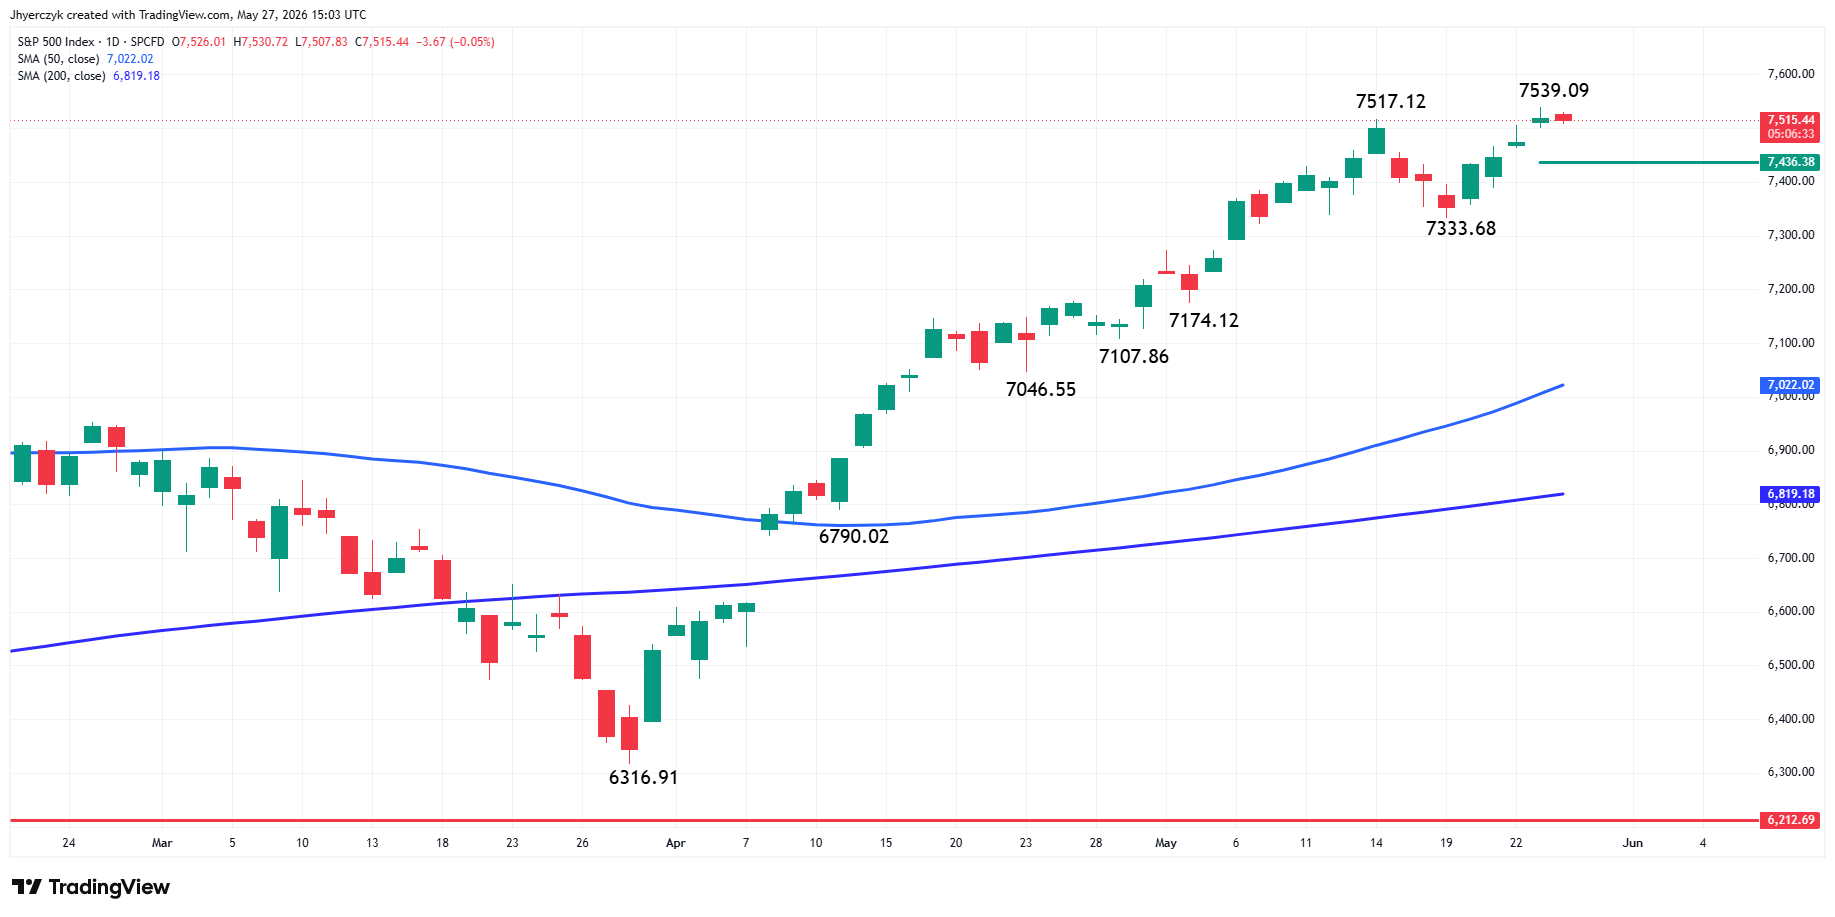
The S&P 500 Index is treading water early in the session on Wednesday. The main trend is up but the intraday momentum is weak, leading to an inside trading session. A trade through 7539.09 will signal a resumption of the uptrend. A move through 7333.68 will change the main trend to down.
The short-term range is 7333.68 to 7539.09. Its 50% level at 7436.38 is the first downside target today should the index weaken. With the benchmark close to another all-time high, I just want to remind investors that there is no true resistance identified so the price action is most important. A higher-high, lower close will be one of the best patterns formed to identify profit-taking or a shift in momentum. Although we’re looking at the daily chart, the formation of that pattern on the hourly or 15-minute charts could serve as an early warning that the selling is greater than the buying at current price levels.
What to Watch
The Strait of Hormuz headline is the single biggest unresolved driver going into Thursday. If Iran follows through on reopening commercial traffic and June WTI crude oil holds below $89, the inflation pressure that has been keeping the Federal Reserve locked in place starts to ease. That changes the rate outlook and it changes how equity traders value growth stocks at these levels.
Earnings season is still coming in strong broadly but Zscaler proved that the market is punishing guidance misses harder than it is rewarding beats right now. If more software or cybersecurity names report cautious outlooks in the next few sessions that selling could spread.
The S&P 500 is sitting just below 7539.09 with no resistance identified above it. A trade through that level confirms the uptrend and there is nothing on the chart to suggest sellers show up until the price action says otherwise. On the downside the 50% level at 7436.38 is where short-term support sits. A higher-high followed by a lower close on any timeframe from the daily down to the 15-minute chart is the early warning that profit-taking has started at these record levels.
More Information in our Economic Calendar.