


Crude and Yields Spread the Selling
The Nasdaq started the day with an earnings problem and by mid-session it turned into something broader. Brent pushed into triple digits and WTI cleared $92. Treasury yields followed crude higher with the 10-year reaching its highest level since January 2025. Rate-hike odds repriced hard. Alphabet and Tesla opened the door with their earnings misses but oil and yields are the reason the selling spread into the Dow and S&P 500 by Thursday afternoon.
At 16:15 GMT, the Nasdaq Composite is trading 25,143.203, down 547.70 or -2.13%. The S&P 500 Index is at 7,411.01, down 87.95 or -1.17%. The Dow is trading 51,772.36, down 446.22 or -0.85%.
Declining issues outnumber advancers 2.72-to-1 on the NYSE and 2.2-to-1 on the Nasdaq. This is not a megacap earnings problem anymore.
Rate-Hike Odds Doubled in a Week
Fed funds futures traders are pricing an 82% chance of a September hike, up from 52% a week ago. July odds jumped to 38% from 12% last week. That repricing happened because Brent went through $100 and jobless claims came in at 187,000, well below the 212,000 estimate and the lowest reading since 1969. The economy is not giving the Fed any reason to soften its tone while crude is giving it every reason to stay hawkish.
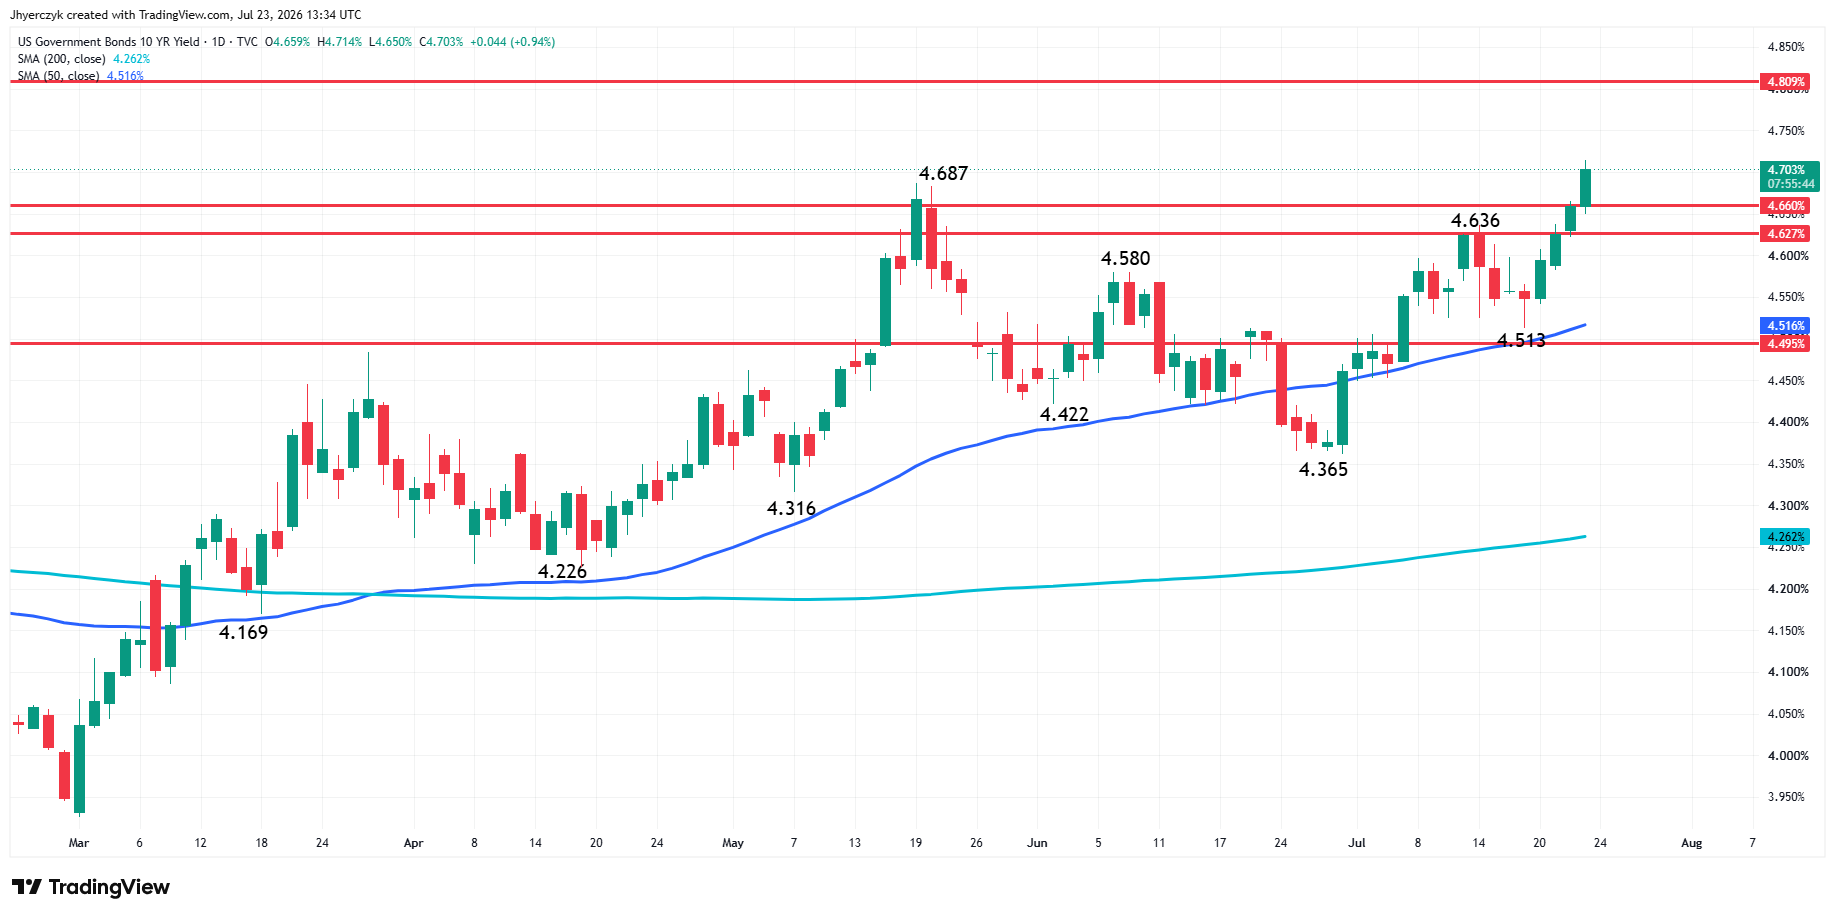
The 10-year Treasury yield rose to 4.707% and the 30-year pushed above 5.18%. The benchmark yield cleared its May 20 high at 4.687%, putting 4.809% in focus, a level last touched in January 2025. The bond market is not listening to calls for lower rates. This move is the market talking.
The 2-year yield climbed to 4.370%, resuming the steady stream of higher highs that began in March at 4.027%. The swing lows have been rising too with the nearest level at 4.111%. All of this is taking place on the strong side of the 50-day moving average at 4.128%.
Alphabet and Tesla Opened the Door
Alphabet fell 6.4% and dragged communication services down 4.4%. Tesla fell 12.2% after posting negative free cash flow for the first time in more than two years. Both reports put the cost of the AI and robotics buildout in front of traders.
Dow Jones Price Forecast
Every new Dow Jones analysis as it publishes, today's technical signal and key levels, live price — on one page.
See all Dow Jones forecastsTexas Instruments fell 3.2% despite forecasting quarterly revenue above estimates. The market is separating companies showing immediate earnings from companies asking traders to wait.
VIX Signals Demand for Protection
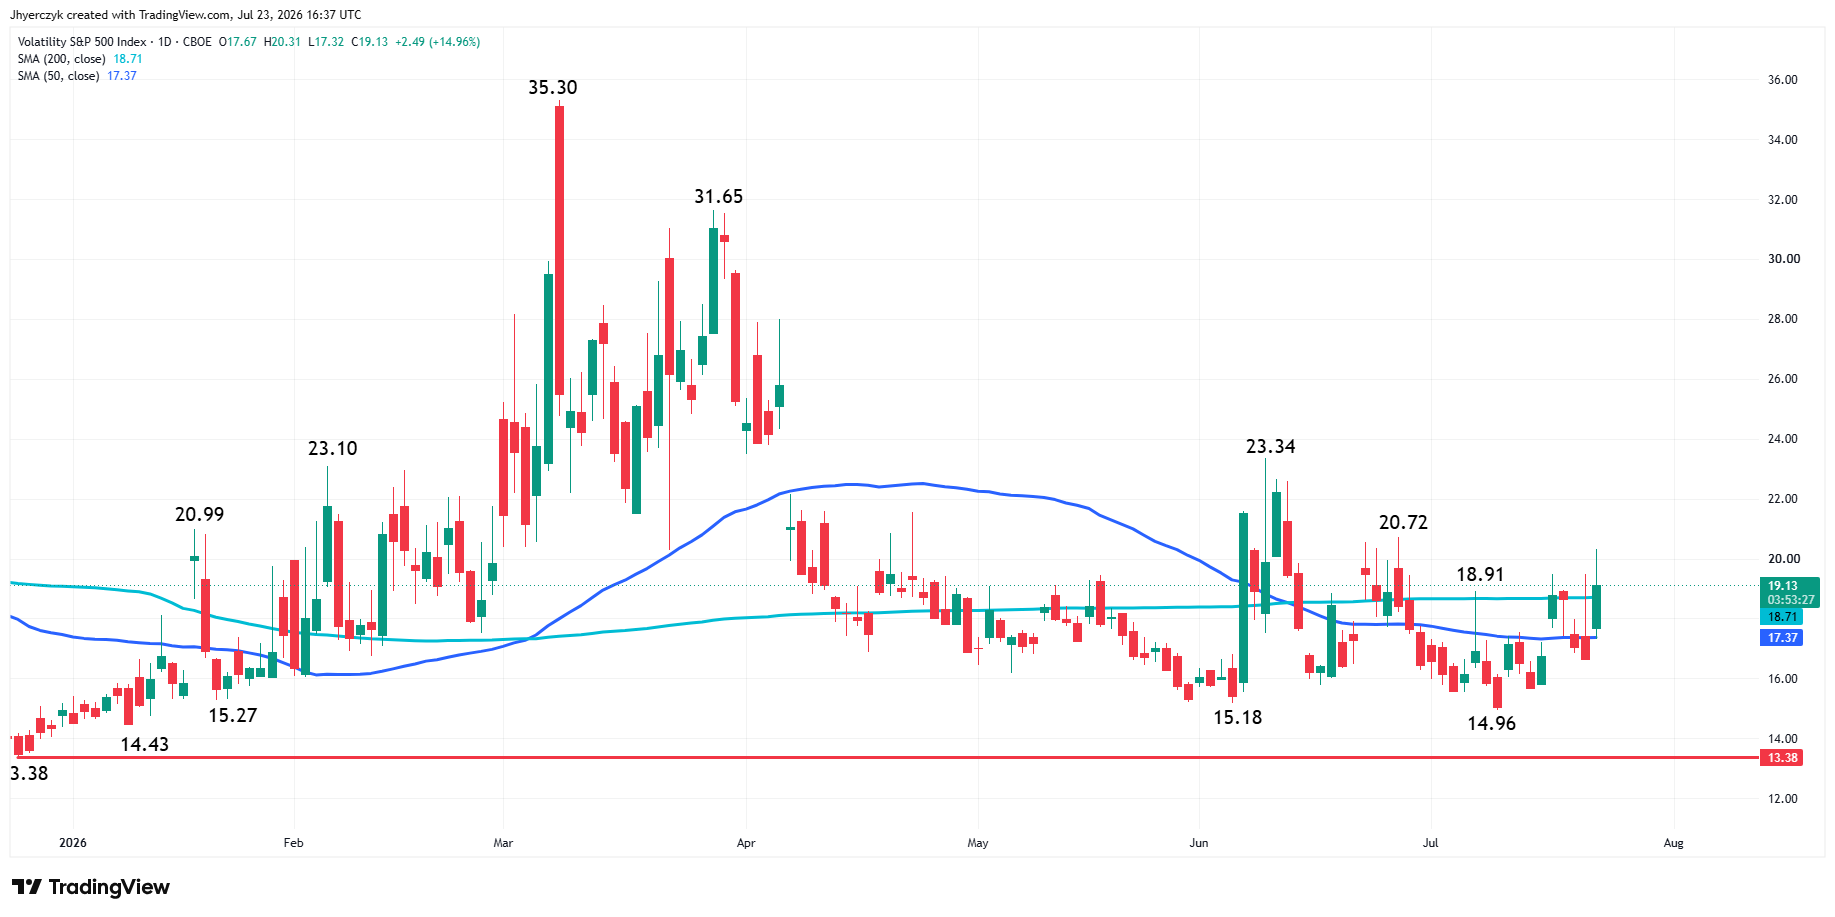
The VIX rose 2.15 points after three consecutive days of declines.
The spike drove the index to the strong side of its 200-day moving average at 18.71 and its 50-day at 17.36. This only becomes significant if the indicator holds above both averages. Additional strength gets recognized if the VIX takes out recent swing tops at 20.72 and 23.34.
Stocks in the News
Lockheed Martin rose after raising its 2026 sales and profit forecasts. The defense name is catching a bid as the Middle East conflict widens. ServiceNow gained after raising its annual subscription-revenue forecast for a second time. Money is moving toward companies with immediate earnings and away from companies where the spending bill is still growing.
Daily S&P 500 Index Technical Analysis
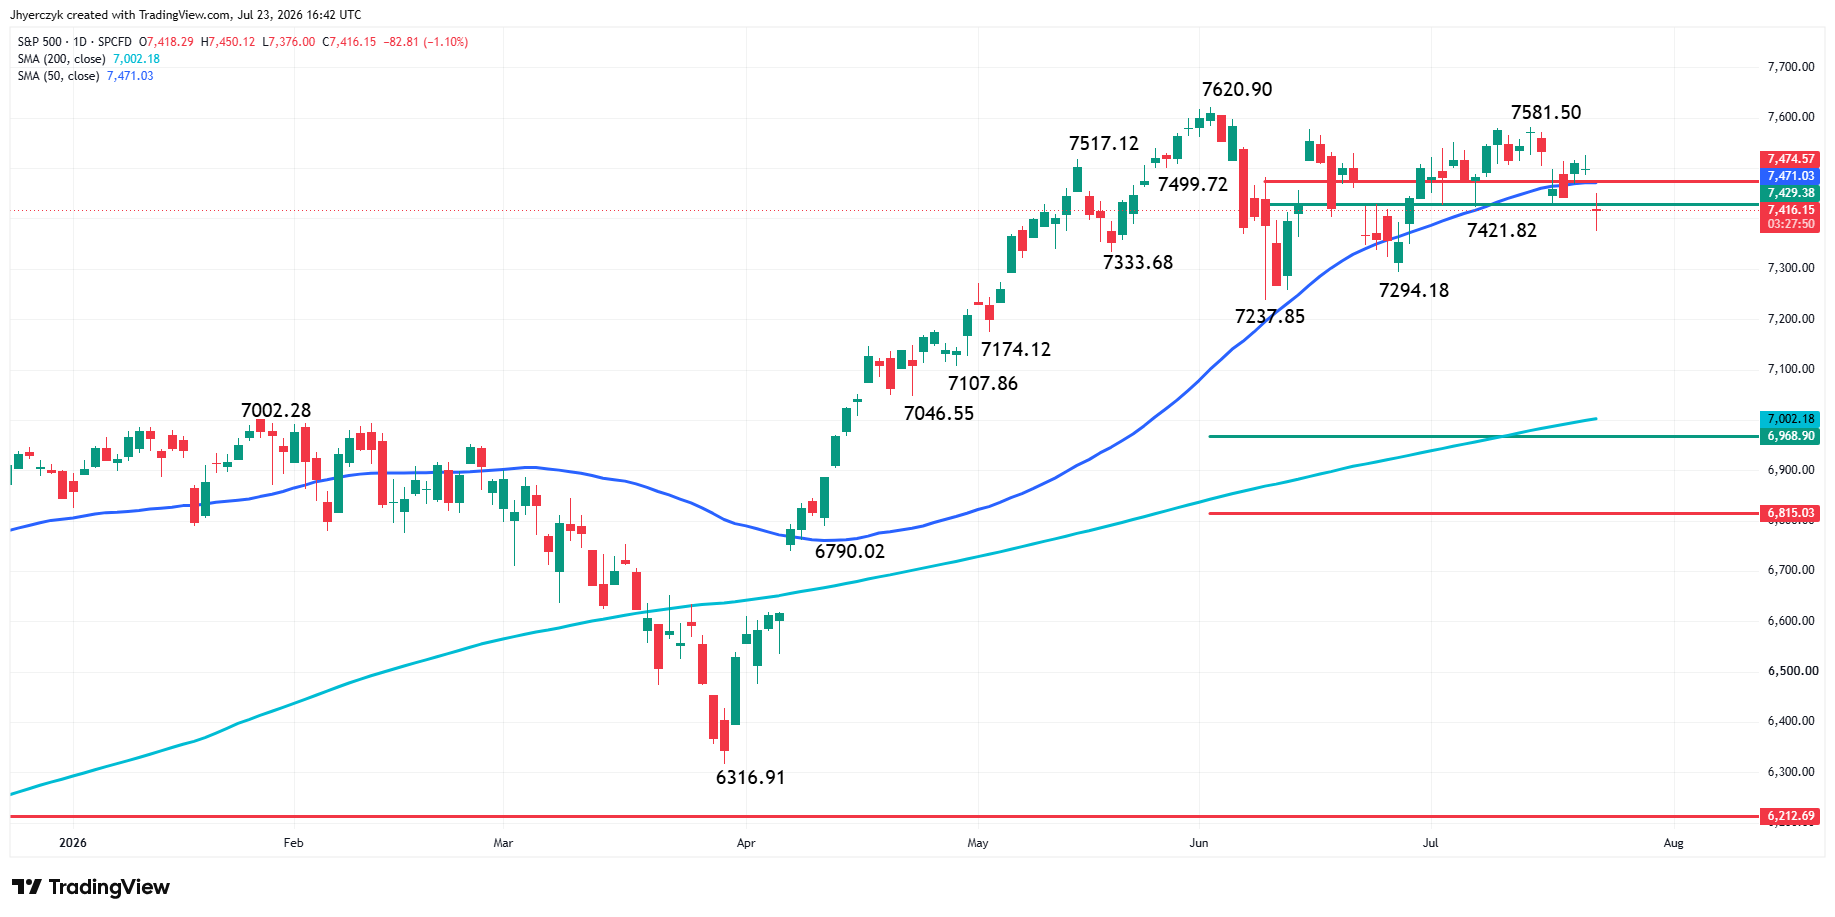
The benchmark S&P 500 Index is lower at the mid-session on Thursday. The index was in a weak position from the start. It opened below the 50-day moving average at 7470.88, the anchor that had been propping up the market for months. Today, it also crossed to the weak side of a short-term retracement zone at 7429.38 to 7474.57.
If this retracement zone becomes resistance then investors may grow frustrated trying to buy momentum and may turn toward looking for value. The potential value area that I see on the chart is a long-term retracement zone at 6968.90 to 6815.03. The 200-day moving average at 7002.14 could also become a potential target.
What to Watch
Friday’s flash PMI report is the next economic test and the reaction depends on which direction it cuts. A strong reading keeps the rate argument alive and adds to the pressure on growth stocks. A weak reading may help yields ease but it opens a different problem if the market starts pricing a slowdown on top of an inflation shock.
Oil is still running the show. Any sign that tanker traffic is recovering through the Red Sea or that the conflict is easing takes pressure off crude and gives stocks room to stabilize. Twelve consecutive nights of U.S. strikes on Iran and no ceasefire in sight says that relief is not close.
The S&P 500 broke below its 50-day average on Thursday and is now trading on the weak side of the short-term retracement zone that had been holding the market up for weeks. If that zone flips to resistance, traders start looking at the long-term retracement area and the 200-day average well below current levels, which is a very different conversation from where this market was a week ago. The VIX spiked above both of its moving averages but one day does not make it a trend. The indicator needs to hold above those levels before the demand for protection becomes something sellers have to take seriously.
More Information in our Economic Calendar.