
This week has been another great reminder that technical levels matter.
Across multiple markets, the key support and resistance zones we’ve been tracking continue to dictate price action. Some markets have already delivered the scenarios we outlined, while others are approaching major decision points that could determine the next meaningful move.
As always, don’t focus on the intraday noise. Watch how price reacts around the key levels because that’s where the next opportunities are likely to emerge.

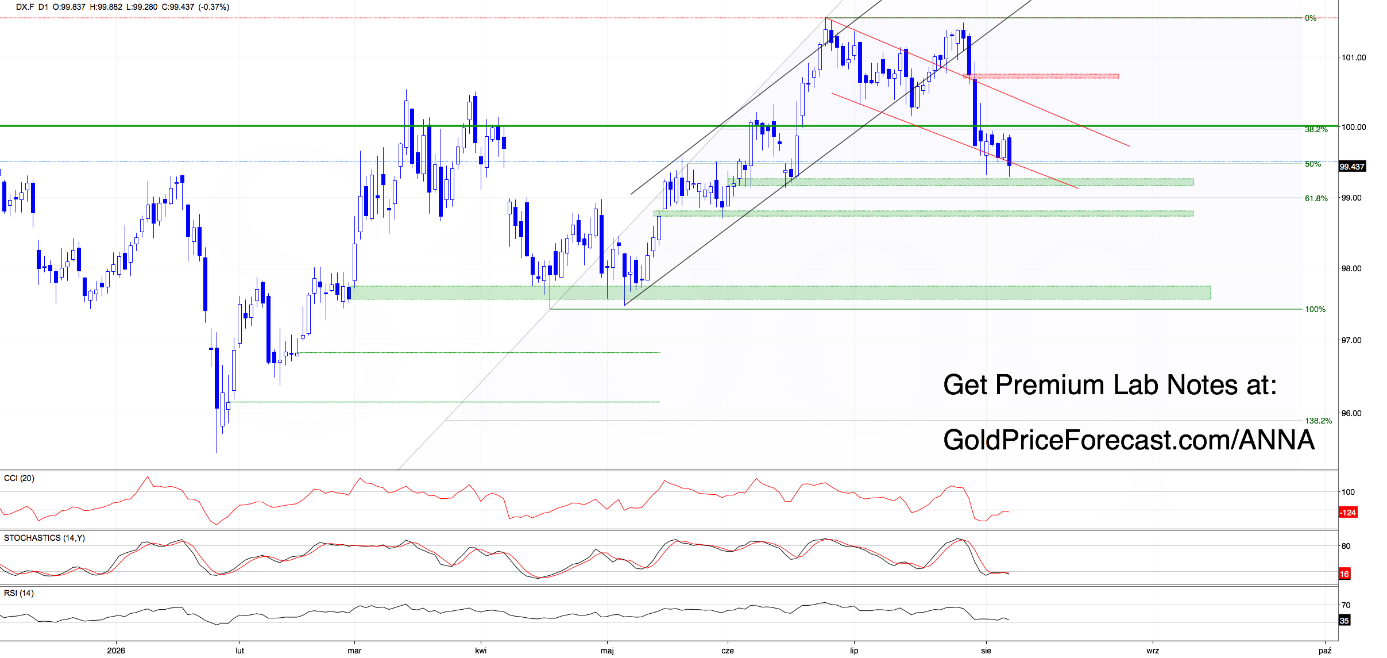
U.S. Dollar Index (DX.F) chart: price trades below the 100 level as key Fibonacci and channel support come into focus.
Let’s begin with a quote from our previous Lab:
“(…) our broader outlook remains unchanged.
Only an invalidation of the earlier breakdown below this key level would confirm that buyers have regained control and are ready to challenge higher prices.
Until then, sellers continue to hold the technical advantage, especially with momentum indicators still failing to generate fresh buy signals.(…)”
From today’s perspective, we can see that despite buyers’ efforts, Thursday’s session once again closed below the psychological 100 level. That allowed sellers to regain control and successfully retest the support zone we discussed yesterday.
The result?
The U.S. dollar has once again slipped below both the 50% Fibonacci retracement and the lower boundary of the red declining channel, printing another local low.
Gold Price Forecast
Every new Gold analysis as it publishes, today's technical signal and key levels, live price — on one page.
See all Gold forecastsSo, what comes next?
A lot depends on today’s daily close.
Why?
Because it will likely determine the direction of next week’s move.
If buyers show the same determination we saw on Monday and manage to close today’s session back above both the 50% Fibonacci retracement and the lower boundary of the red declining channel, they’ll invalidate the developing bearish engulfing pattern and reopen the door for another attempt to reclaim the 100 level early next week.
However, if sellers stay in control, we should prepare for at least a test of the bullish gap from early June (99.18-99.26), which successfully stopped the bears in mid-June, or even a move toward the 61.8% Fibonacci retracement around 99.00.
Connecting the dots: today’s close will likely be the key to Monday’s trading session.
Gold
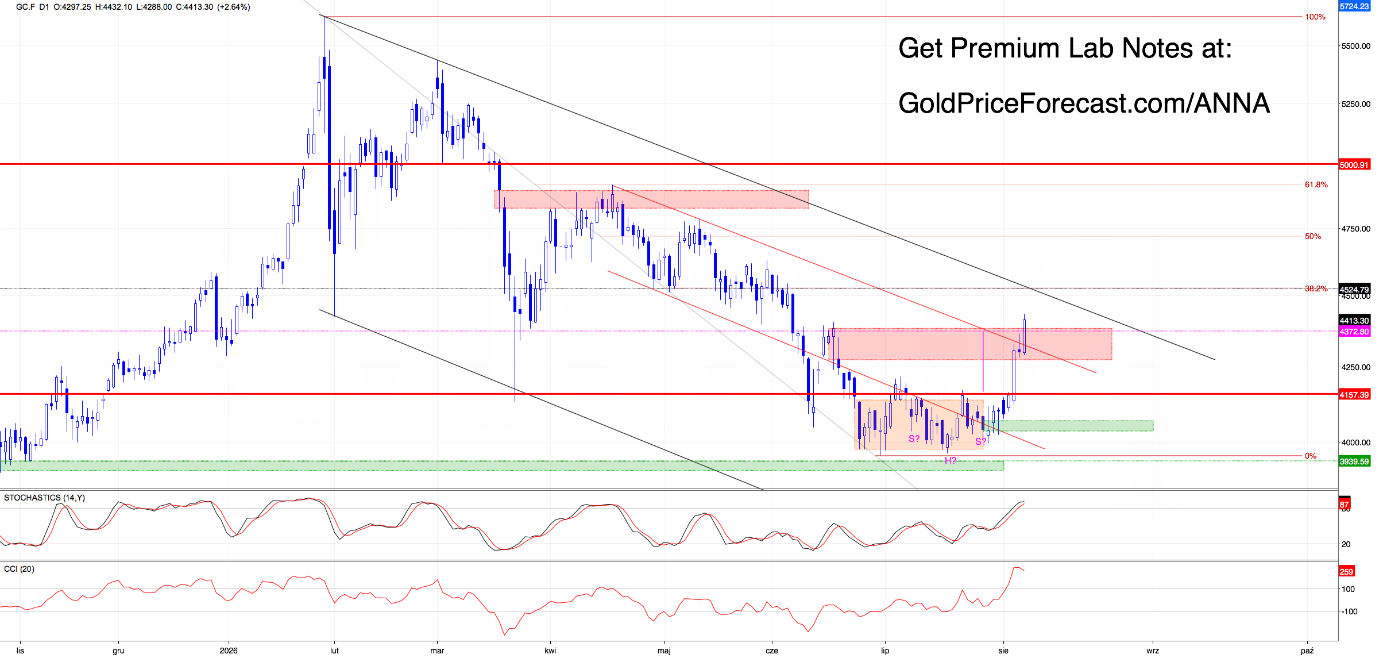
Gold futures (GC.F) chart: buyers reclaim the declining channel, with 4,375-4,381 the key barrier before 4,500-4,525.
Looking at today’s chart, we can see that despite yesterday’s pullback following the unsuccessful attempt to break above the upper boundary of the red declining channel, buyers quickly regained control and pushed the market higher once again.
The result?
Gold not only climbed back above the red declining channel, but also reached our previously discussed upside target based on the inverse head & shoulders pattern (congratulations to everyone who stayed with the bullish scenario and benefited from the move!).
So, what comes next?
If buyers manage to close both today’s session and the entire week above 4381 – confirming the close above the major bearish gap – our next upside target from yesterday’s Lab will likely become their next destination:
“(…)The next upside target remains 4372, followed by the major bearish gap between 4375-4381, which continues to represent the final technical barrier before a potential move toward 4500-4525.
Momentum indicators remain on the buyers’ side, increasing the probability of further strength – especially if today’s session closes above the red declining channel. (…)”
What could slow the bulls down?
An invalidation of the earlier breakout above the red declining channel.
Copper
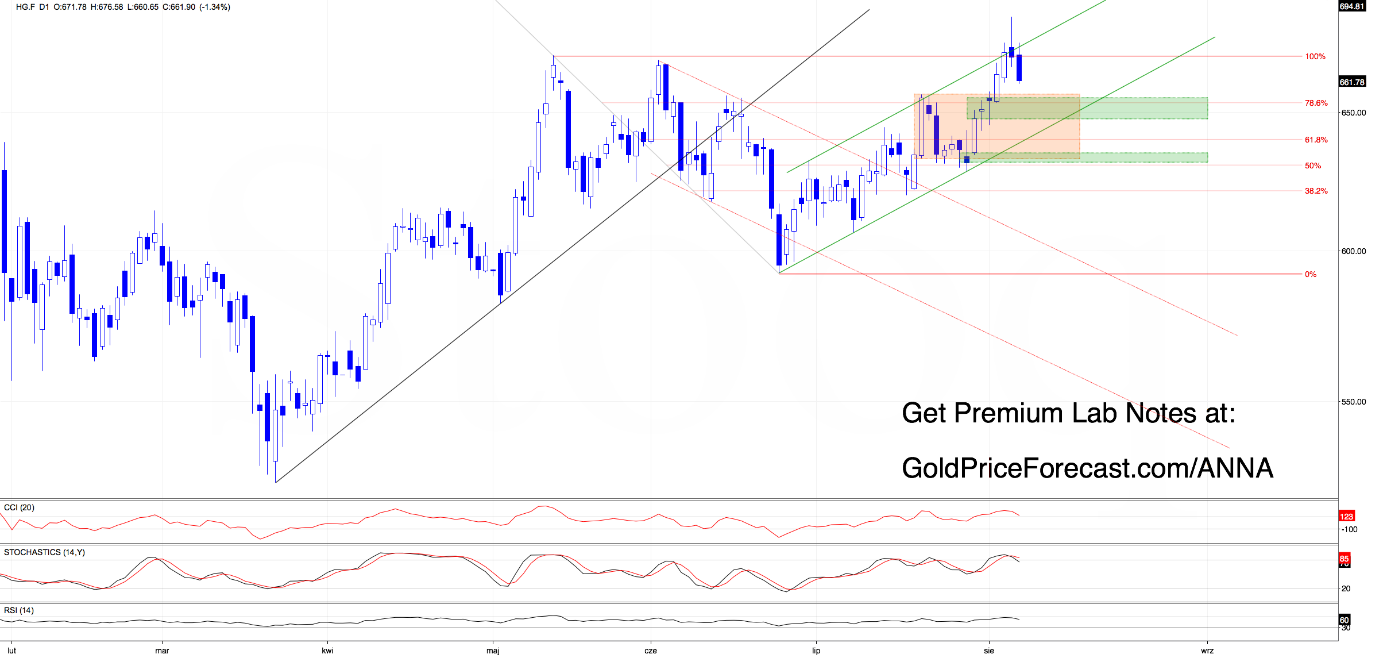
Copper futures (HG.F) chart: the failed breakout shifts attention to 656 support and the 651-655/647-650 zones below.
Yesterday’s quote sets the tone for today – so let’s start there:
“(…) Nevertheless, please keep in mind that a daily close below 669 would be the first signal that a deeper correction may be starting. (…)”
Looking at today’s chart, we can see that despite yesterday’s rally and a new all-time high, buyers failed to hold prices above 669, with the session closing at 670.
As a result, we saw an invalidation of the earlier breakout above the previous highs and above the upper boundary of the green ascending channel, giving sellers fresh technical arguments.
The result?
Copper extended its correction, suggesting that we could see a test of the previously broken upper boundary of the orange consolidation around 656.
If buyers fail to defend that area, sellers may shift their focus toward the nearest bullish gaps at 651-655 and 647-650, which together now create the nearest support zone.
Today’s Takeaways
Dollar (DX.F)
- Watch today’s daily close – it will likely set the tone for Monday.
- A close back above the 50% Fibonacci retracement and the lower boundary of the red declining channel would invalidate the developing bearish engulfing pattern.
- If sellers stay in control, watch the 99.18-99.26 bullish gap, followed by the 61.8% Fibonacci retracement around 99.00.
Gold (GC.F)
- Buyers have already reached our previously discussed upside target.
- Watch the 4375-4381 bearish gap.
- A weekly close above 4381 keeps the door open toward 4500-4525.
- An invalidation of the breakout above the red declining channel would weaken the bullish outlook.
Copper (HG.F)
- Buyers lost the breakout above the previous highs and the green ascending channel.
- Watch 656 first.
- Below that, the next support zone comes in at 651-655 and 647-650.
Stay patient, respect the levels, and let the market show its hand before committing fresh risk. Have a wonderful weekend!
Anna