Tesla
Tesla looks like it is going to try to keep most of the gains from the previous session. It’s down ever so slightly in pre-market trading, but remaining elevated is a good sign. It shows that it continues to have at least some support at this point.

The $350 Level
I’ll be watching the $350 level. It’s where we turned around from previously, and it is a level that’s been important in the past. Clearing that would be a huge victory, but right now, it looks like we have a little bit of a dogfight on our hands. The 50-day EMA racing towards that area will be important as well, but we have bounced pretty significantly over the last couple of weeks.
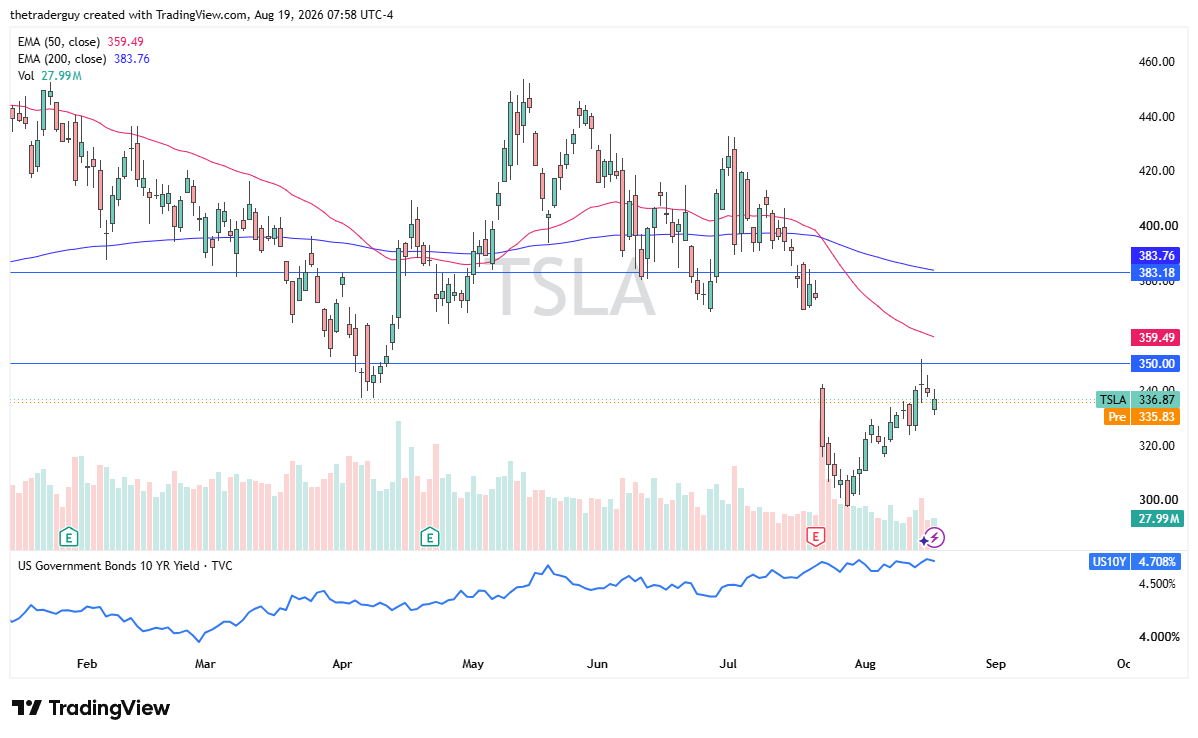
Tesla daily chart shows the rebound approaching $350 resistance and the 50-day EMA. Source: TradingView.
Amazon
The market for Amazon looks like it is ever so slightly positive, and this is a market that shot straight up in the air and has since pulled back from that big earnings beat. Right now testing the 50% Fibonacci retracement level; that’s a good sign for technical traders as well, and we have the 50-day EMA just below there, so that in and of itself might attract a certain amount of attention also.
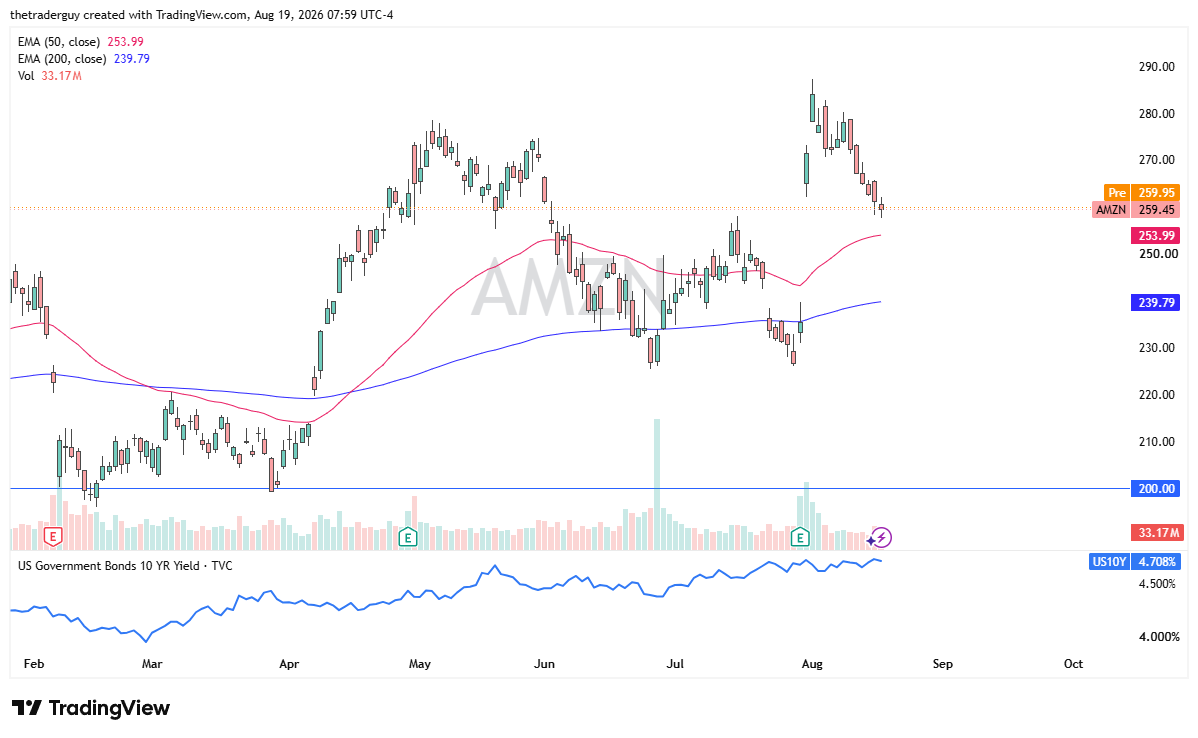
Amazon daily chart shows price testing Fibonacci support with the 50-day EMA below. Source: TradingView.
Apple
Apple looks like it’s fighting back. We had a little bit of a double bottom here at the $300 level play out, and in pre-market trading, it’s slightly positive. So, after that really bad reaction to some comments during the earnings call, it looks like we have stabilized just above $300, and now there might be value hunting.
A Double Bottom Trying to Prove Itself
This is a market that had been in a pretty strong uptrend, and part of what’s going on here is there seems to be a lot of speculation on Wall Street about Apple and Nvidia or some other tech giant working together. I’ve seen a couple of stories about this, how they may get into the AI race as well. It’ll be interesting to see how that plays out, but from a technical analysis standpoint, this looks like a double bottom that’s trying to prove itself correct.
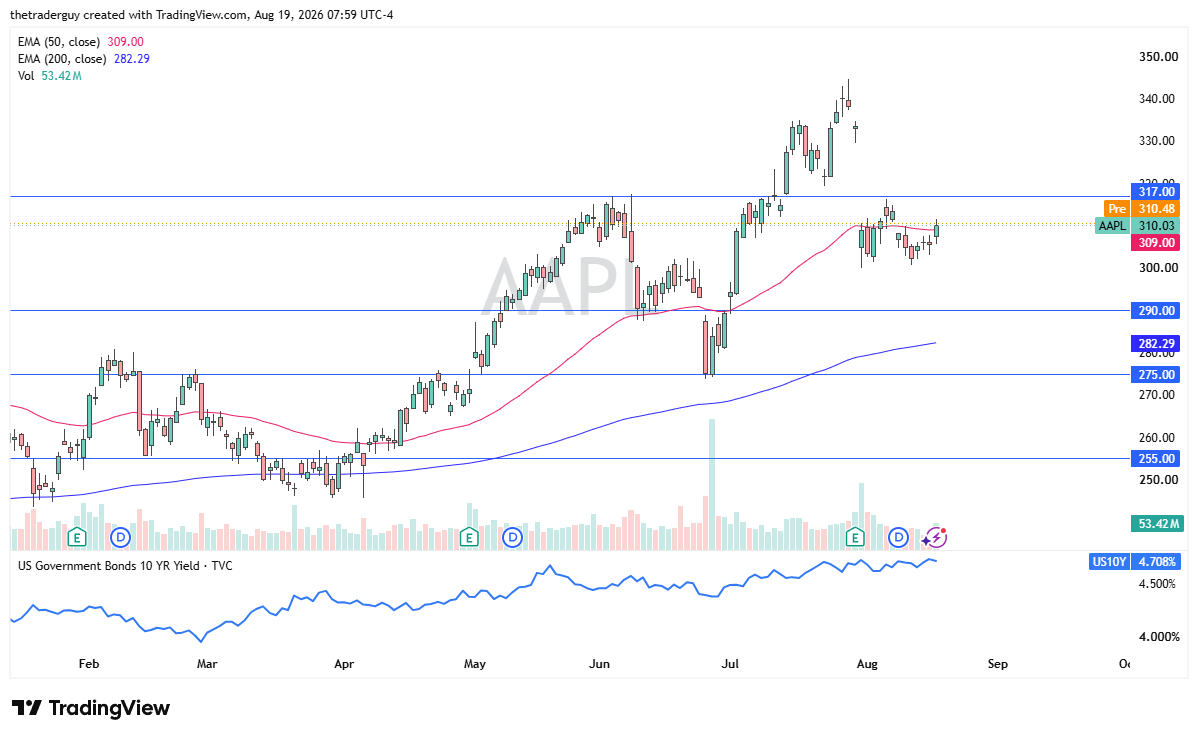
Apple daily chart shows stabilization above $300 as a potential double bottom develops. Source: TradingView.