



AUD/USD is still holding a bullish medium term structure, but there’s a bearish move forming in the short term. This could be attributed to the narrowing of the Australia-US yield spread to 38 bps. But I’m not ready to flip bearish yet, but the Aussie needs to stabilize quickly.

Heat Map Shows Broad Aussie Weakness
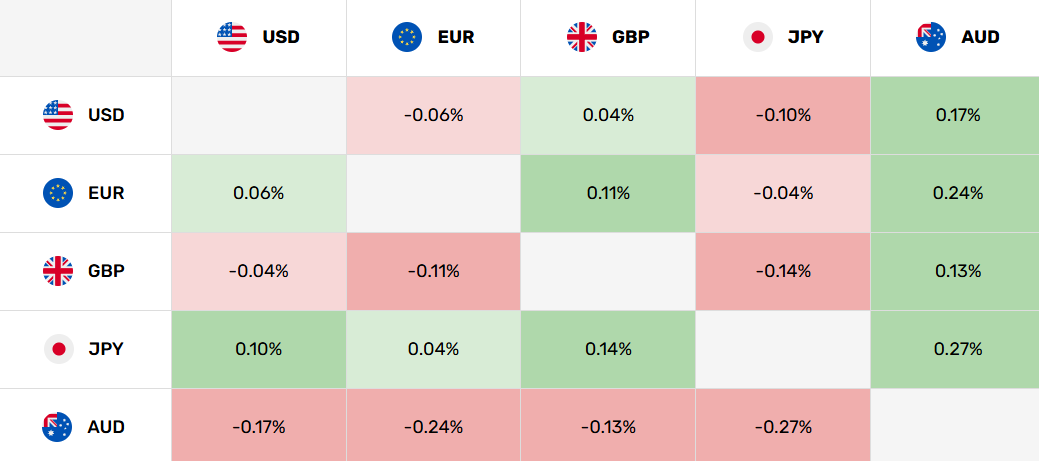
During today’s session AUD/USD is down 0.17% which is accompanied by broader Aussie weakness. AUD/EUR is down 0.24%, AUD/GBP is down 0.13% and AUD/JPY is down 0.27%. There needs to be some stability for the Aussie as the continued deterioration is negatively impacting my bias on the FX cross.
Yield Spread Tightens
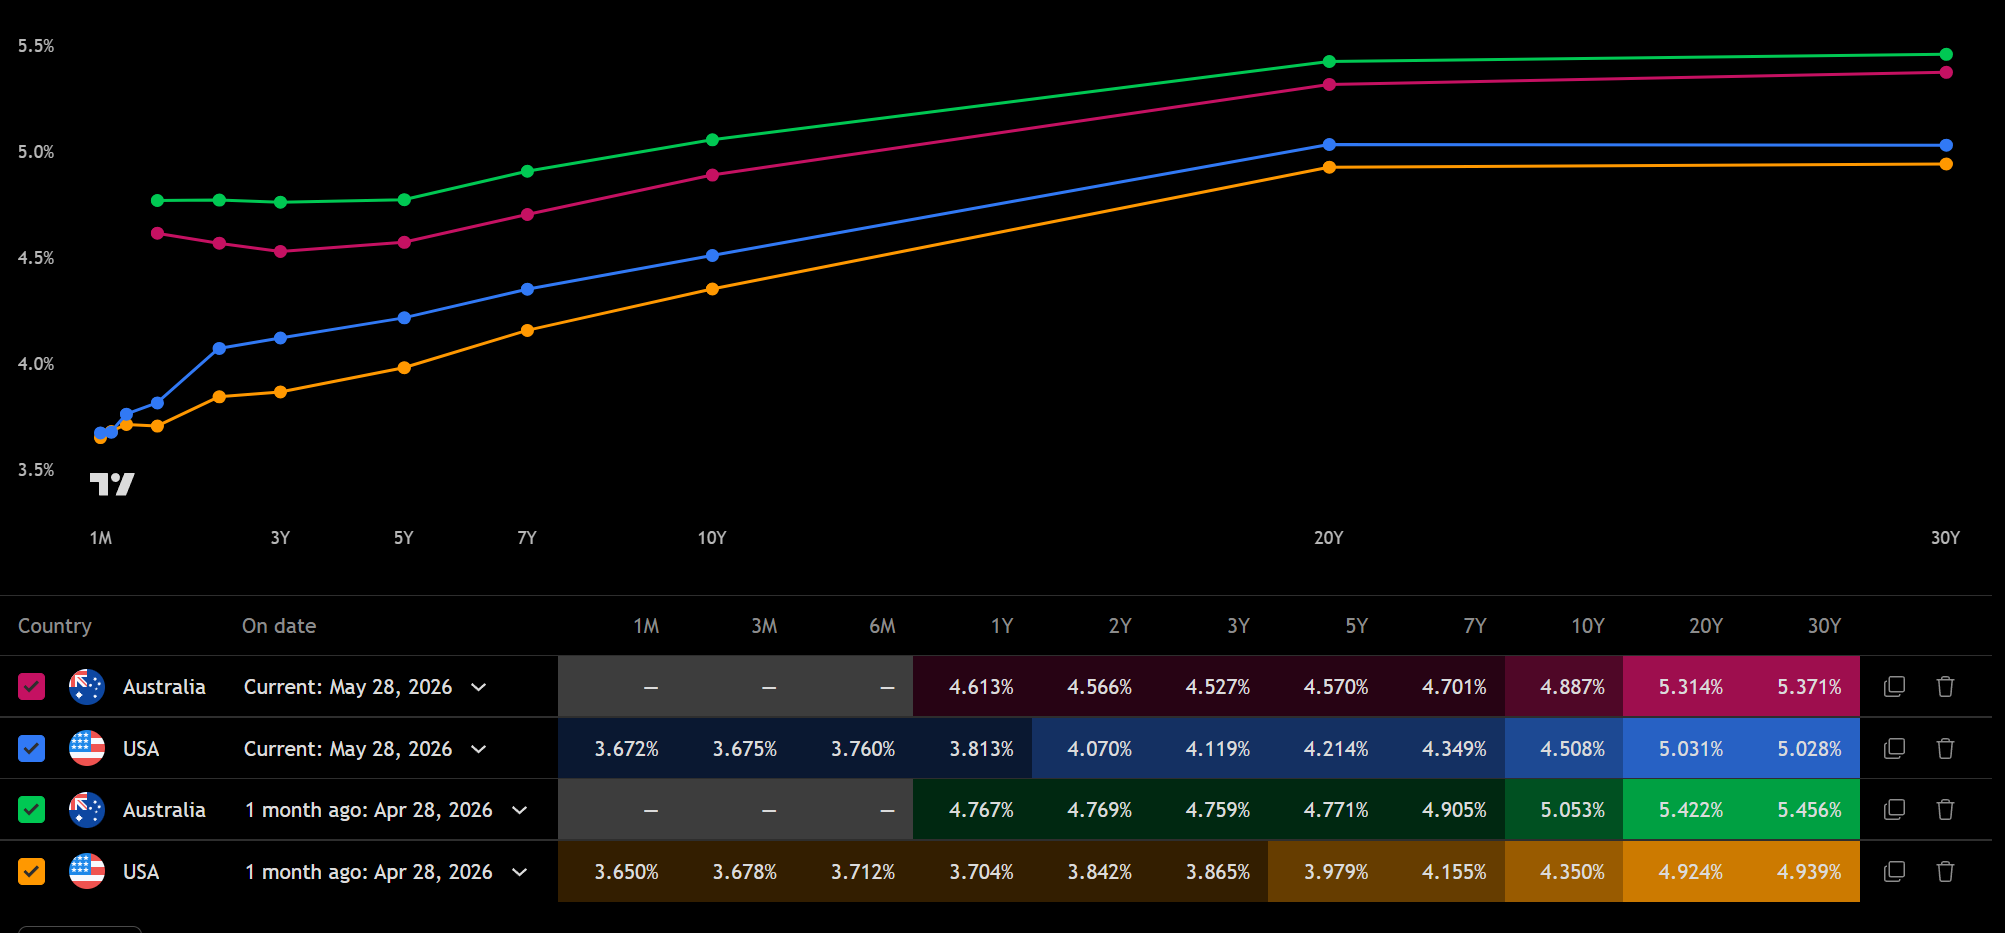
Australia’s 10-year yield is around 4.887%, while the US 10-year is currently yielding 4.508%, giving Australia the obvious premium. That’s where the carry really comes from. But spreads have been narrowing. The spread dropped from 70 bps to 38 bps, an over 30 bps move within a month. That’s alot. No wonder there’s weakness in AUD/USD.
AUD/JPY Shows Risk Appetite Is Fading
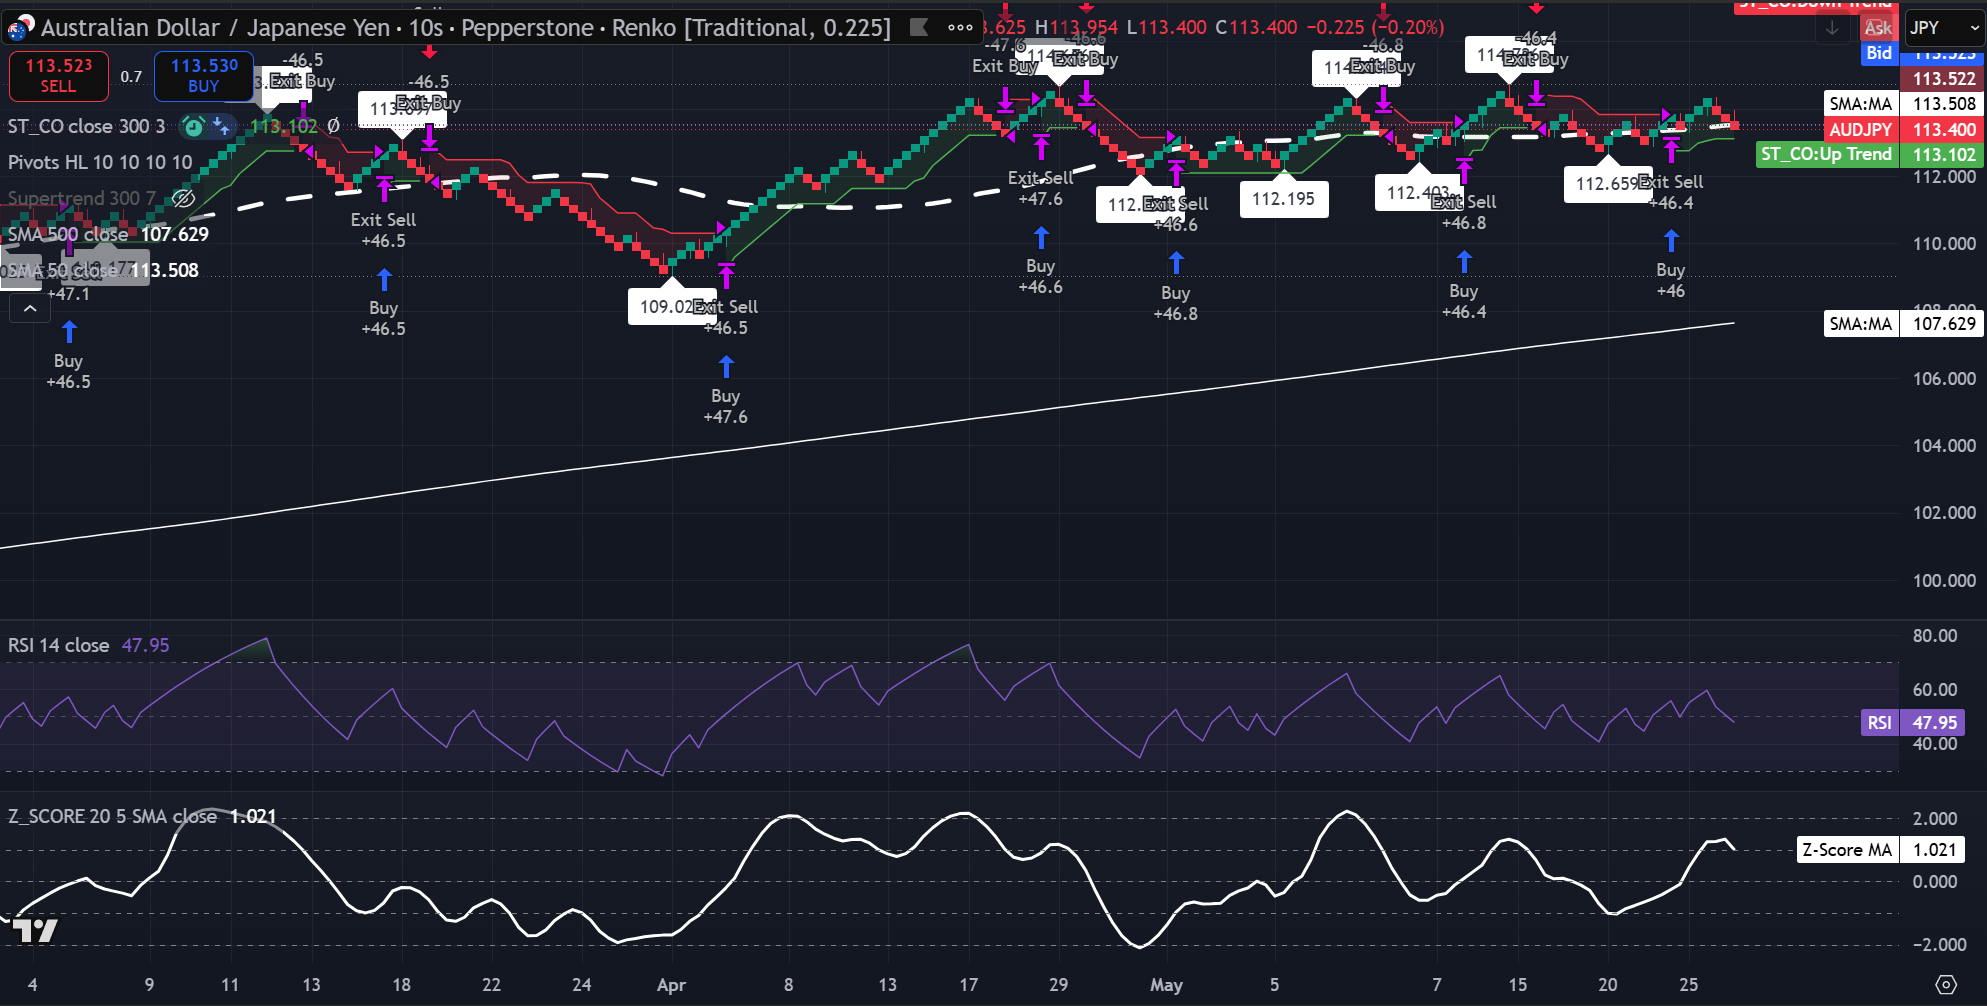
Momentum is surely slowing for AUD/JPY. While the medium and long term trend is still bullish, the FX Cross is sitting on its 50-SMA with a red brick. The RSI has crossed under 50 and is trending lower along with the Z-Score SMA which has also turned lower.
AUD/JPY Holds But Momentum Cools
AUD/USD Renko Tests The Bulls
AUD/USD is bouncing between the 50-SMA and the Supertrend line on the Renko chart and is currently nearing the Supertrend line, having posted 3 red bricks. The RSI is below 50 and trending lower while the Z-Score SMA has turned lower as well. This isn’t looking good for the FX Cross, if it breaks below the Supertrend the only support really remaining is the 500-SMA, which is currently around the 0.6856 level.
AUD/USD Renko Pullback Tests 0.71015
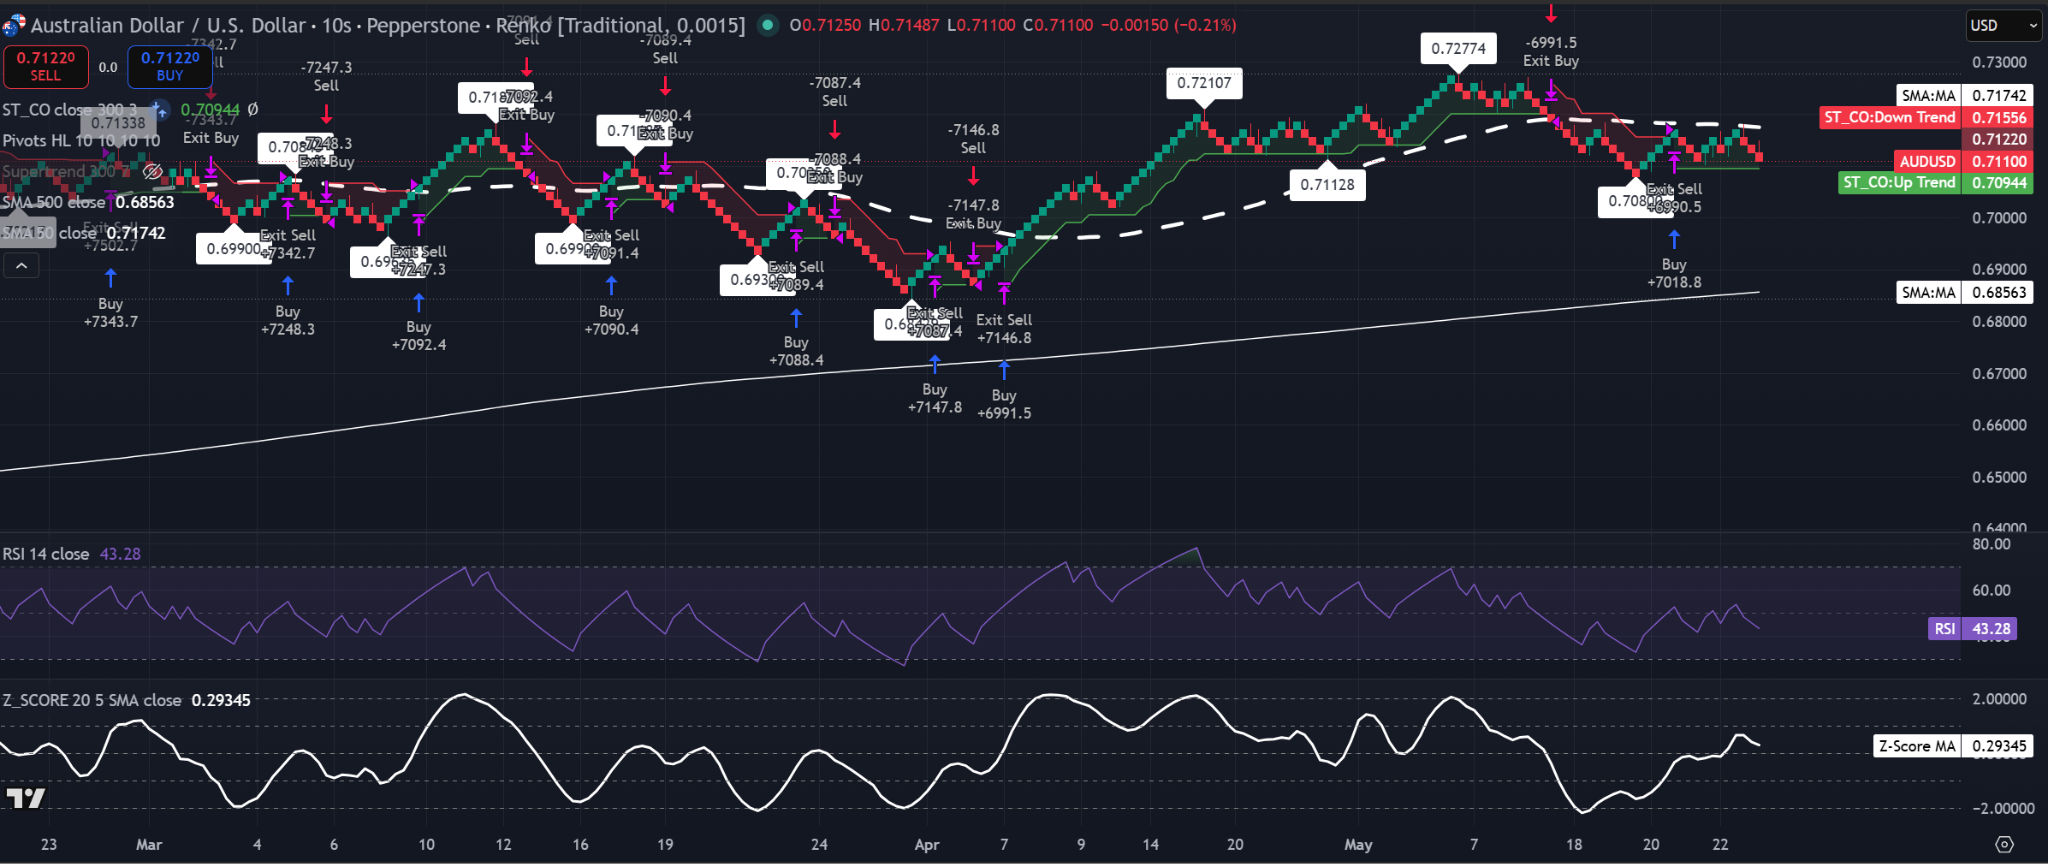
Support Levels: 0.6833,0.71015,0.70720
Resistance Levels: 0.72715, 0.74070
Medium Term Path: I’ll hold the medium to long term bullish view with the positive bias. Short term pullbacks are all part of bull runs that’s why traders and analysts need to identify certain triggers to determine whether the asset is in an uptrend or downtrend over the multiple timeframes that they monitor. In my case I look at a weekly timeframe via the Supertrend lines and once those lines are broken at the end of the week, it leads me to change my view on the direction of an asset, in this case, AUD/USD. As such, I will maintain my bullish view with a positive bias in the medium term for AUD/USD.



