Key Insights:
- On Tuesday, bitcoin (BTC) rose by 0.21% to consolidate Monday’s 7.69% rally and end the day at $31,782.
- A choppy end to the month saw bitcoin revisit $32,000 levels with a day high of $32,367 before easing back.
- Bitcoin (BTC) technical indicators flash green, with bitcoin sitting above the 100-day EMA.
On Tuesday, bitcoin (BTC) rose by 0.21%. Following a 7.69% rally on Monday, bitcoin ended May down by 15.6% to $31,782.
A choppy session saw bitcoin fall to a day low of $31,203 before finding support. Steering clear of the day’s Major Support Levels, bitcoin rallied to a day high of $32,367 before easing back.
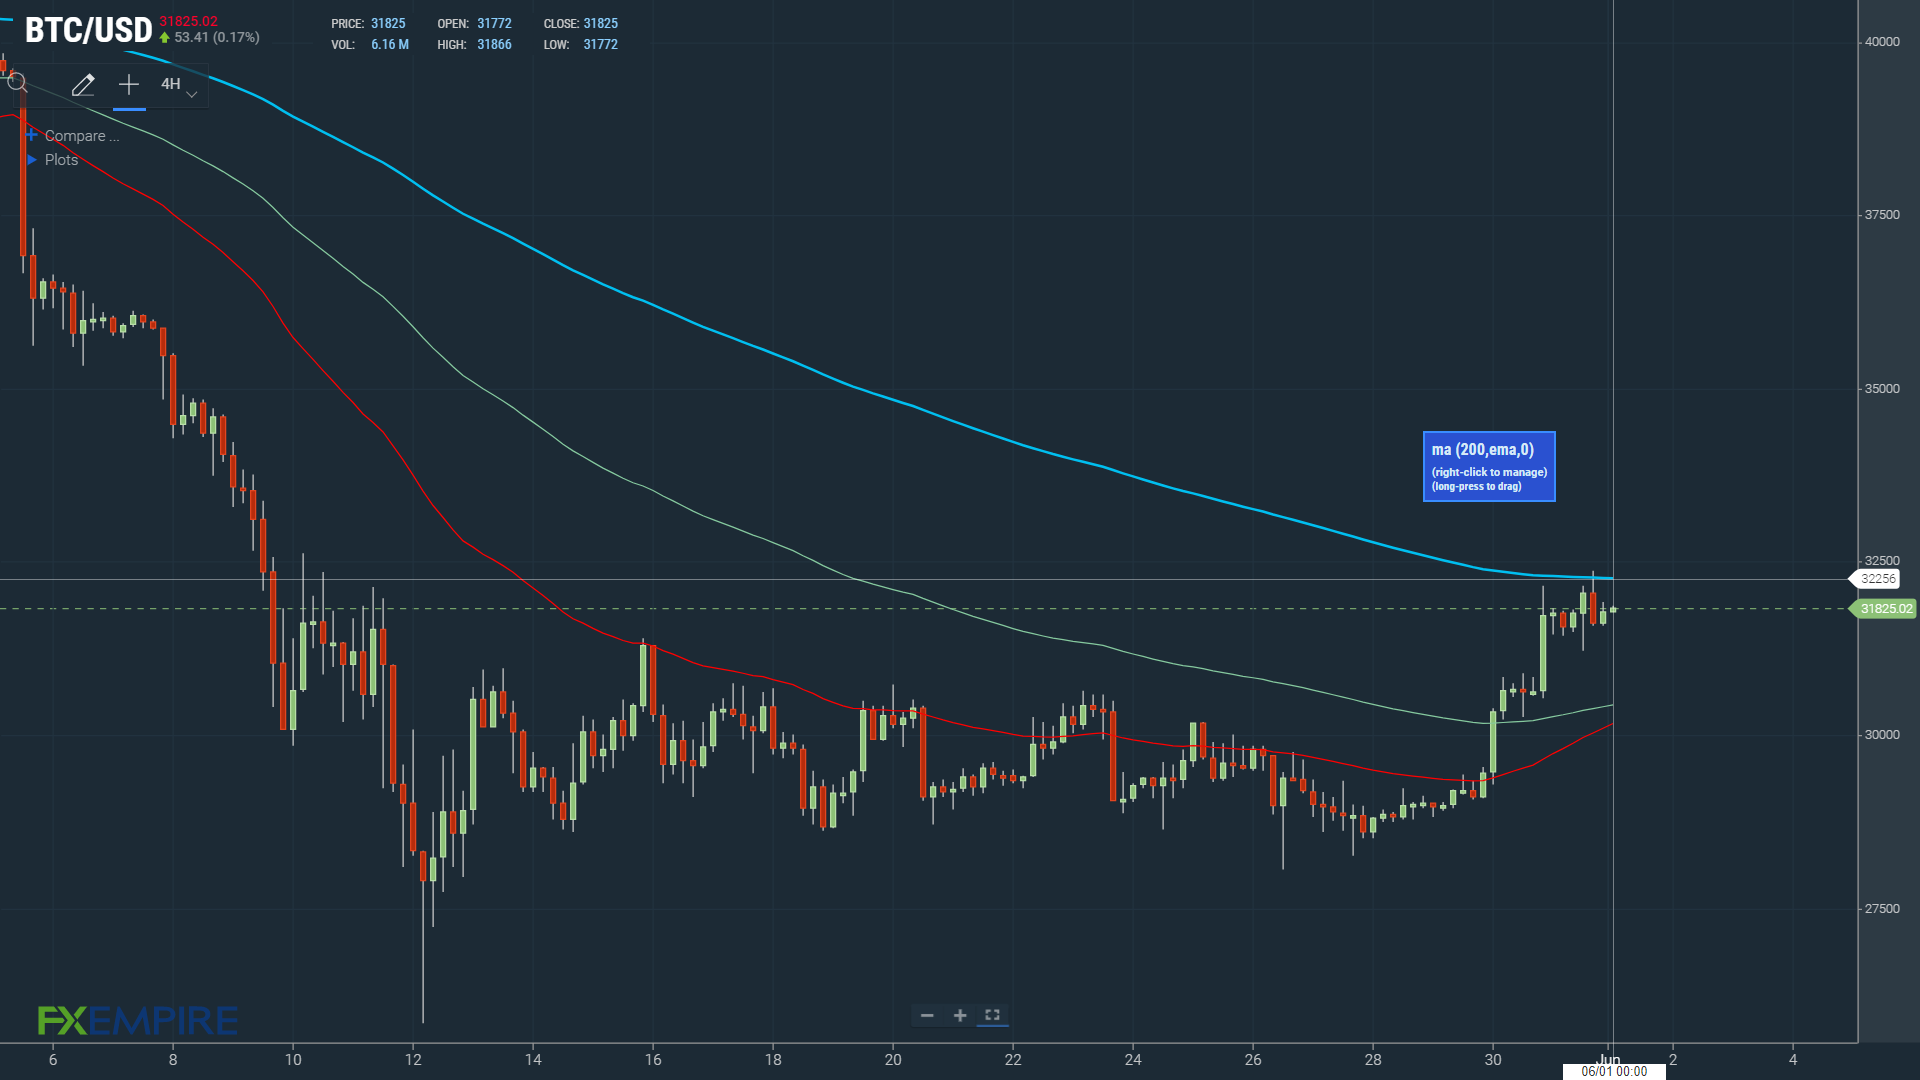
While falling short of the First Major Resistance Level at $32,821, bitcoin tested resistance at the 200-day EMA.
An increase in the Fear & Greed Index delivered support, while inflation fears and regulatory uncertainty remained crypto market negatives.

The Bitcoin Fear & Greed Index Hits Reverse Again
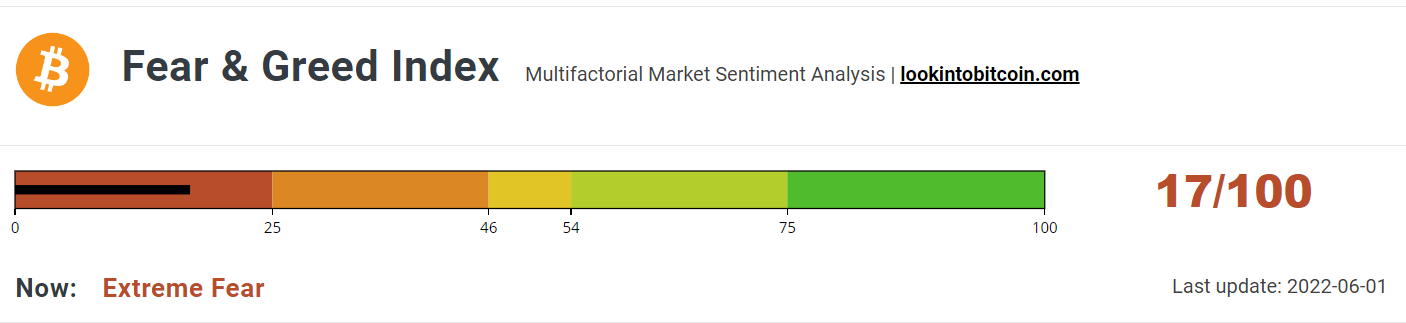
Today, the Fear & Greed Index rose from 16/100 to 17/100, its highest level since a May 8 value of 18/100.
Despite the upswing, the Index remains deep in the “Extreme Fear” zone. A move through to 25/100 and into the “Fear” zone would reflect a shift in investor sentiment.
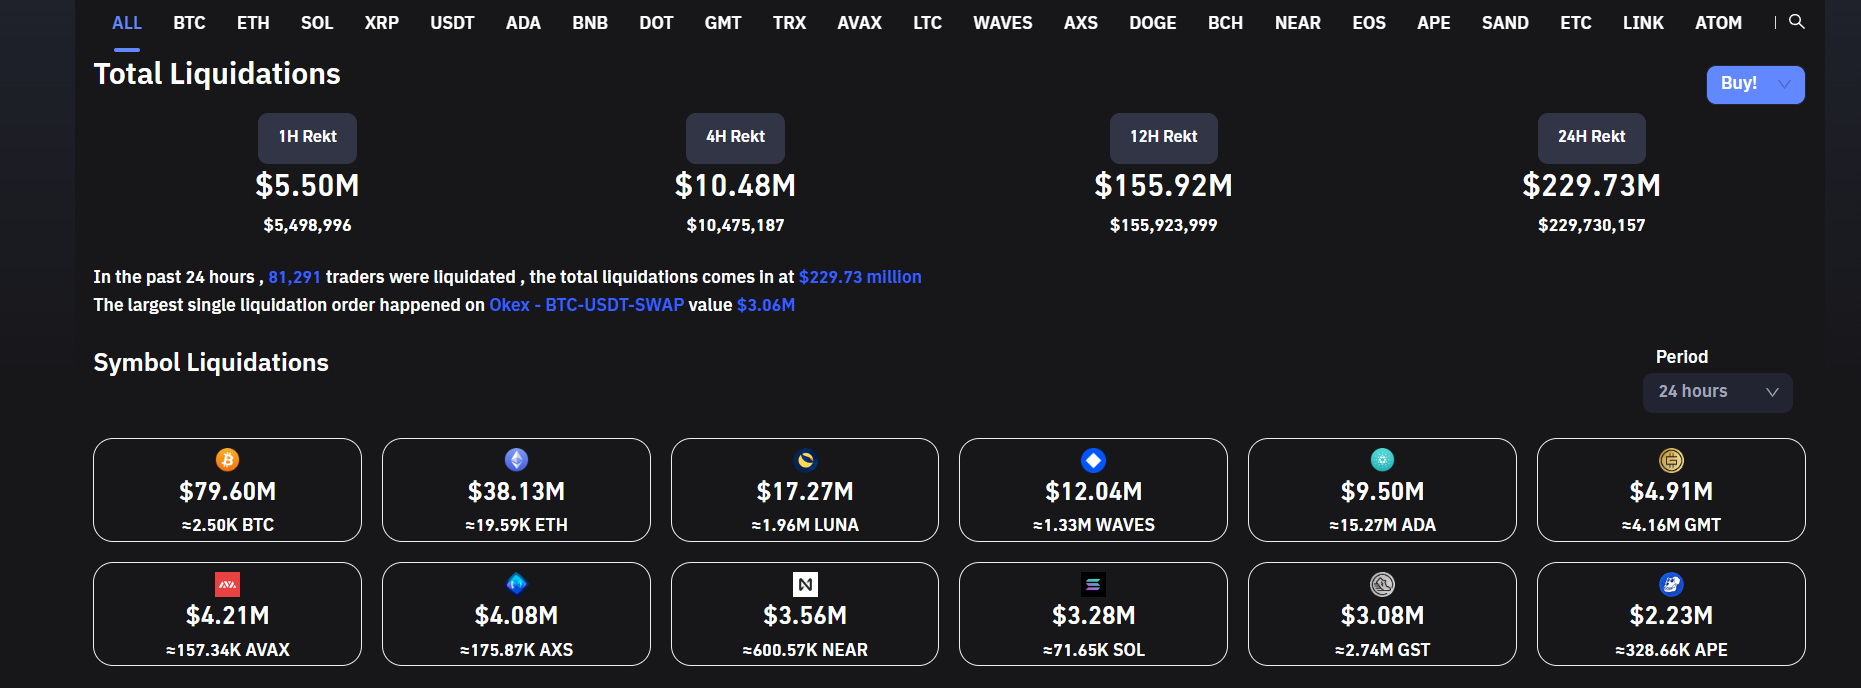
Looking at the crypto liquidations, 24-hour liquidations fell back from $350 million levels.
At the time of writing, 24-hour liquidations stood at $229.73 million, according to Coinglass.
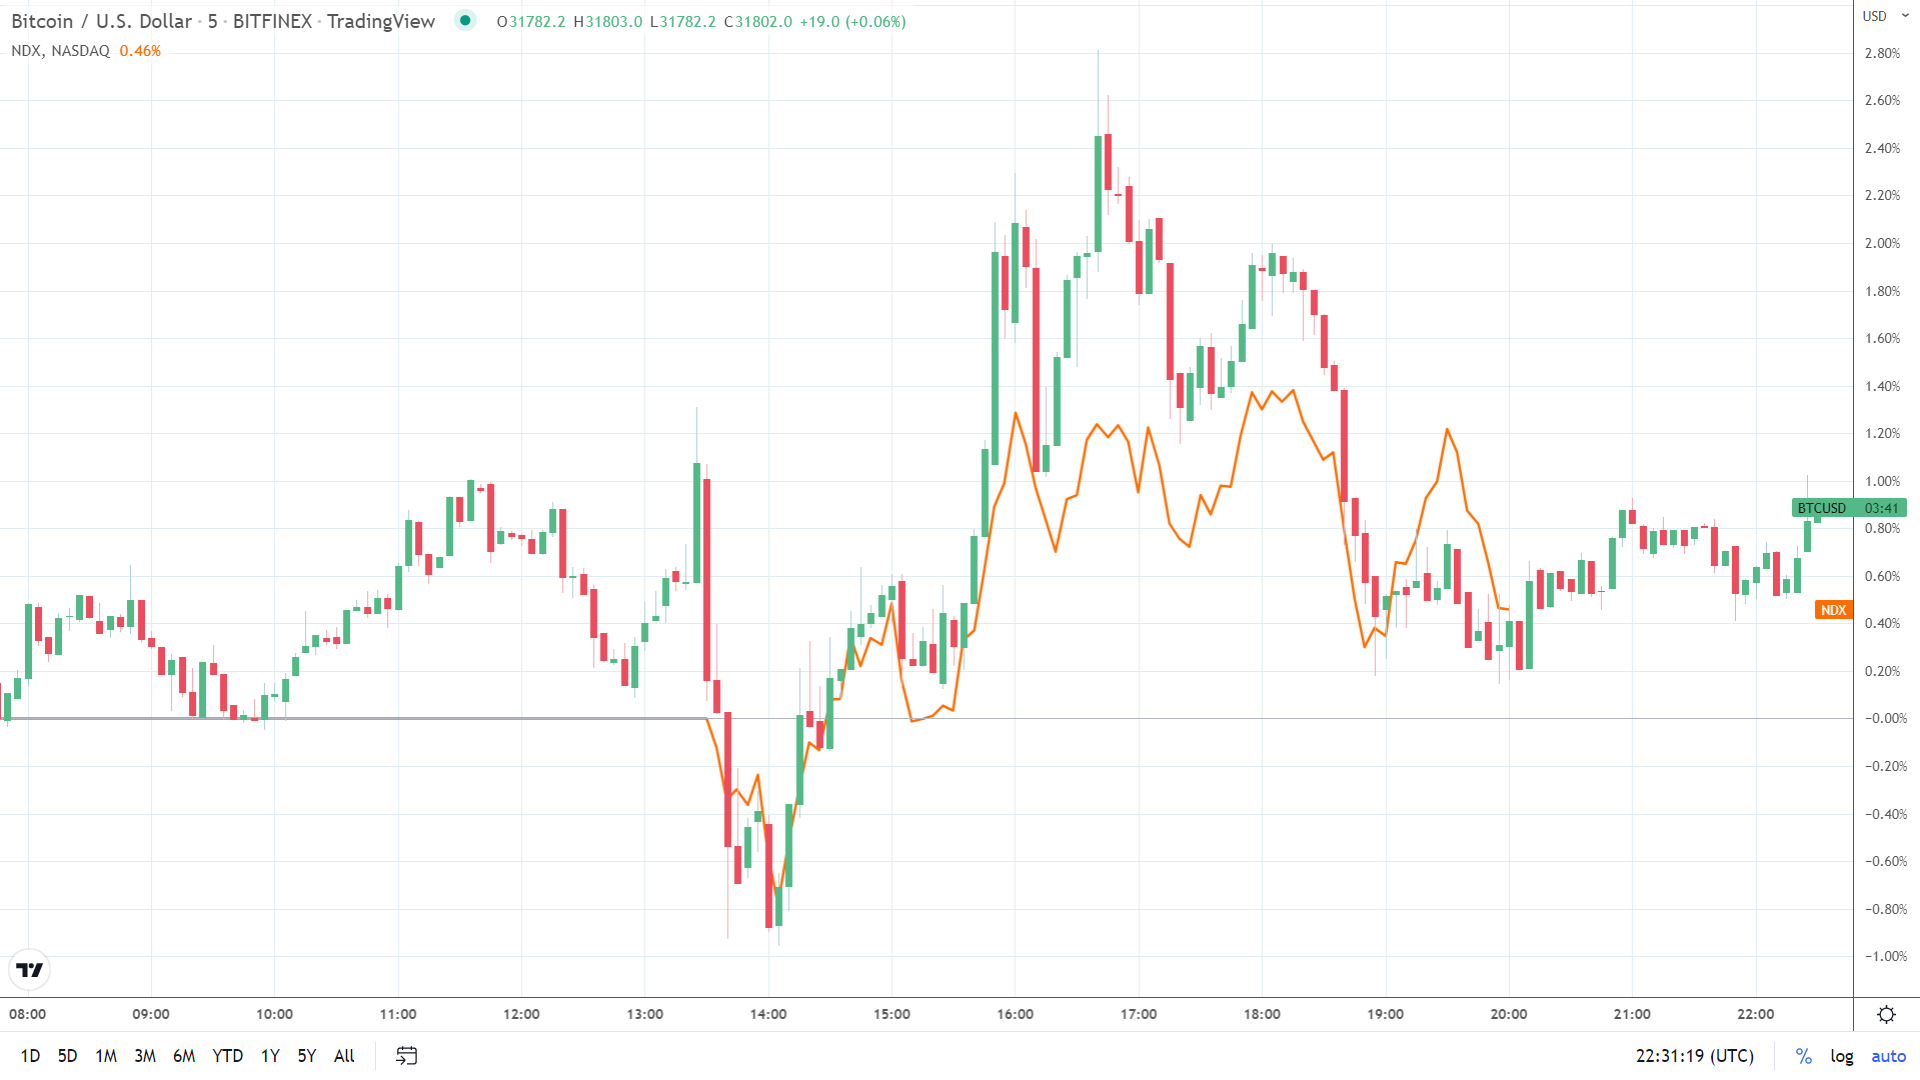
While the Fear & Greed Index and liquidation numbers delivered support, movement across the US equity markets tested investor sentiment.
Bitcoin tracked the NASDAQ 100 through the day before finding late support to mark a fourth consecutive daily rise.
The NASDAQ 100 ended the day with a modest 0.41% loss.
Bitcoin Price Forecast
Every new Bitcoin analysis as it publishes, today's technical signal and key levels, live price — on one page.
See all Bitcoin forecastsBitcoin (BTC) Price Action
At the time of writing, BTC was 0.12% to $31,820.
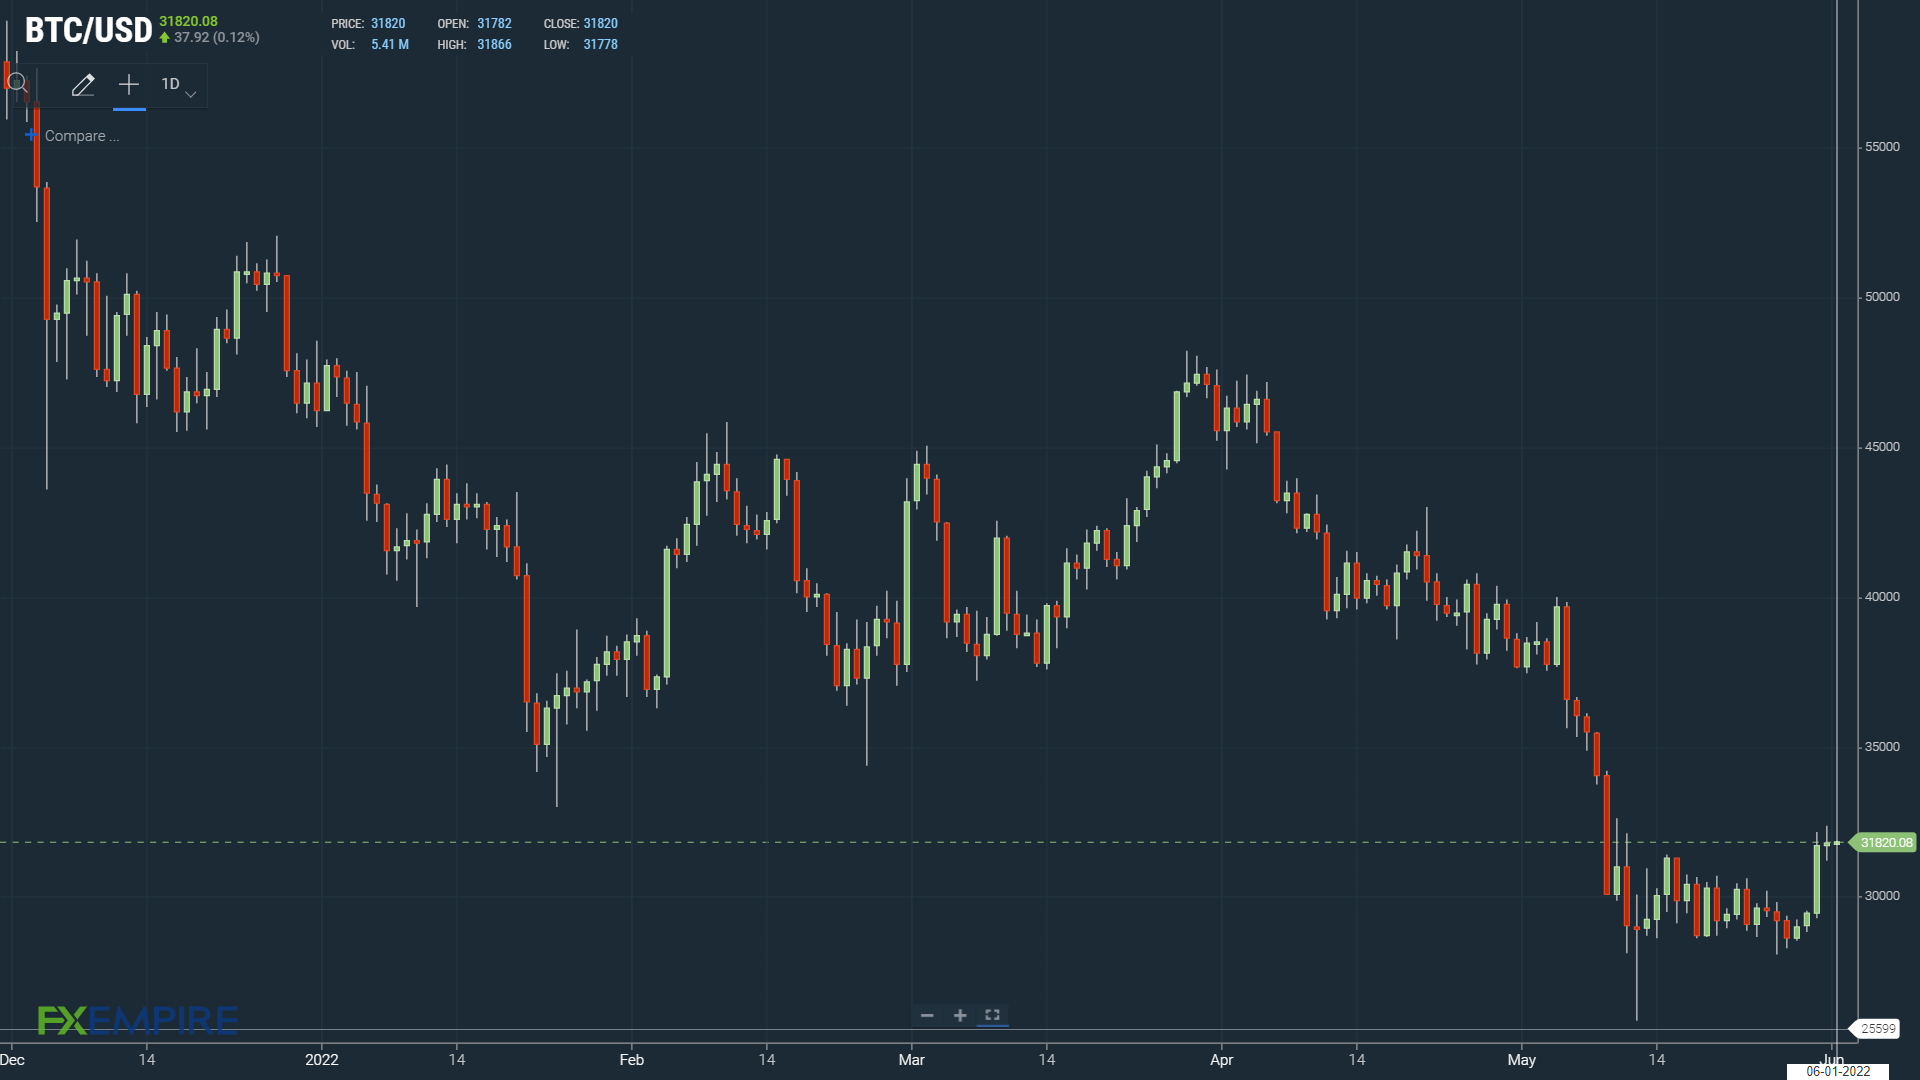
Technical Indicators
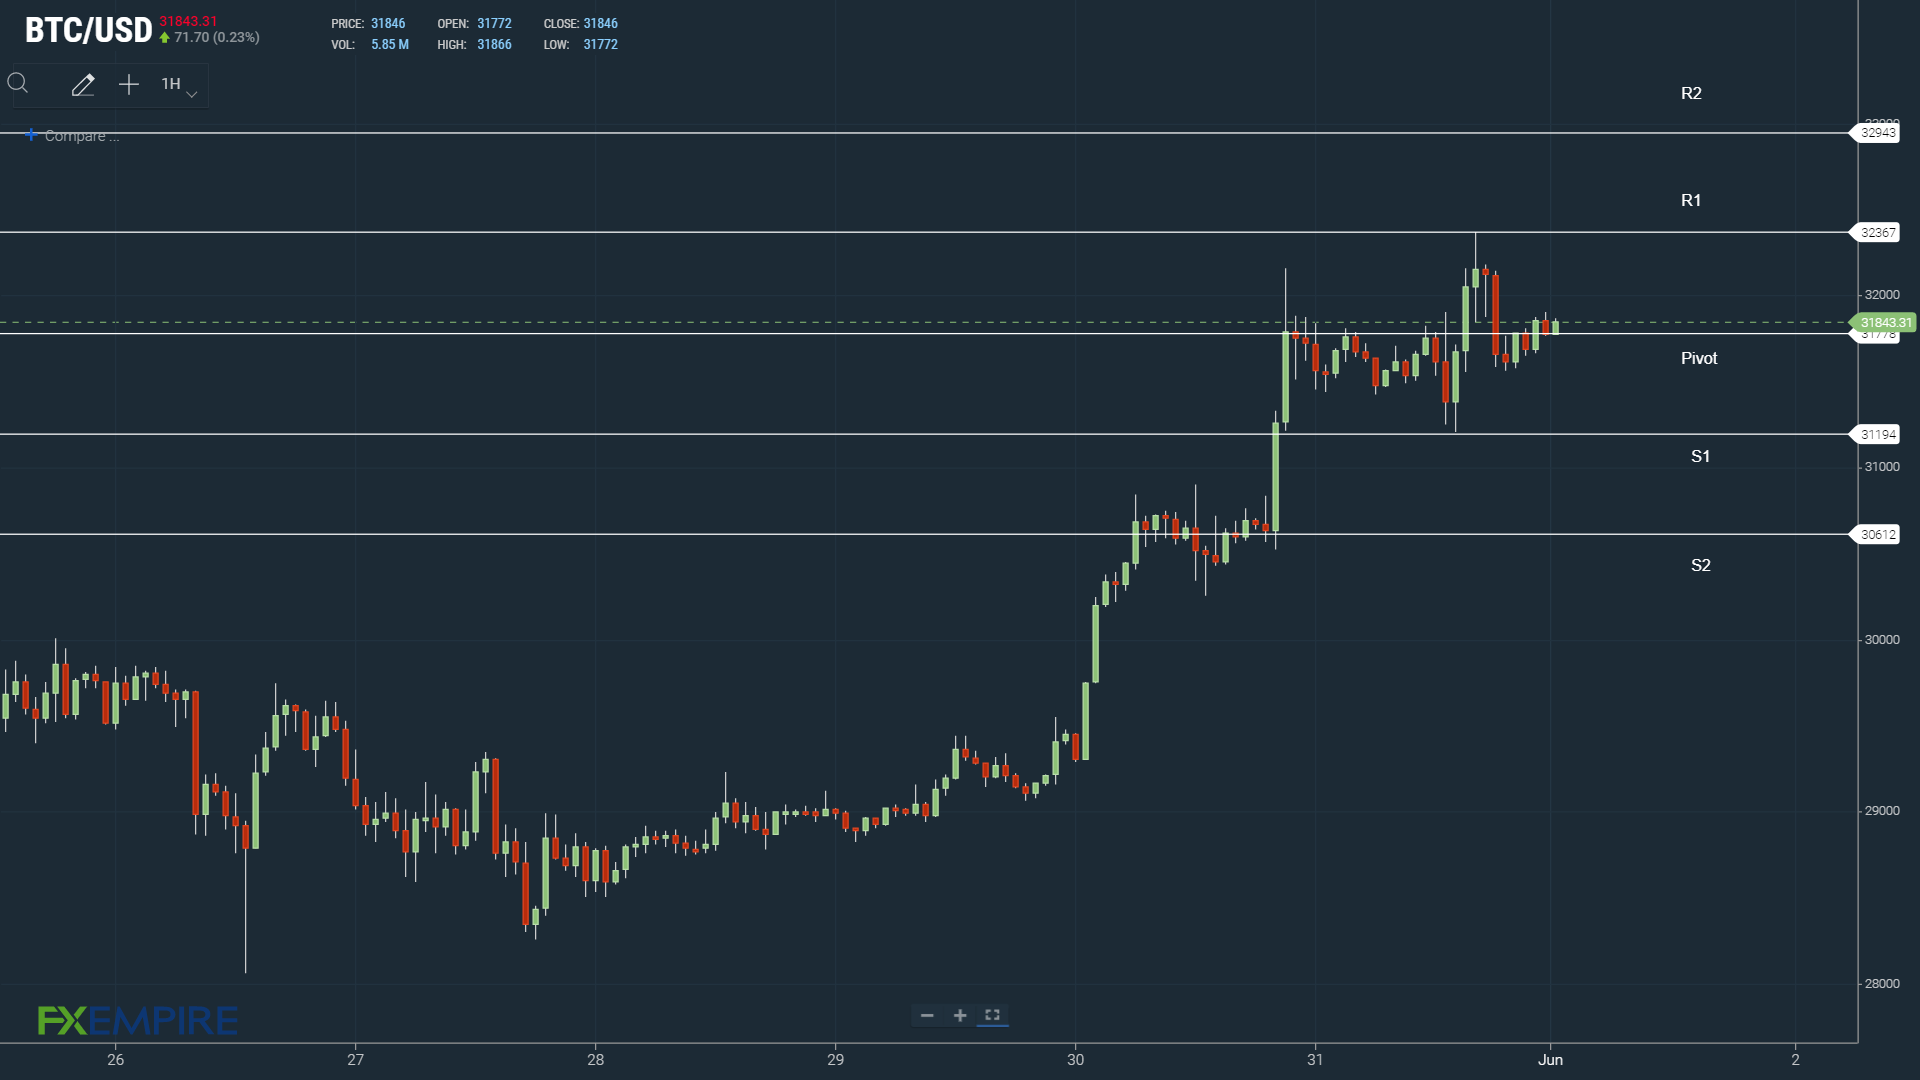
BTC will need to avoid the $31,778 pivot to target the First Major Resistance Level at $32,367.
BTC would need the broader crypto market to support a return to $32,000.
An extended rally would test the Second Major Resistance Level at $32,943 and resistance at $33,500. The Third Major Resistance Level sits at $34,112.
A fall through the pivot would test the First Major Support Level at $31,194. Barring an extended sell-off, BTC should steer clear of sub-$30,500 levels. The Second Major Support Level at $30,612 should limit the downside.
Looking at the EMAs and the 4-hourly candlestick chart (below), it is a bullish signal. Bitcoin sits above the 100-day EMA, currently at $30,468. The 50-day narrowed to the 100-day EMA. The 100-day EMA closed in on the 200-day EMA, BTC positive.
A bullish cross of the 50-day EMA through the 100-day EMA would support a run at $35,000.