Bitcoin (BTC) is flashing a cautionary on-chain signal despite its price rebounding by nearly 15% to over $94,400 in April.

Sharp Drop in Bitcoin Demand Akin to 2021, 2022 Bear Markets
On April 29, the cryptocurrency’s 30-day Demand Momentum plunged to -483,860 BTC, according to on-chain data platform CryptoQuant. Meanwhile, its 30-day moving average (SMA) was at -310,700 BTC.
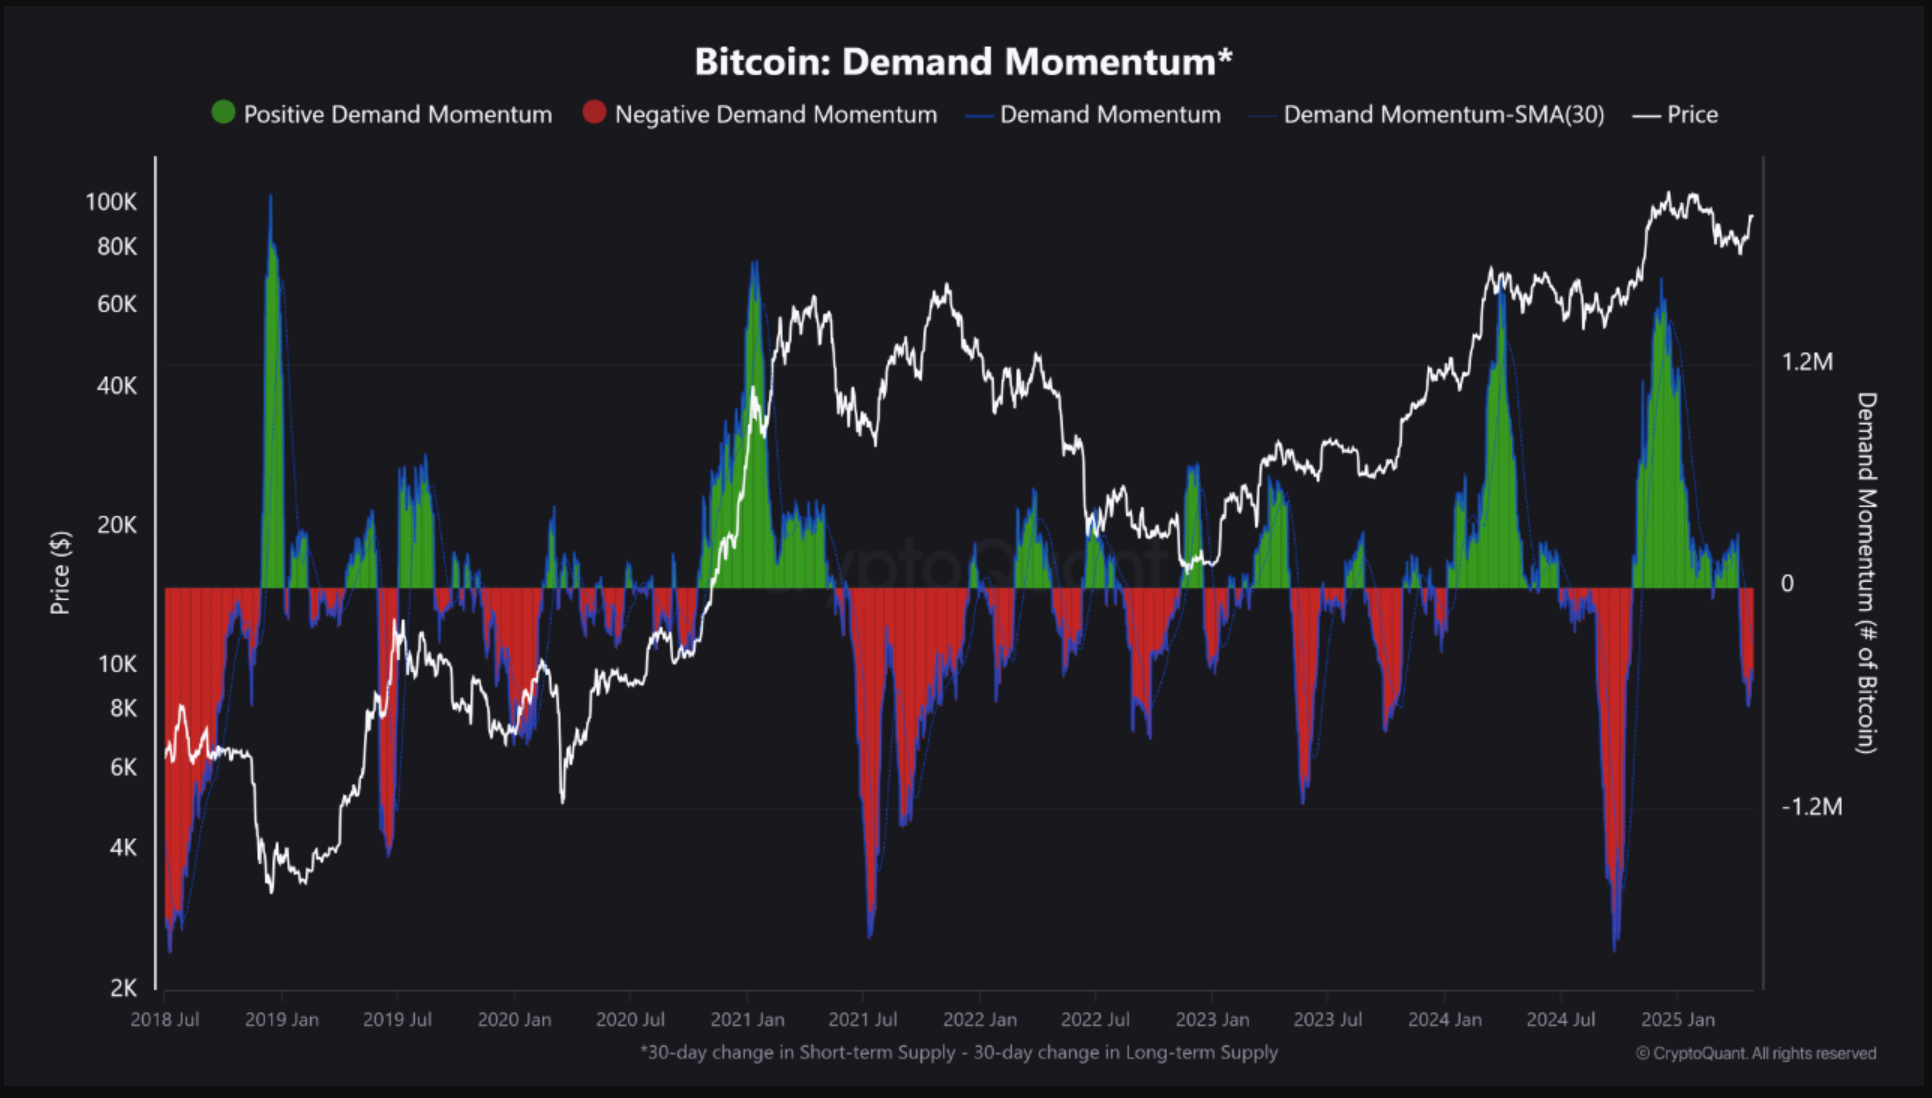
The metric, defined as the 30-day change in short-term holder supply minus the 30-day change in long-term holder supply, is a proxy for speculative activity versus committed accumulation.
When short-term supply rises faster than long-term holdings, it reflects a market leaning toward distribution rather than accumulation—a pattern often seen near market tops or during broader consolidations.
In other words, these metrics indicate a sharp drop in net demand.
This deep red zone isn’t without precedent.
Bitcoin saw similar extended negative demand momentum in mid-2021 and Q2 2022. Both episodes occurred just before major corrections, with BTC retracing significantly in their aftermath.
Conversely, when the momentum began to recover and flipped positive, Bitcoin established durable market bottoms and resumed bullish trends.
Fractal comparisons suggest that Bitcoin may be in a similar late-stage distribution or macro consolidation phase. The current setup mirrors previous cycles where demand exhaustion led to pullbacks before renewed accumulation restarted the uptrend.
Unless we see a clear flip back to positive demand momentum, indicating stronger long-term holder conviction and reduced speculative churn, Bitcoin’s rally risks losing structural support.
Bitcoin Price Forecast
Every new Bitcoin analysis as it publishes, today's technical signal and key levels, live price — on one page.
See all Bitcoin forecasts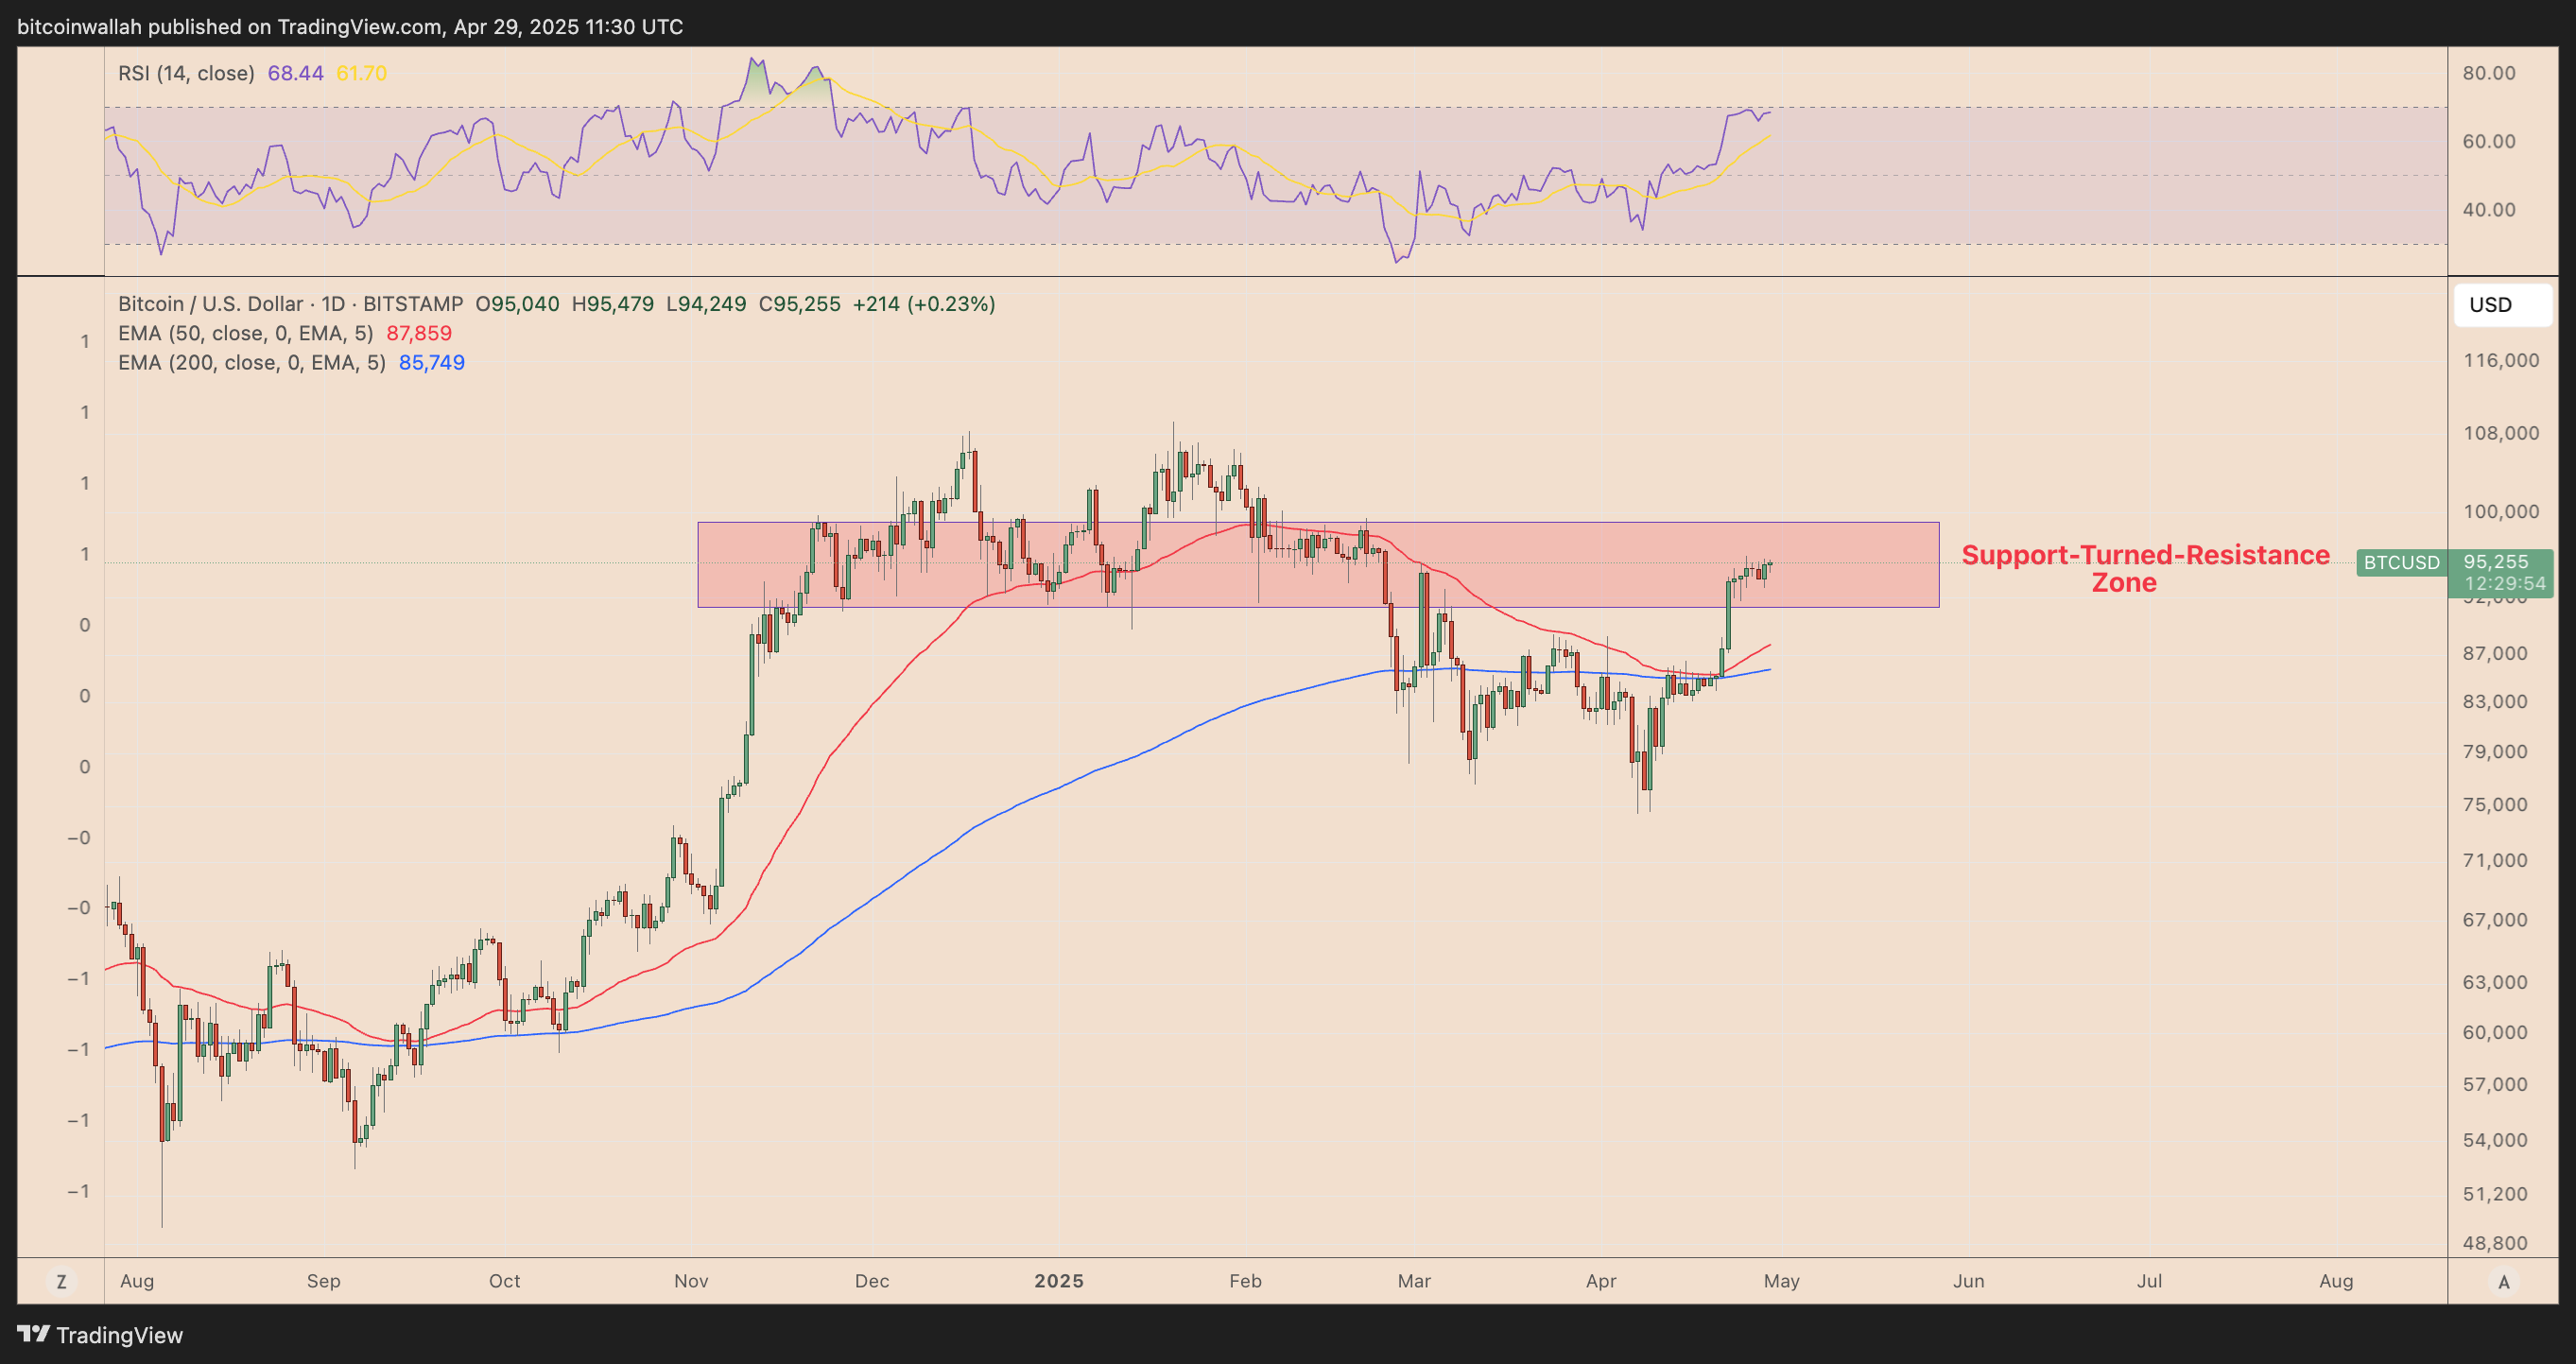
Such RSI readings have historically triggered local corrections, particularly when they coincide with horizontal resistance zones.
Price action confirms this caution. Bitcoin is currently testing a critical support-turned-resistance area between $95,000 and $100,000, which capped the market during its February–March consolidation phase. So far, bulls have failed to establish a strong breakout above this range.
The positioning of the 50-day and 200-day EMAs, currently at $87,859 and $85,749, respectively, adds to the downside risk. If BTC faces rejection at the current resistance zone, these levels may act as magnetic support.
A short-term correction toward these EMAs would align with RSI mean reversion and the broader pattern of cooling demand momentum observed on-chain.