December Comex Gold continued to consolidate in a tight and narrow range. Volatility has been low, but it could start to pick up today or Friday. On
December Comex Gold continued to consolidate in a tight and narrow range. Volatility has been low, but it could start to pick up today or Friday. On Thursday, traders may react to the Bank of England interest rate decision because some are expecting a little dissension amongst Monetary Policy Committee members. For several years, the vote to keep interest rates at historical levels has been unanimous. Today’s vote may show that two MPC members want to see a rate hike. This could be bearish for gold prices.
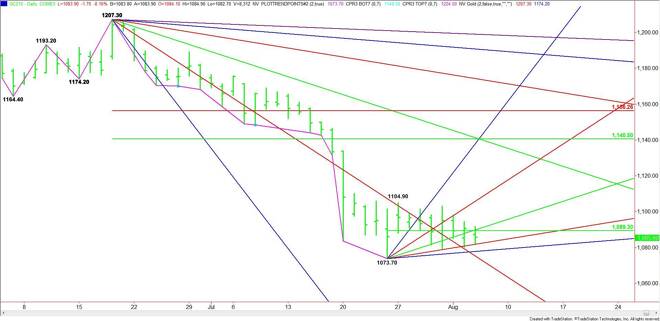
The main trend is down on the daily chart. The minor range is $1073.70 to $1104.90. Its 50% level or pivot is $1089.30. This price is controlling the short-term direction of the market.
Yesterday’s close was below this pivot, giving the market an early downside bias. The first support angle is $1082.70, followed by another angle at $1078.20. This is the last angle before the $1073.70 main bottom.
Taking out the bottom at $1073.70 will reaffirm the downtrend. Crossing to the bearish side of the steep downtrending angle at $1071.30 and sustaining the move will put the market in an extremely weak position. The next likely downside target under this area is $1050.00.
Crossing to the strong side of the pivot at $1089.30 will signal the presence of buyers. Look for an acceleration to the upside if the angle at $1091.70 is taken out with conviction.
The next target over $1091.70 is another uptrending angle at $1109.70. This is another potential breakout point with even more room to the upside. The next major upside target over this level is a downtrending angle at $1139.30 and a 50% level at $1140.50.
The direction of the market today will be determined by trader reaction to the short-term pivot at $1089.30. The trigger point for a steep upside breakout is $1109.70. The trigger point for a steep down move is $1073.70.
This market appears to be setting up for a volatile room. The chart indicates there is the potential for a $40.00 rally or a $40.00 break over the next two days.
James Hyerczyk is a U.S. based seasoned technical analyst and educator with over 40 years of experience in market analysis and trading, specializing in chart patterns and price movement. He is the author of two books on technical analysis and has a background in both futures and stock markets.