


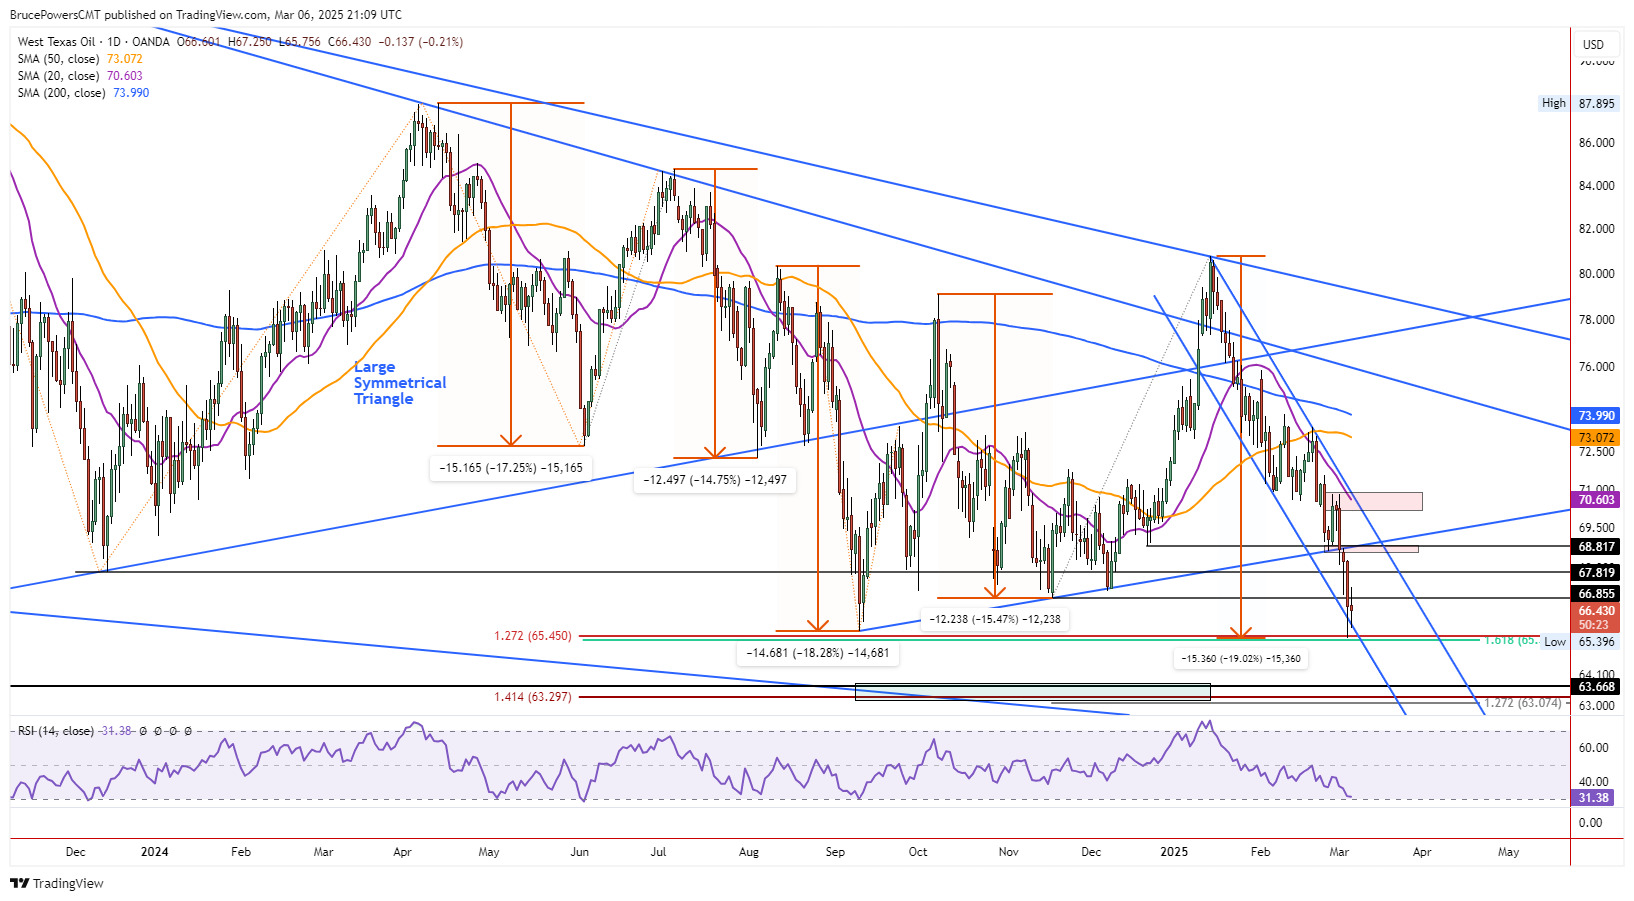
Crude oil consolidated on Thursday following a new retracement low of $65.40 that was reached on Wednesday. It is on track to end today with an inside day. Wednesday’s low completed a $15.36 or 19% decline from the January swing high of $80.76. This makes the current bearish correction the largest of the four prior corrections on a percentage basis.
WTI Crude Oil Price Forecast
Every new WTI Crude Oil analysis as it publishes, today's technical signal and key levels, live price — on one page.
See all WTI Crude Oil forecastsThe four most recent bearish corrections ranged from a decline of 14.8% to 18.3%. On that basis alone crude oil should be close to a potential bottom that could lead to at least a bounce. In addition, support for the decline was seen by a prior trend low support level reached in September at $65.65. Also, notice that the low of this week found support near the lower trendline of a declining channel.

On Track for Lowest Weekly Close in Almost Two Years
Of concern is the weekly closing price for this week. A weekly closing price below $67.22 would be the lowest weekly closing price since March 2023, while a close below $66.37 would be the lowest weekly closing price since August 2021. This would be a bearish sign on a larger time frame and would further confirm recent bearish indications.
At Risk of Bearish Continuation of Long-term Downtrend
Moreover, recent bearish price action along with a test of prior long-term support suggests the possibility of an eventual breakdown to new lows. Given a successful test of support at prior long-term lows and the bottom channel line for the current downswing, it seems likely that a bounce to test resistance within the current decline may come first. That could eventually lead to a larger bullish reversal. But until that time the downtrend can be expected to retain its boundaries and could lead to a bearish continuation.
Bounce Possible Above $67.25
Since today is an inside day, an initial bullish reversal signal will be generated on a rally above the high for the day at $67.25. Previous support around $68.10 becomes the first upside target. That target area is marked by an uptrend line, a prior interim swing low from December, and a prior minor trend low from last week. Higher up is potential resistance around the 20-Day MA trend indicator. It is currently at $70.60 and falling.
For a look at all of today’s economic events, check out our economic calendar.


