Dogecoin (DOGE) could extend its ongoing correction by another 60% in the coming weeks, as two overlapping bearish chart patterns point to further downside.
As of Oct. 9, Friday, the top memecoin was trading near $0.085, down more than 9% on its latest three-day candle, with sellers defending a key resistance zone that previously served as support.

DOGE Bear Flag Breakdown Targets $0.033
Dogecoin has broken below the lower ascending trendline of a long-term bear flag on its three-day chart, confirming a potential continuation of its broader downtrend.
The pattern developed after DOGE’s sharp decline from its late-2024 highs, followed by several months of consolidation within an upward-sloping channel.
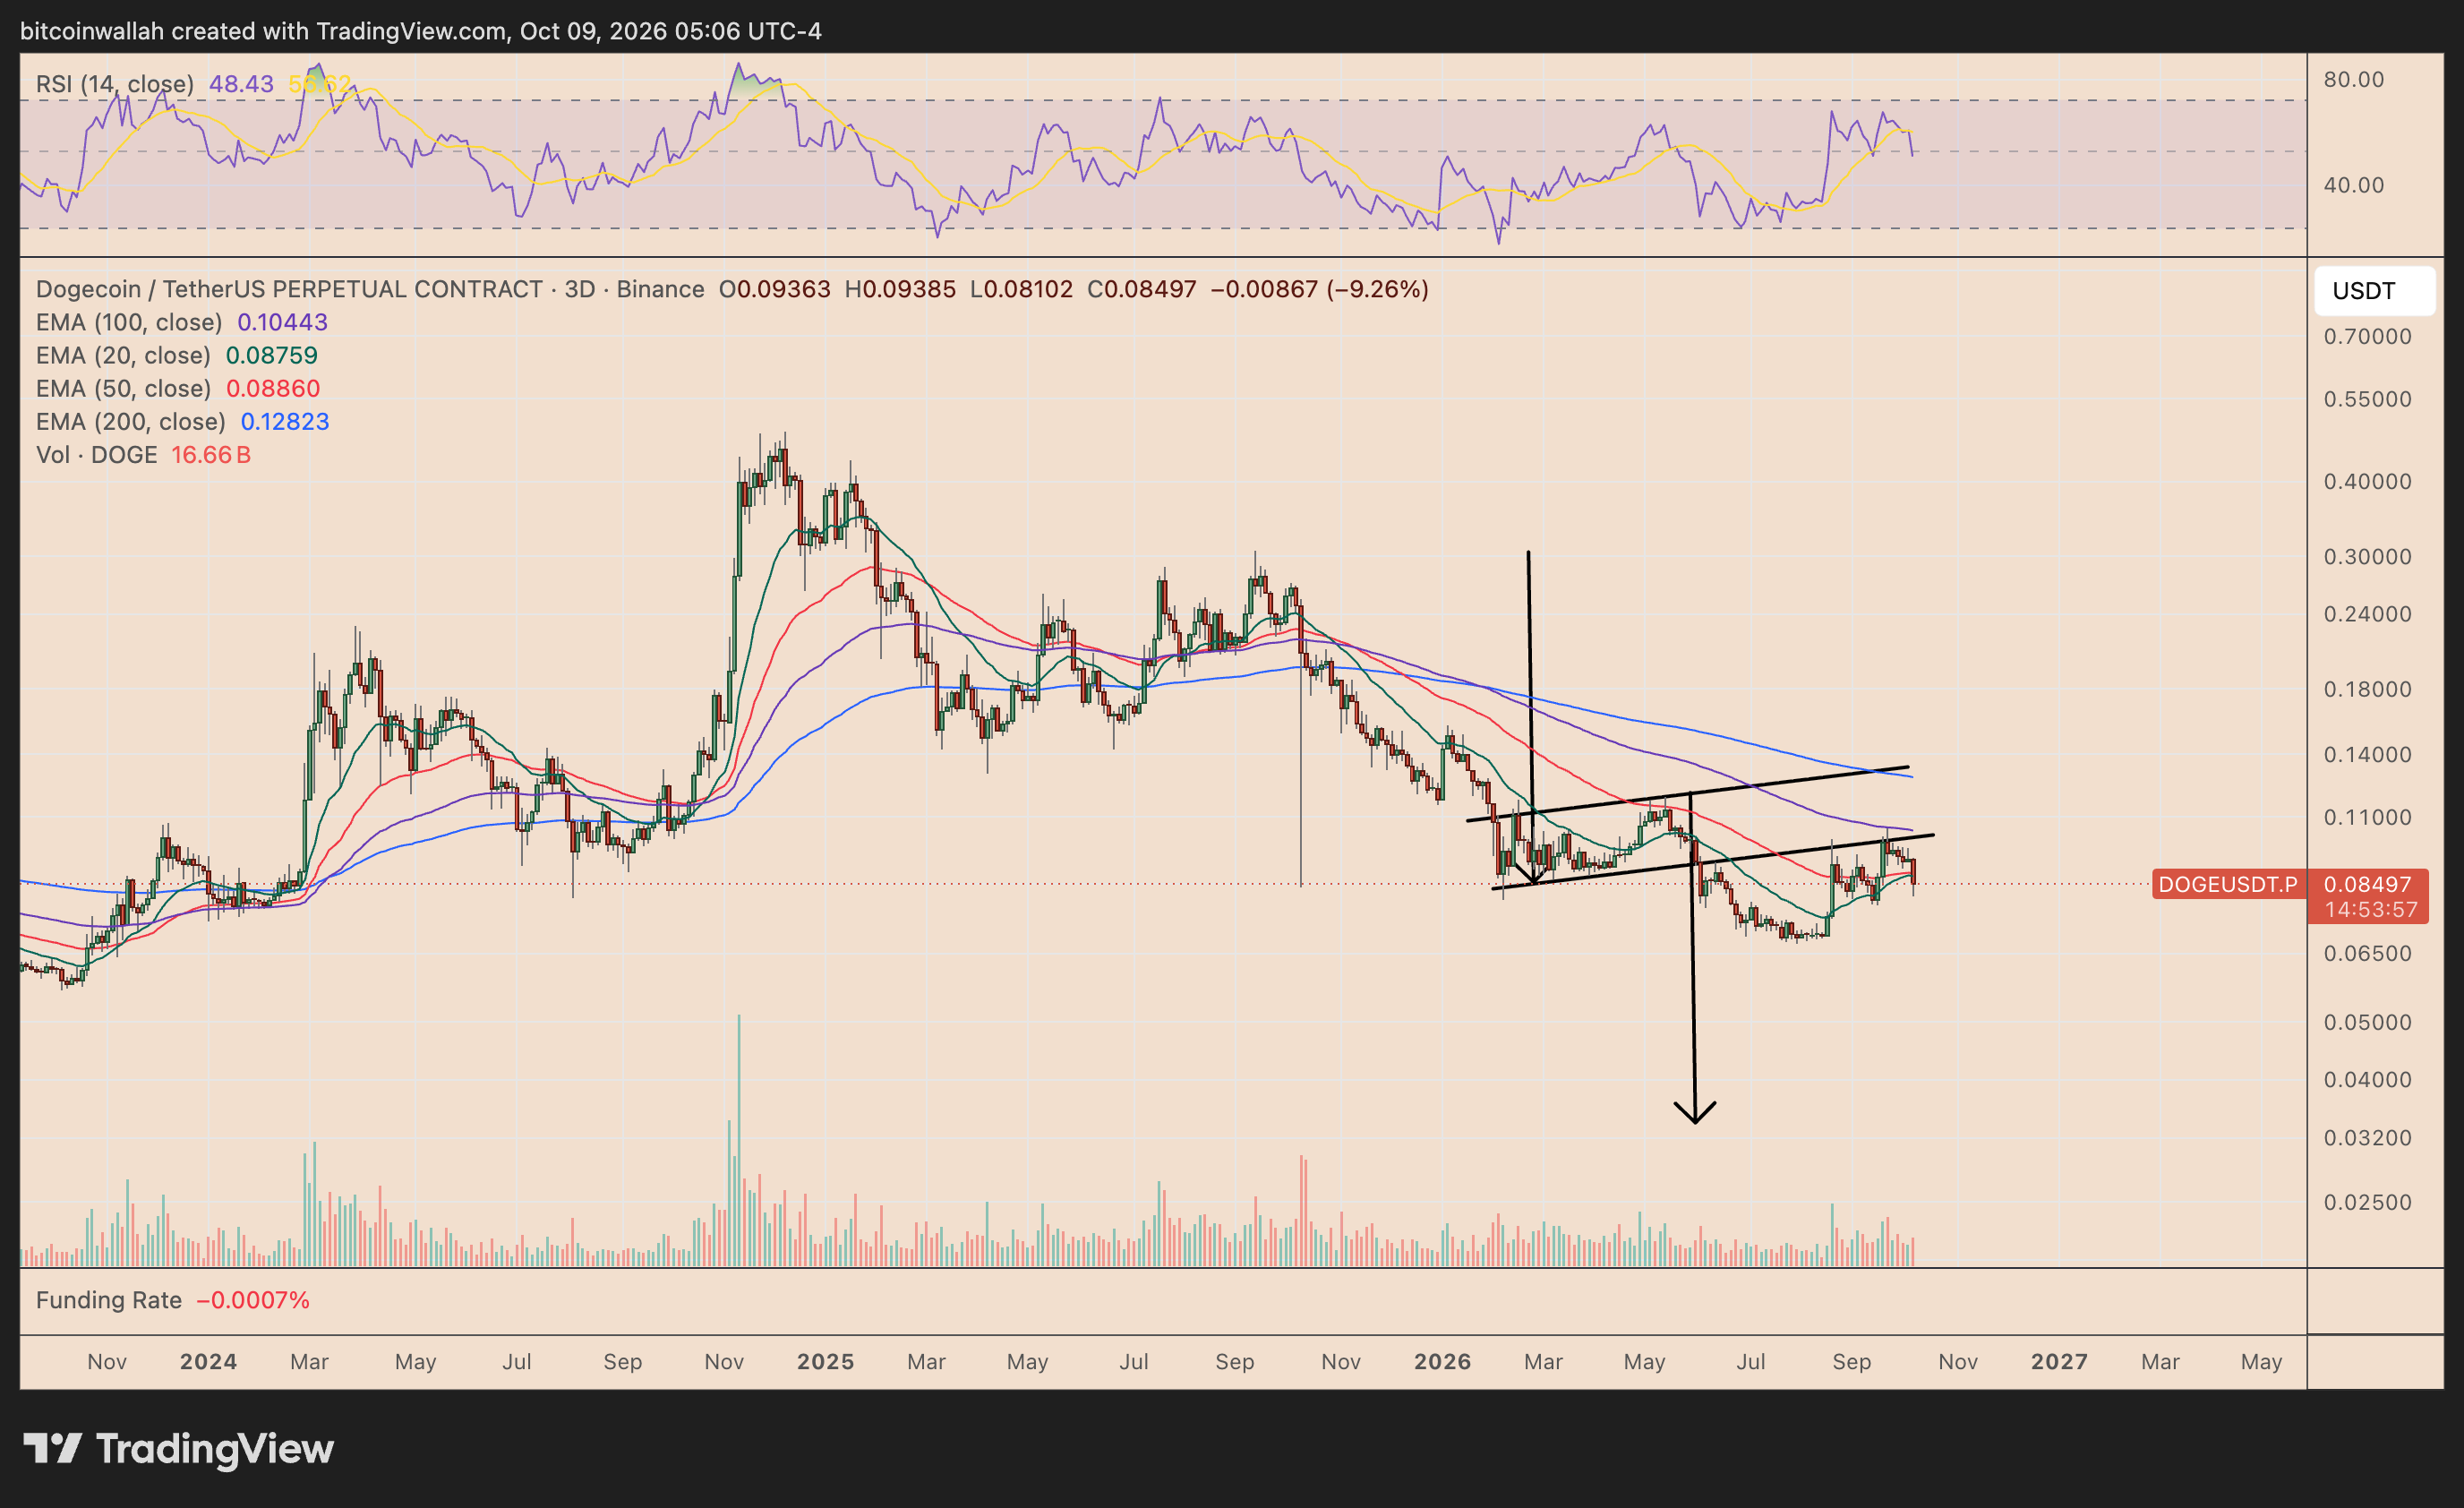
The latest breakdown has turned the flag’s former support into resistance.
DOGE is now retesting this broken trendline from below, a common technical phenomenon following bearish breakdowns. Such retests often occur when buyers attempt to reclaim lost support, only to encounter renewed selling pressure.
A rejection would strengthen the bear flag’s bearish continuation signal, putting its projected downside target near $0.033 in focus, approximately 61% below current prices.
However, DOGE may encounter intermediate support around $0.065 before approaching that target.
Dogecoin Price Forecast
Every new Dogecoin analysis as it publishes, today's technical signal and key levels, live price — on one page.
See all Dogecoin forecastsRising Wedge Adds to Dogecoin’s Downside Risks
A smaller rising wedge has also emerged during DOGE’s latest rebound, reinforcing the broader bearish structure.
Notably, the bear flag’s broken lower trendline doubles as the rising wedge’s upper resistance boundary, creating a technical confluence where selling pressure could intensify.
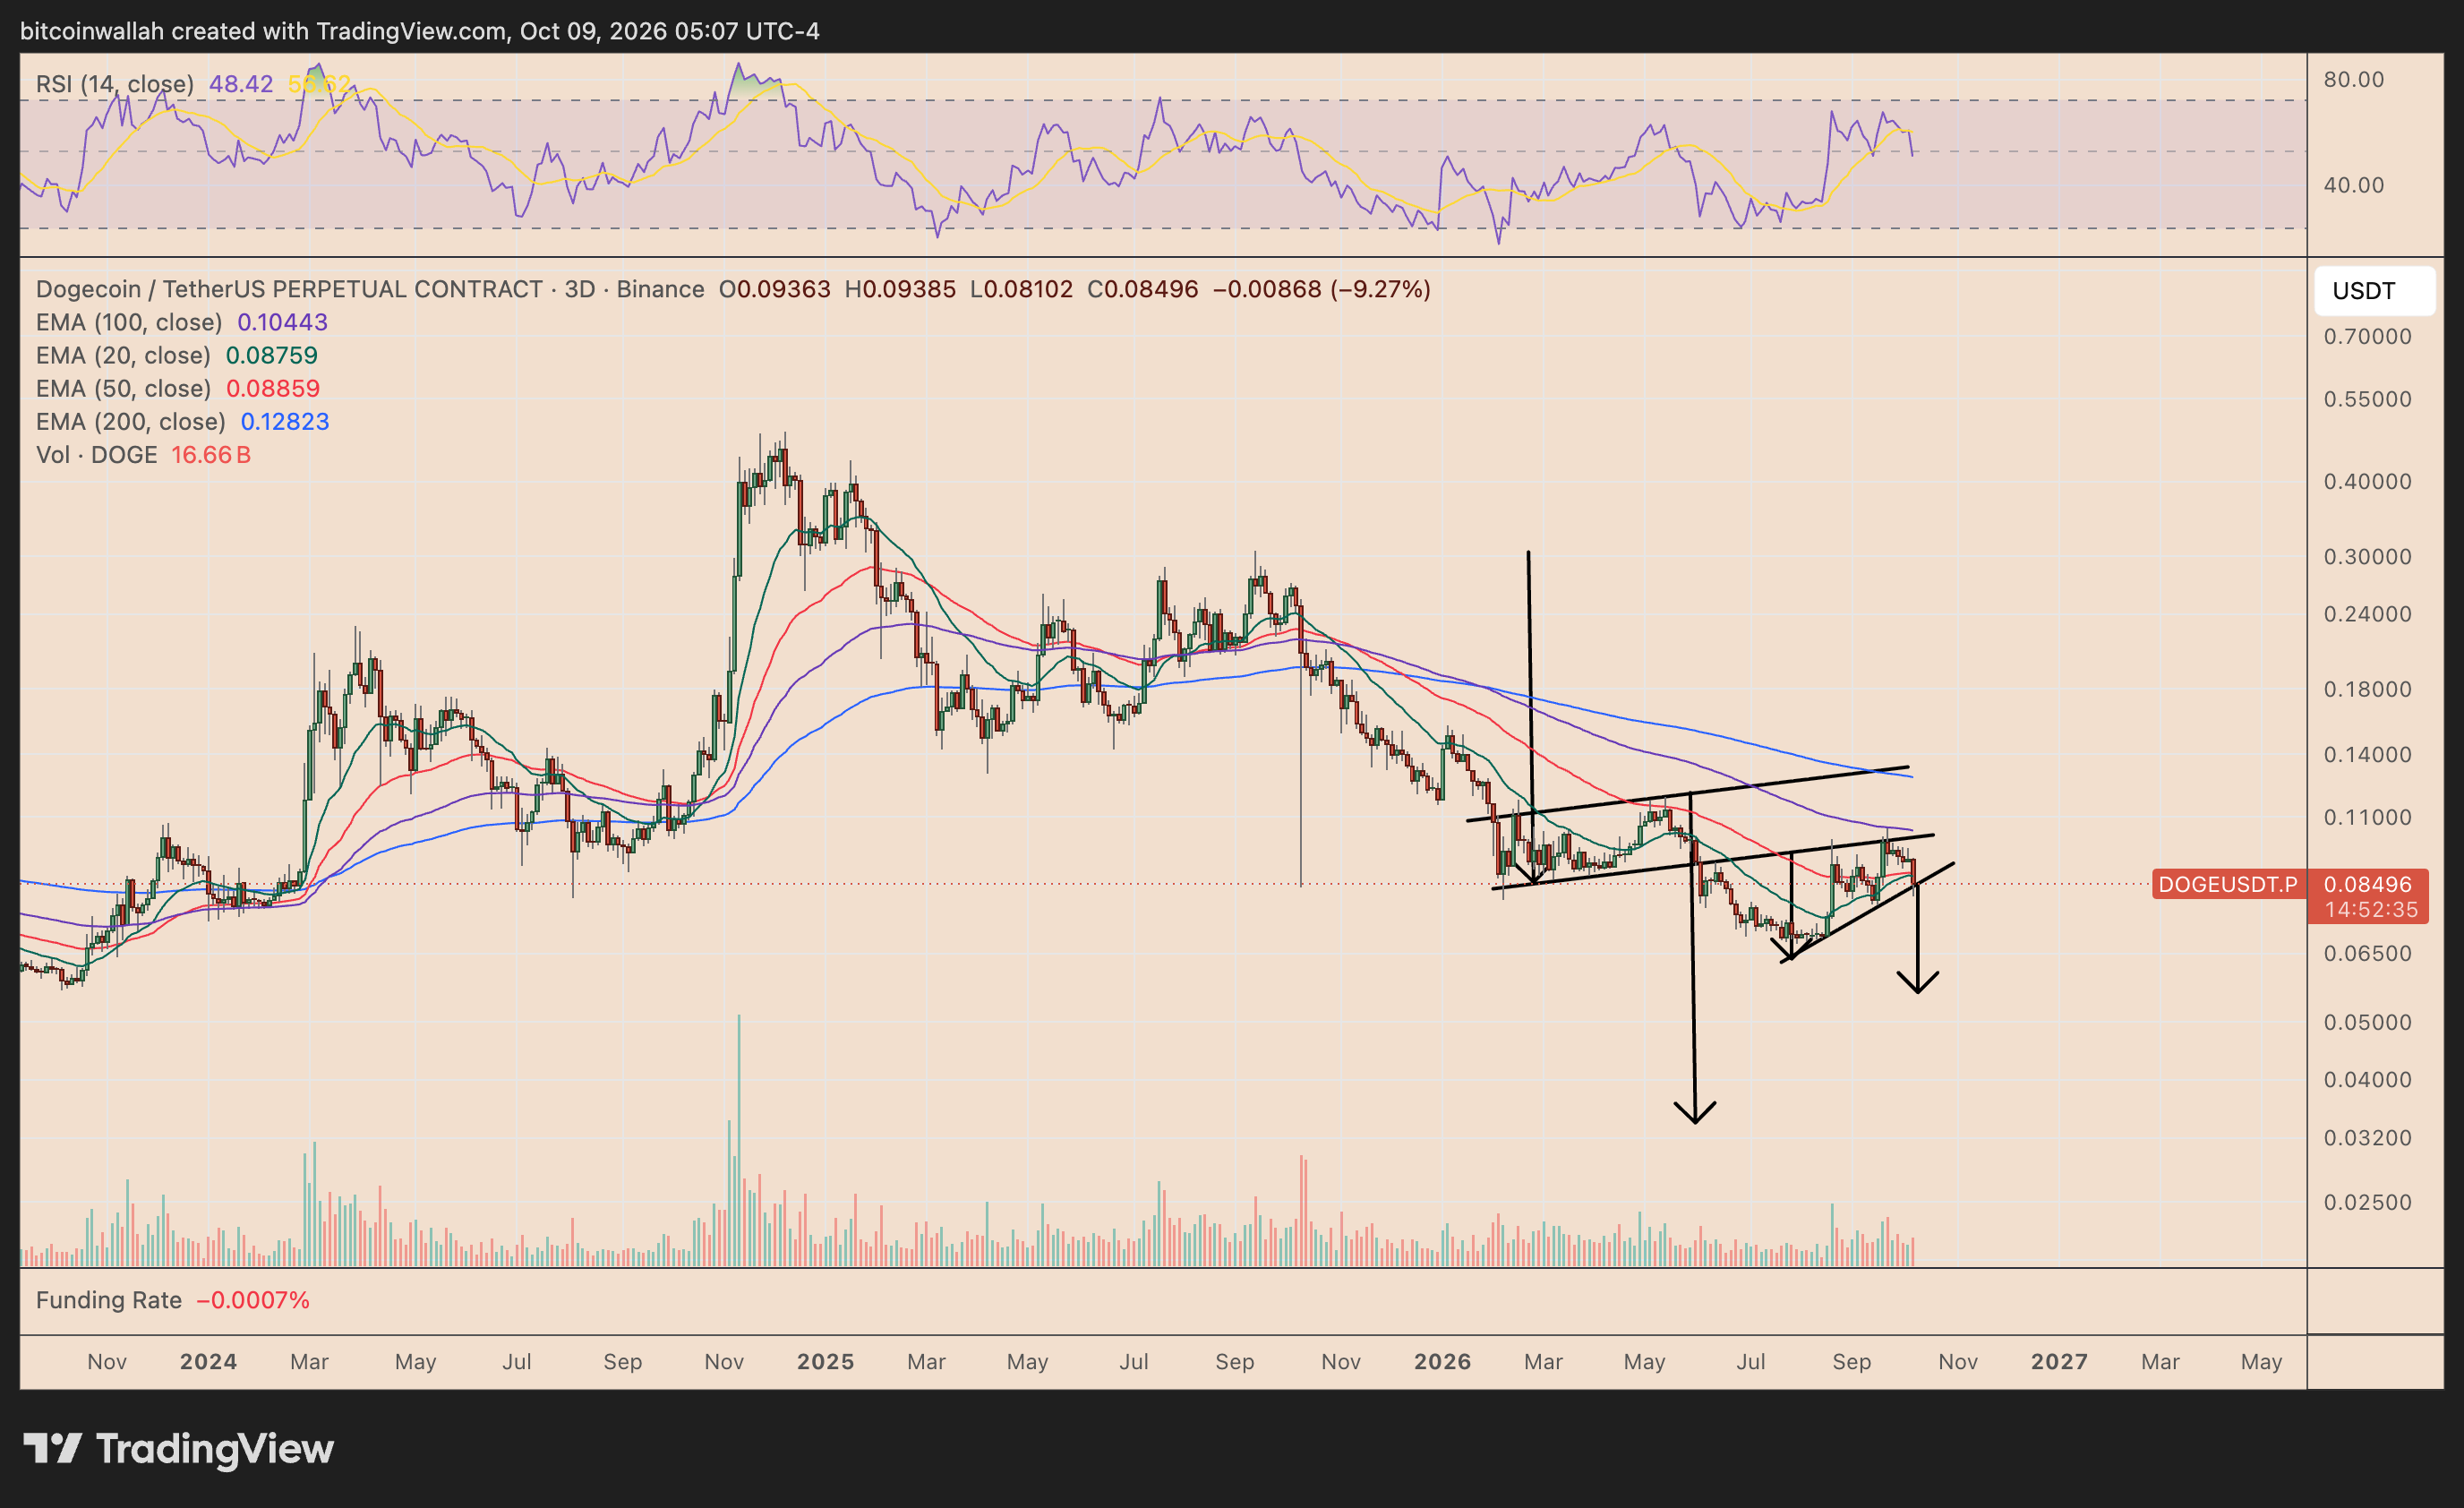
The wedge consists of two upward-sloping, converging trendlines, indicating that DOGE’s recovery is losing momentum despite its recent higher lows.
DOGE has already faced rejection near the wedge’s upper boundary. A decisive three-day close below its rising lower trendline, currently around $0.083-$0.085, could confirm another bearish reversal.
Such a breakdown would initially expose the $0.065 support region, with the larger bear flag maintaining the possibility of a deeper decline toward $0.033.
Meanwhile, DOGE remains below its 20-, 50-, 100-, and 200-period three-day exponential moving averages, reflecting persistent bearish pressure across multiple trend horizons.
Its relative strength index (RSI) is hovering near 48, suggesting that downside momentum has room to expand before reaching oversold conditions.
Conversely, a sustained recovery above $0.10-$0.11, including a reclaim of the broken flag support, would weaken the bearish setup and delay the projected decline.