XRP (XRP) has dipped nearly 7% in the past 7 days, as the token struggled and finally failed to clear the $1.60 resistance during its most recent leg up.
Trading volumes continue to be relatively high at around $3 billion, accounting for nearly 4% of the asset’s circulating market cap.
The crypto market as a whole is experiencing some weakness as early buyers seem ready to start cashing out of their long positions.
The macroeconomic front is actually more supportive than it was a couple of weeks ago, as yesterday’s release of the FOMC minutes did not change analysts’ baseline scenario for rates.
For now, the consensus is that the U.S. Federal Reserve will delay its next rate hike until December at least, as the PCE Price Index in August came in below the market’s estimates.
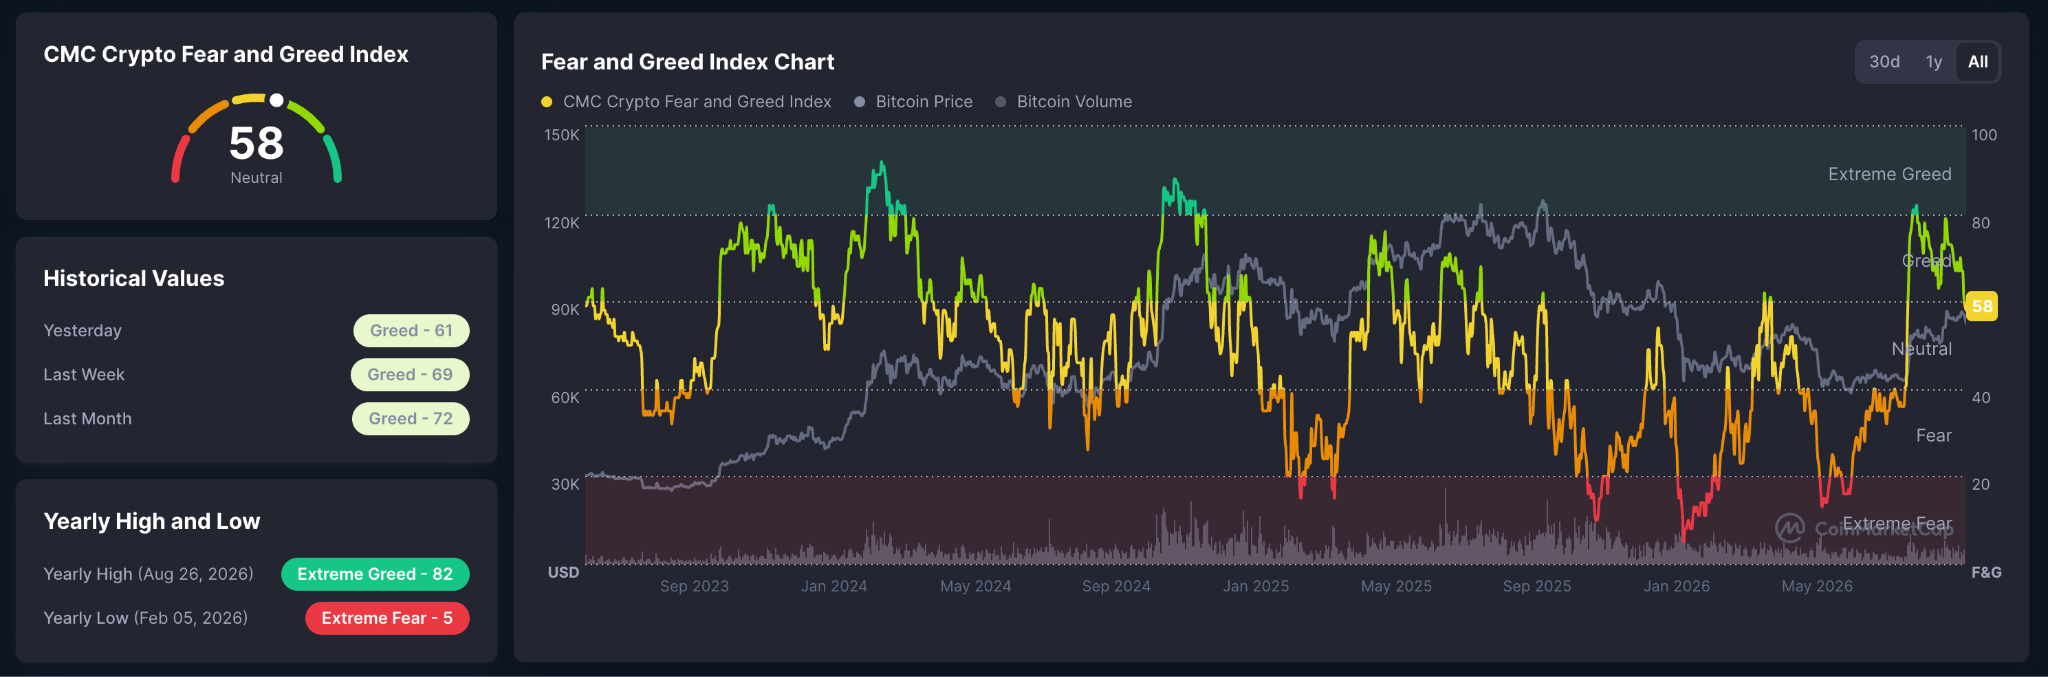
Meanwhile, market sentiment is leaning toward the Neutral side, which is a normal reaction to what is clearly a phase of correction. The Fear and Greed Index has retreated from a recent high of 80 to 58 at the time of writing, as market participants wait for the price action to find its next floor.

Net Inflows to Exchanges Accelerate as Early Buyers Prepare to Take Profits
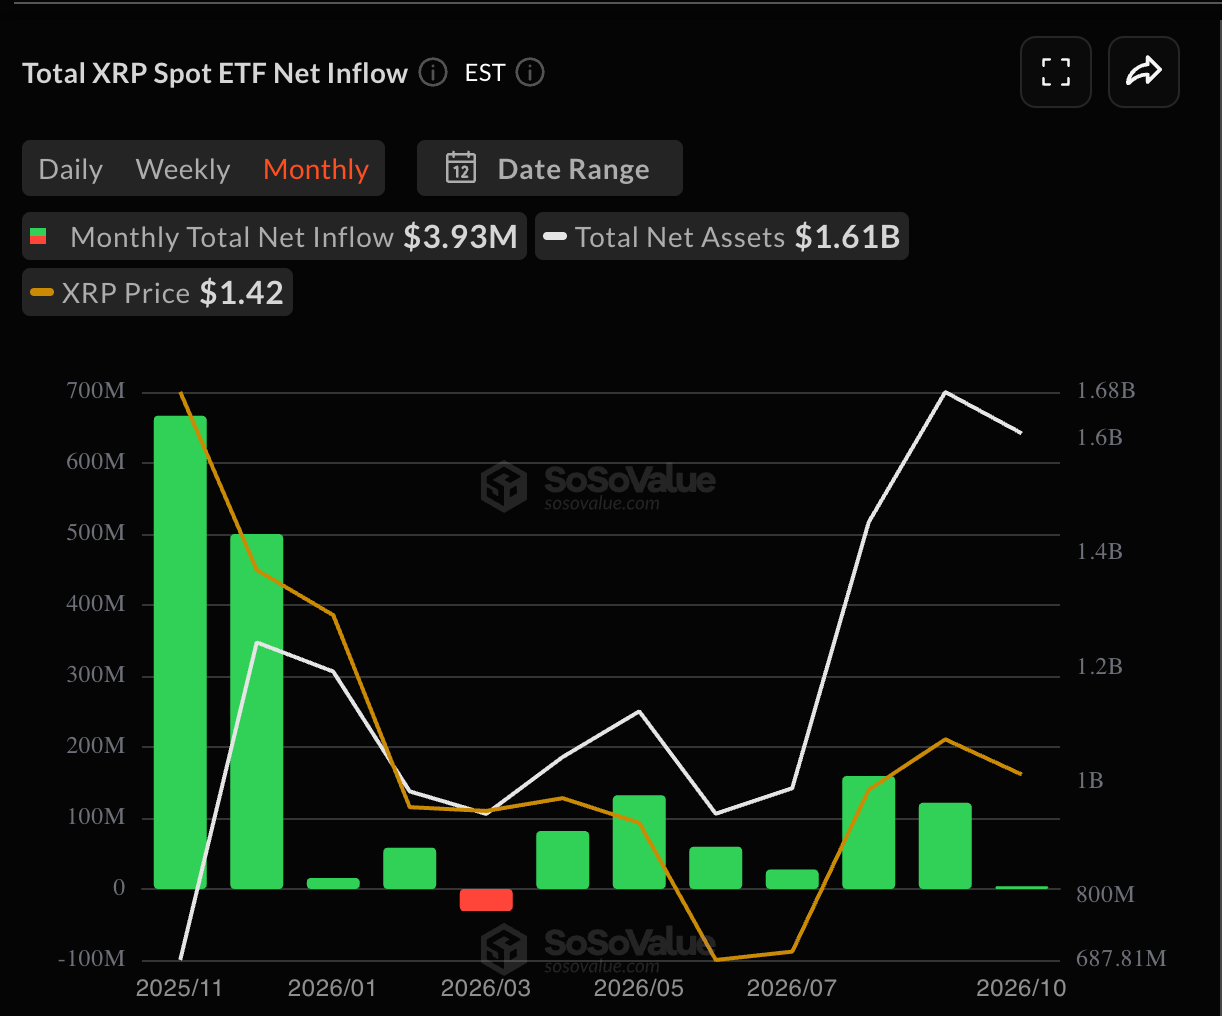
Net inflows to exchange-traded funds (ETFs) linked to XRP confirm this, as investors have abstained from pouring more money into these vehicles in October.
Last month, ETF inflows finished at $121.4 million. So far in October, investors have added only $4 million, resulting in a run rate of around $17 million for the entire month.
Meanwhile, on-chain data shows that inflows to exchanges have spiked in the past couple of weeks, rising to their highest level since July 2026, back when XRP started a controlled descent from $1.14 to $1.
We expect a similar outcome this time, as investors seem prepared to dump big volumes into the open market. However, the next support area for XRP seems fairly close, as the price is nearing the 200-day exponential moving average (EMA).
Ripple Price Forecast
Every new Ripple analysis as it publishes, today's technical signal and key levels, live price — on one page.
See all Ripple forecastsXRP Could Dip to $1.26 Depending on How Strong the Selling Pressure Gets
Turning to the daily chart, we can see that the latest drop has pushed the token near this key technical indicator. Hence, we expect a strong rebound off the $1.38 area once the price hits that mark.
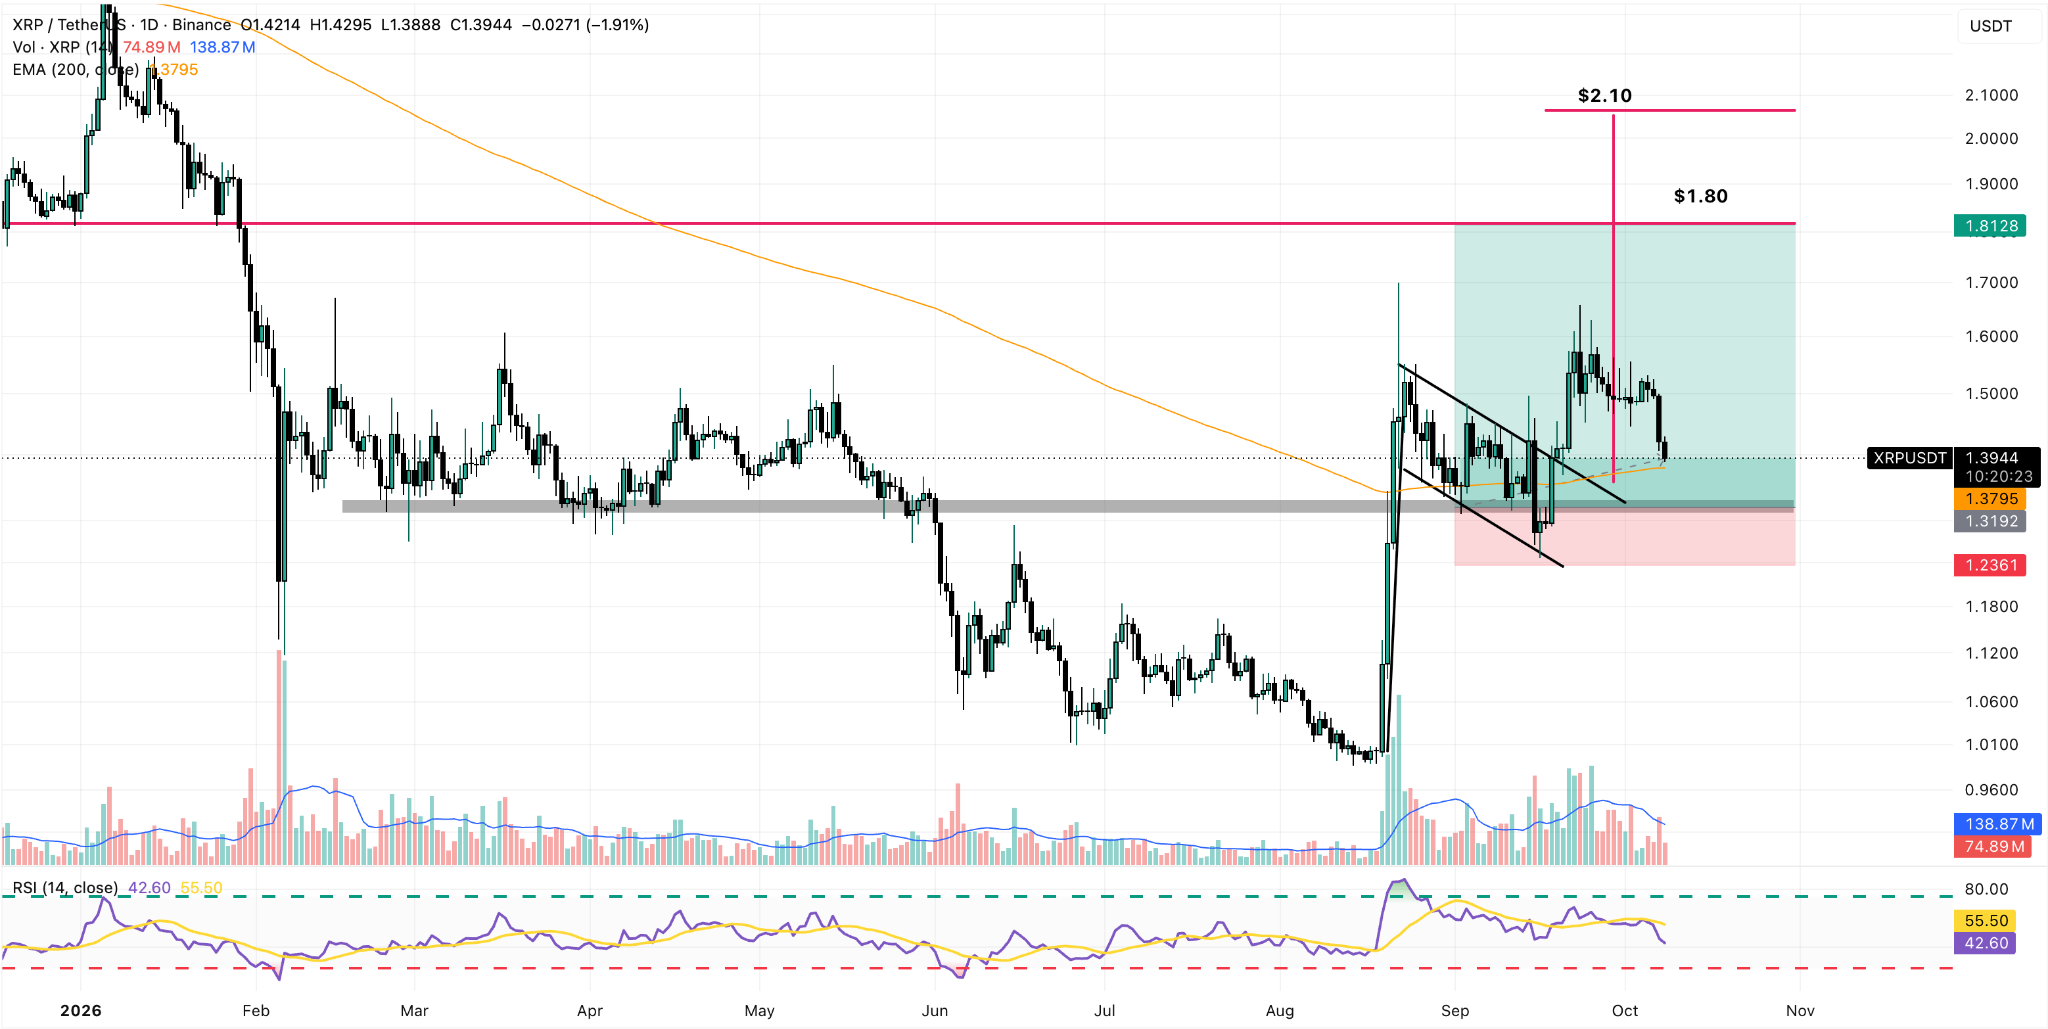
That said, if the correction accelerates, the next area of support in line would be $1.32, a price zone from which XRP has bounced off multiple times in the past. Momentum has turned bearish, as the Relative Strength Index (RSI) dropped below the signal line and is nearing the 40 area.
The last line of defense for bulls would be the $1.26 threshold — a former area of strong demand that the market may need to revisit if the selling pressure increases in the next few days.
Despite this temporary setback, we expect the resumption of the rally soon and maintain our target of $1.80 for the token in the mid-term.