Hyperliquid’s HYPE token could decline 17% toward $72 in the coming sessions, as bearish technical patterns emerge following its rally above my previously projected upside target.
In my previous analysis, I predicted that HYPE would rally toward $90.75 following an ascending triangle breakout. The token subsequently exceeded that target, climbing above $95 in late September.
However, the latest price structure suggests the rally is losing momentum, increasing the likelihood of a deeper correction.

HYPE Broadening Wedge Points to $75–$76
HYPE was trading near $87.30 on Oct. 8, down from its recent peak above $95.
Its daily chart shows an ascending broadening wedge, characterized by a rising upper resistance trendline and a slightly descending lower support trendline.
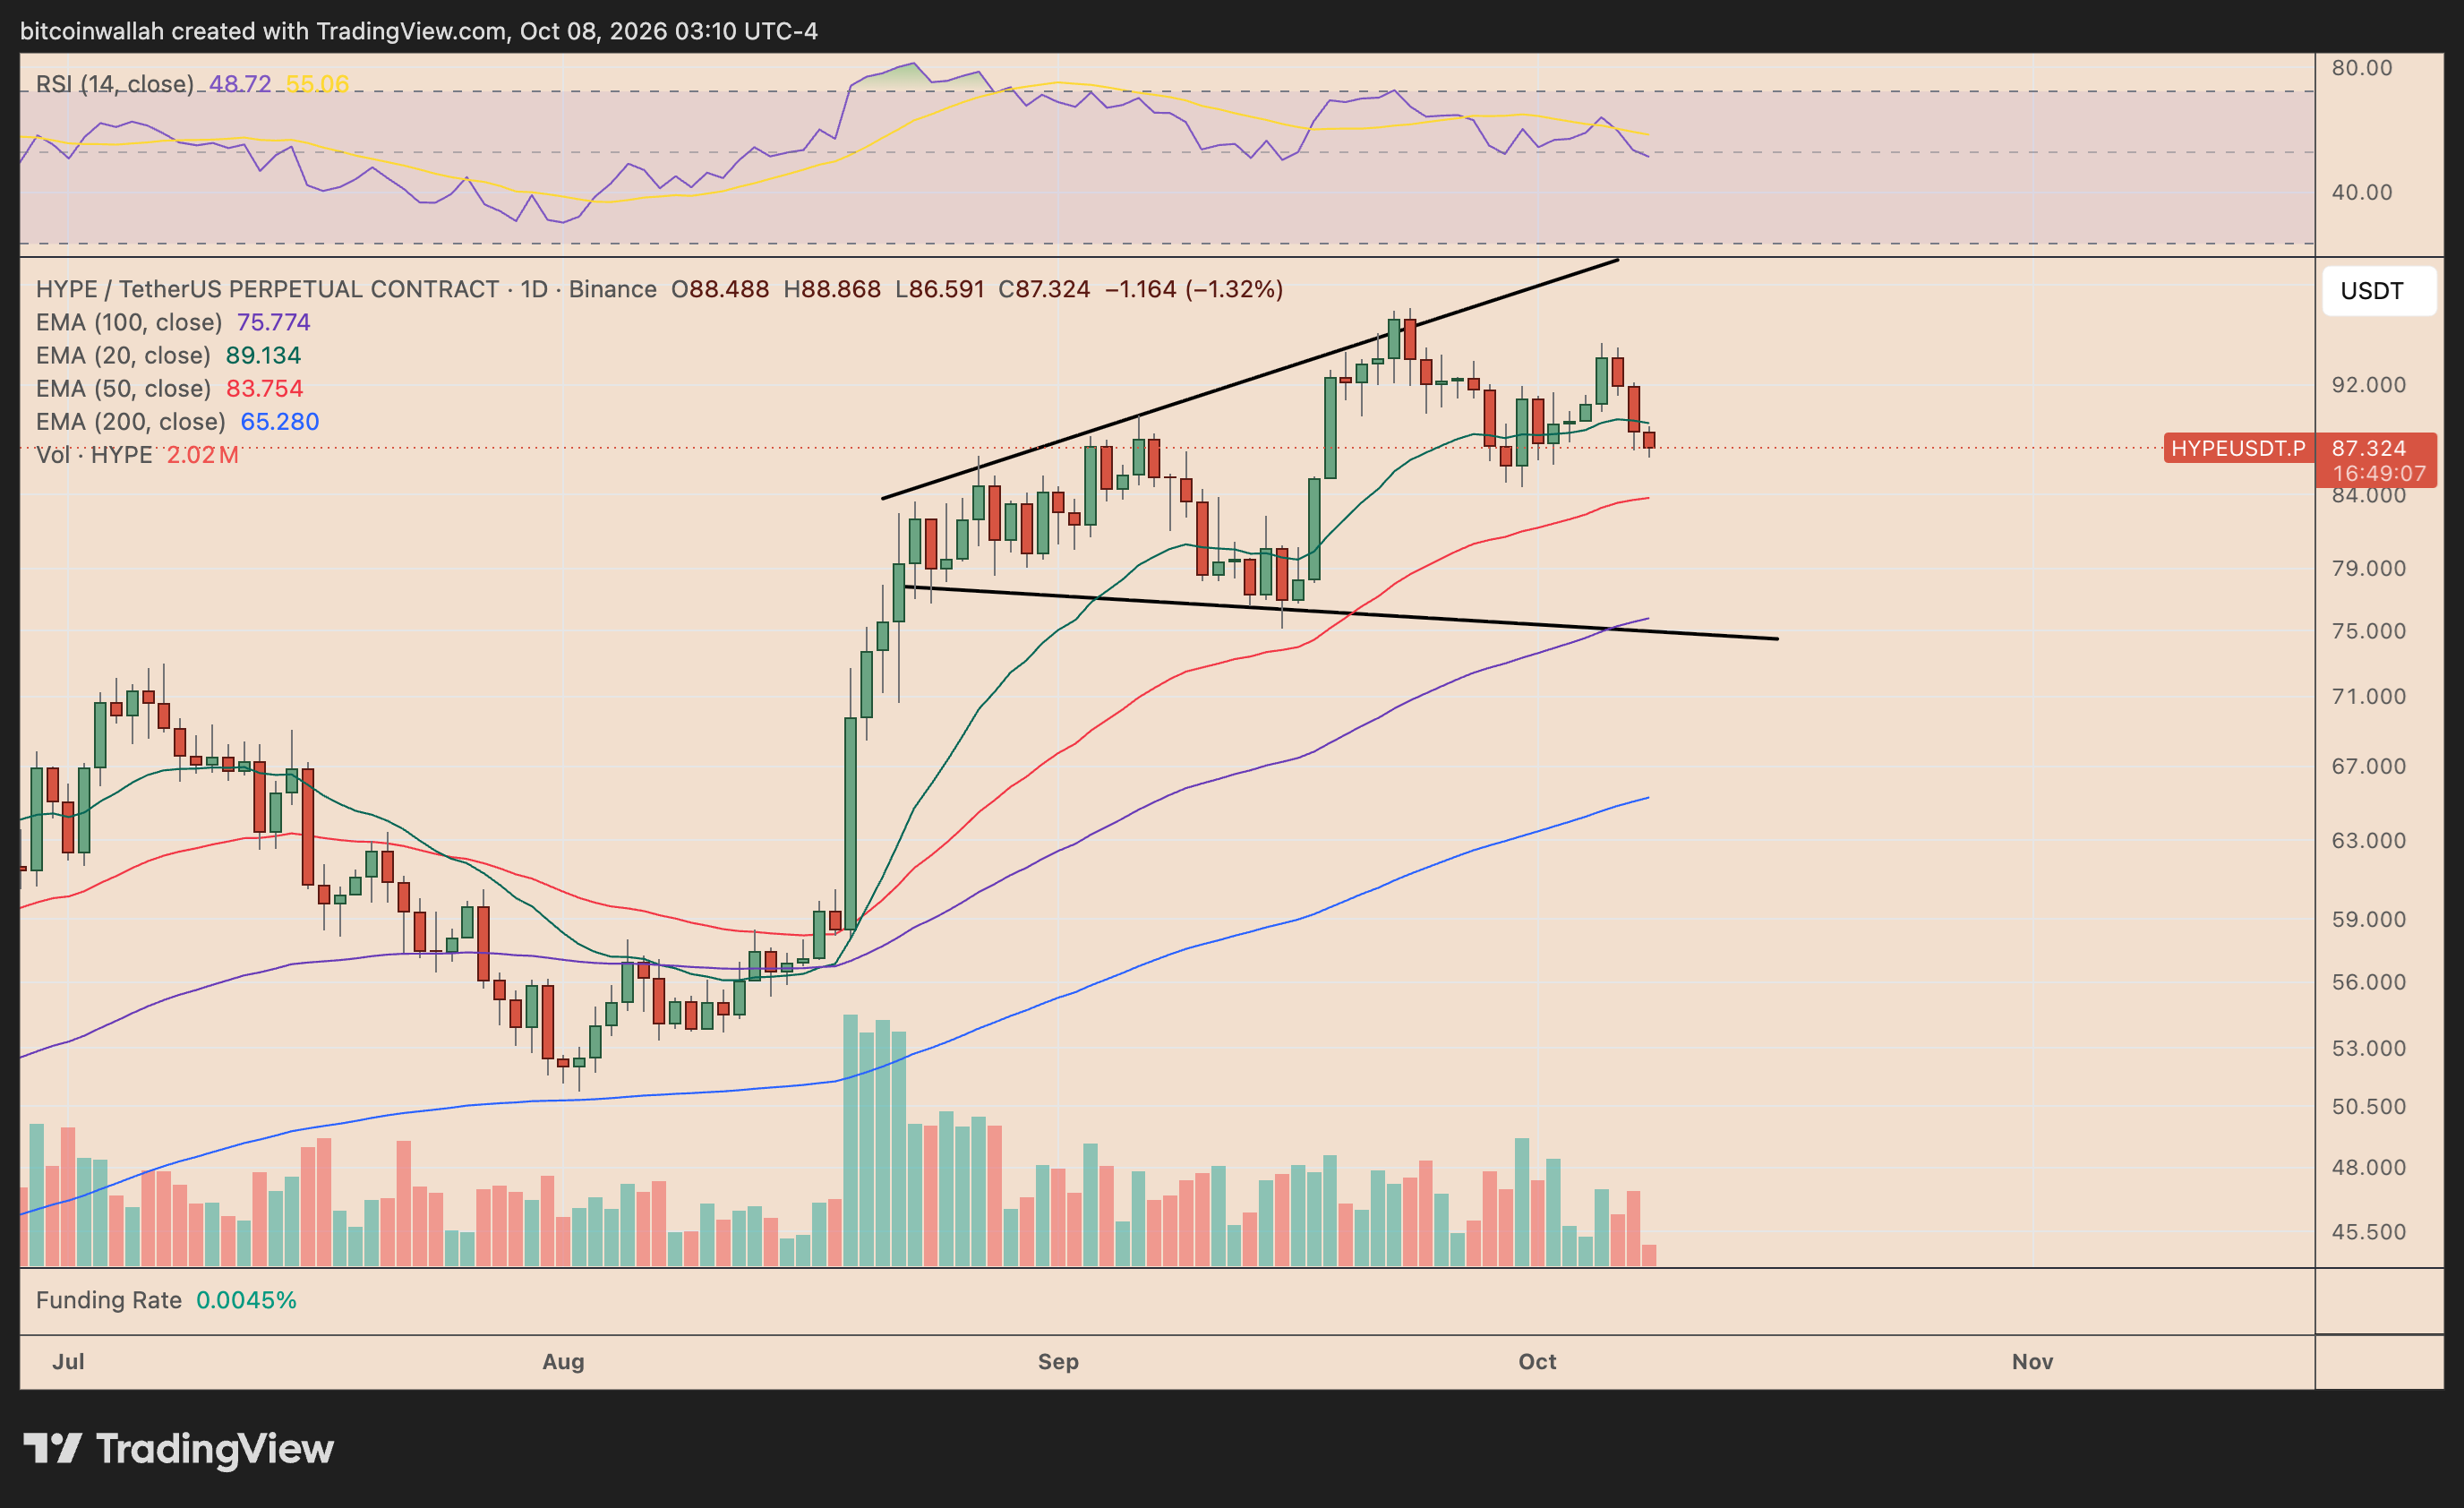
The token recently reversed from the wedge’s upper boundary and slipped below its 20-day exponential moving average (20-day EMA) near $89.13, suggesting weakening short-term momentum.
The daily relative strength index (RSI) has also fallen below 50, reinforcing the bearish outlook.
HYPE could initially decline toward its 50-day EMA near $83.75. A decisive breakdown below this support would increase the likelihood of a further drop toward the wedge’s lower trendline, which converges with the 100-day EMA near $75.77.
This represents approximately 13% downside from current prices.
HYPE Weekly Chart Signals Further Downside Toward $72
The weekly chart reinforces the correction scenario.
HYPE appears to be forming a smaller rising wedge near its recent highs, with its lower trendline providing immediate support around $75–$78.
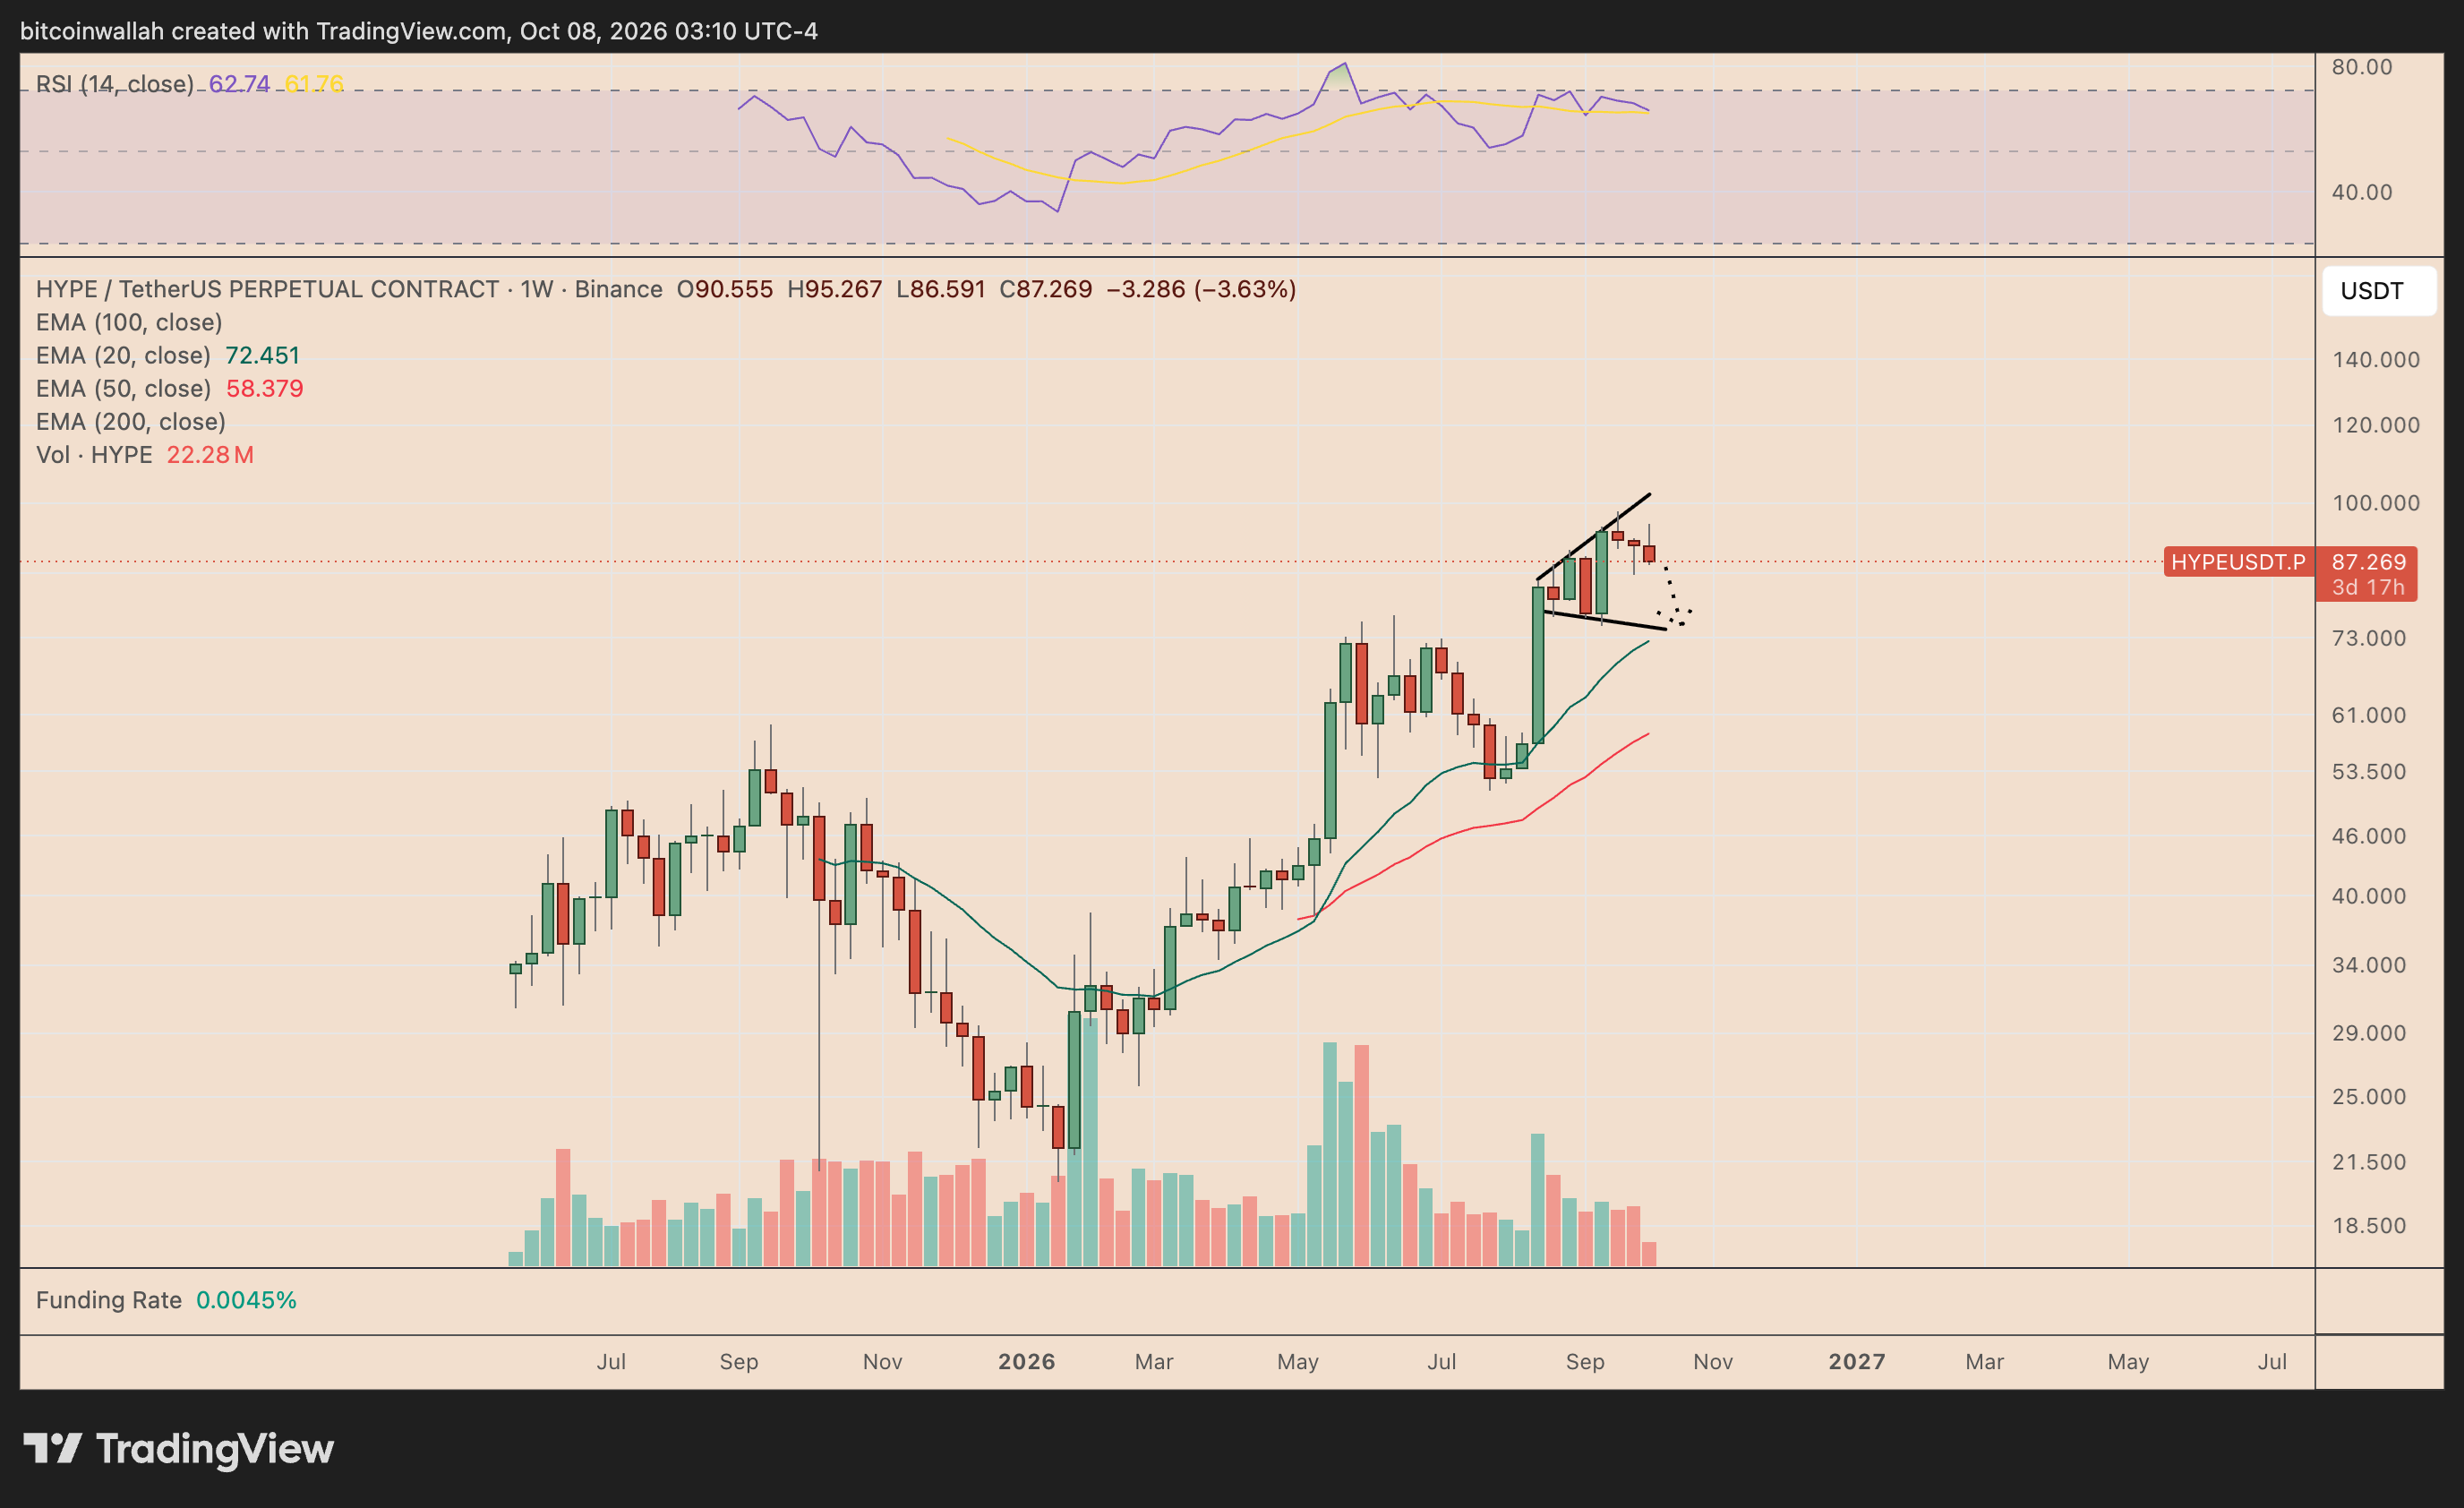
The weekly RSI remains near 62.74, leaving room for additional selling pressure before momentum enters oversold territory.
Nevertheless, the rising 20-week EMA has supported HYPE’s broader recovery, suggesting a retest could attract buyers rather than confirm a long-term bearish reversal.
A weekly close below $72.45 would weaken that outlook and expose the 50-week EMA near $58.38.
Conversely, a sustained recovery above $95–$100 would invalidate the immediate bearish setup.