Solana (SOL) risks a circa 15% correction toward $95 in the coming weeks as it tests a major resistance zone that previously acted as support.

SOL Faces Rejection Risk at Key Resistance Zone
As of Oct. 8, SOL was down approximately 1.79% to near $117 after testing a horizontal resistance zone around $115–$125 on its weekly chart.
The region acted as support throughout much of 2025 before breaking down in early 2026. It has since turned into resistance, with SOL now attempting to reclaim the level.
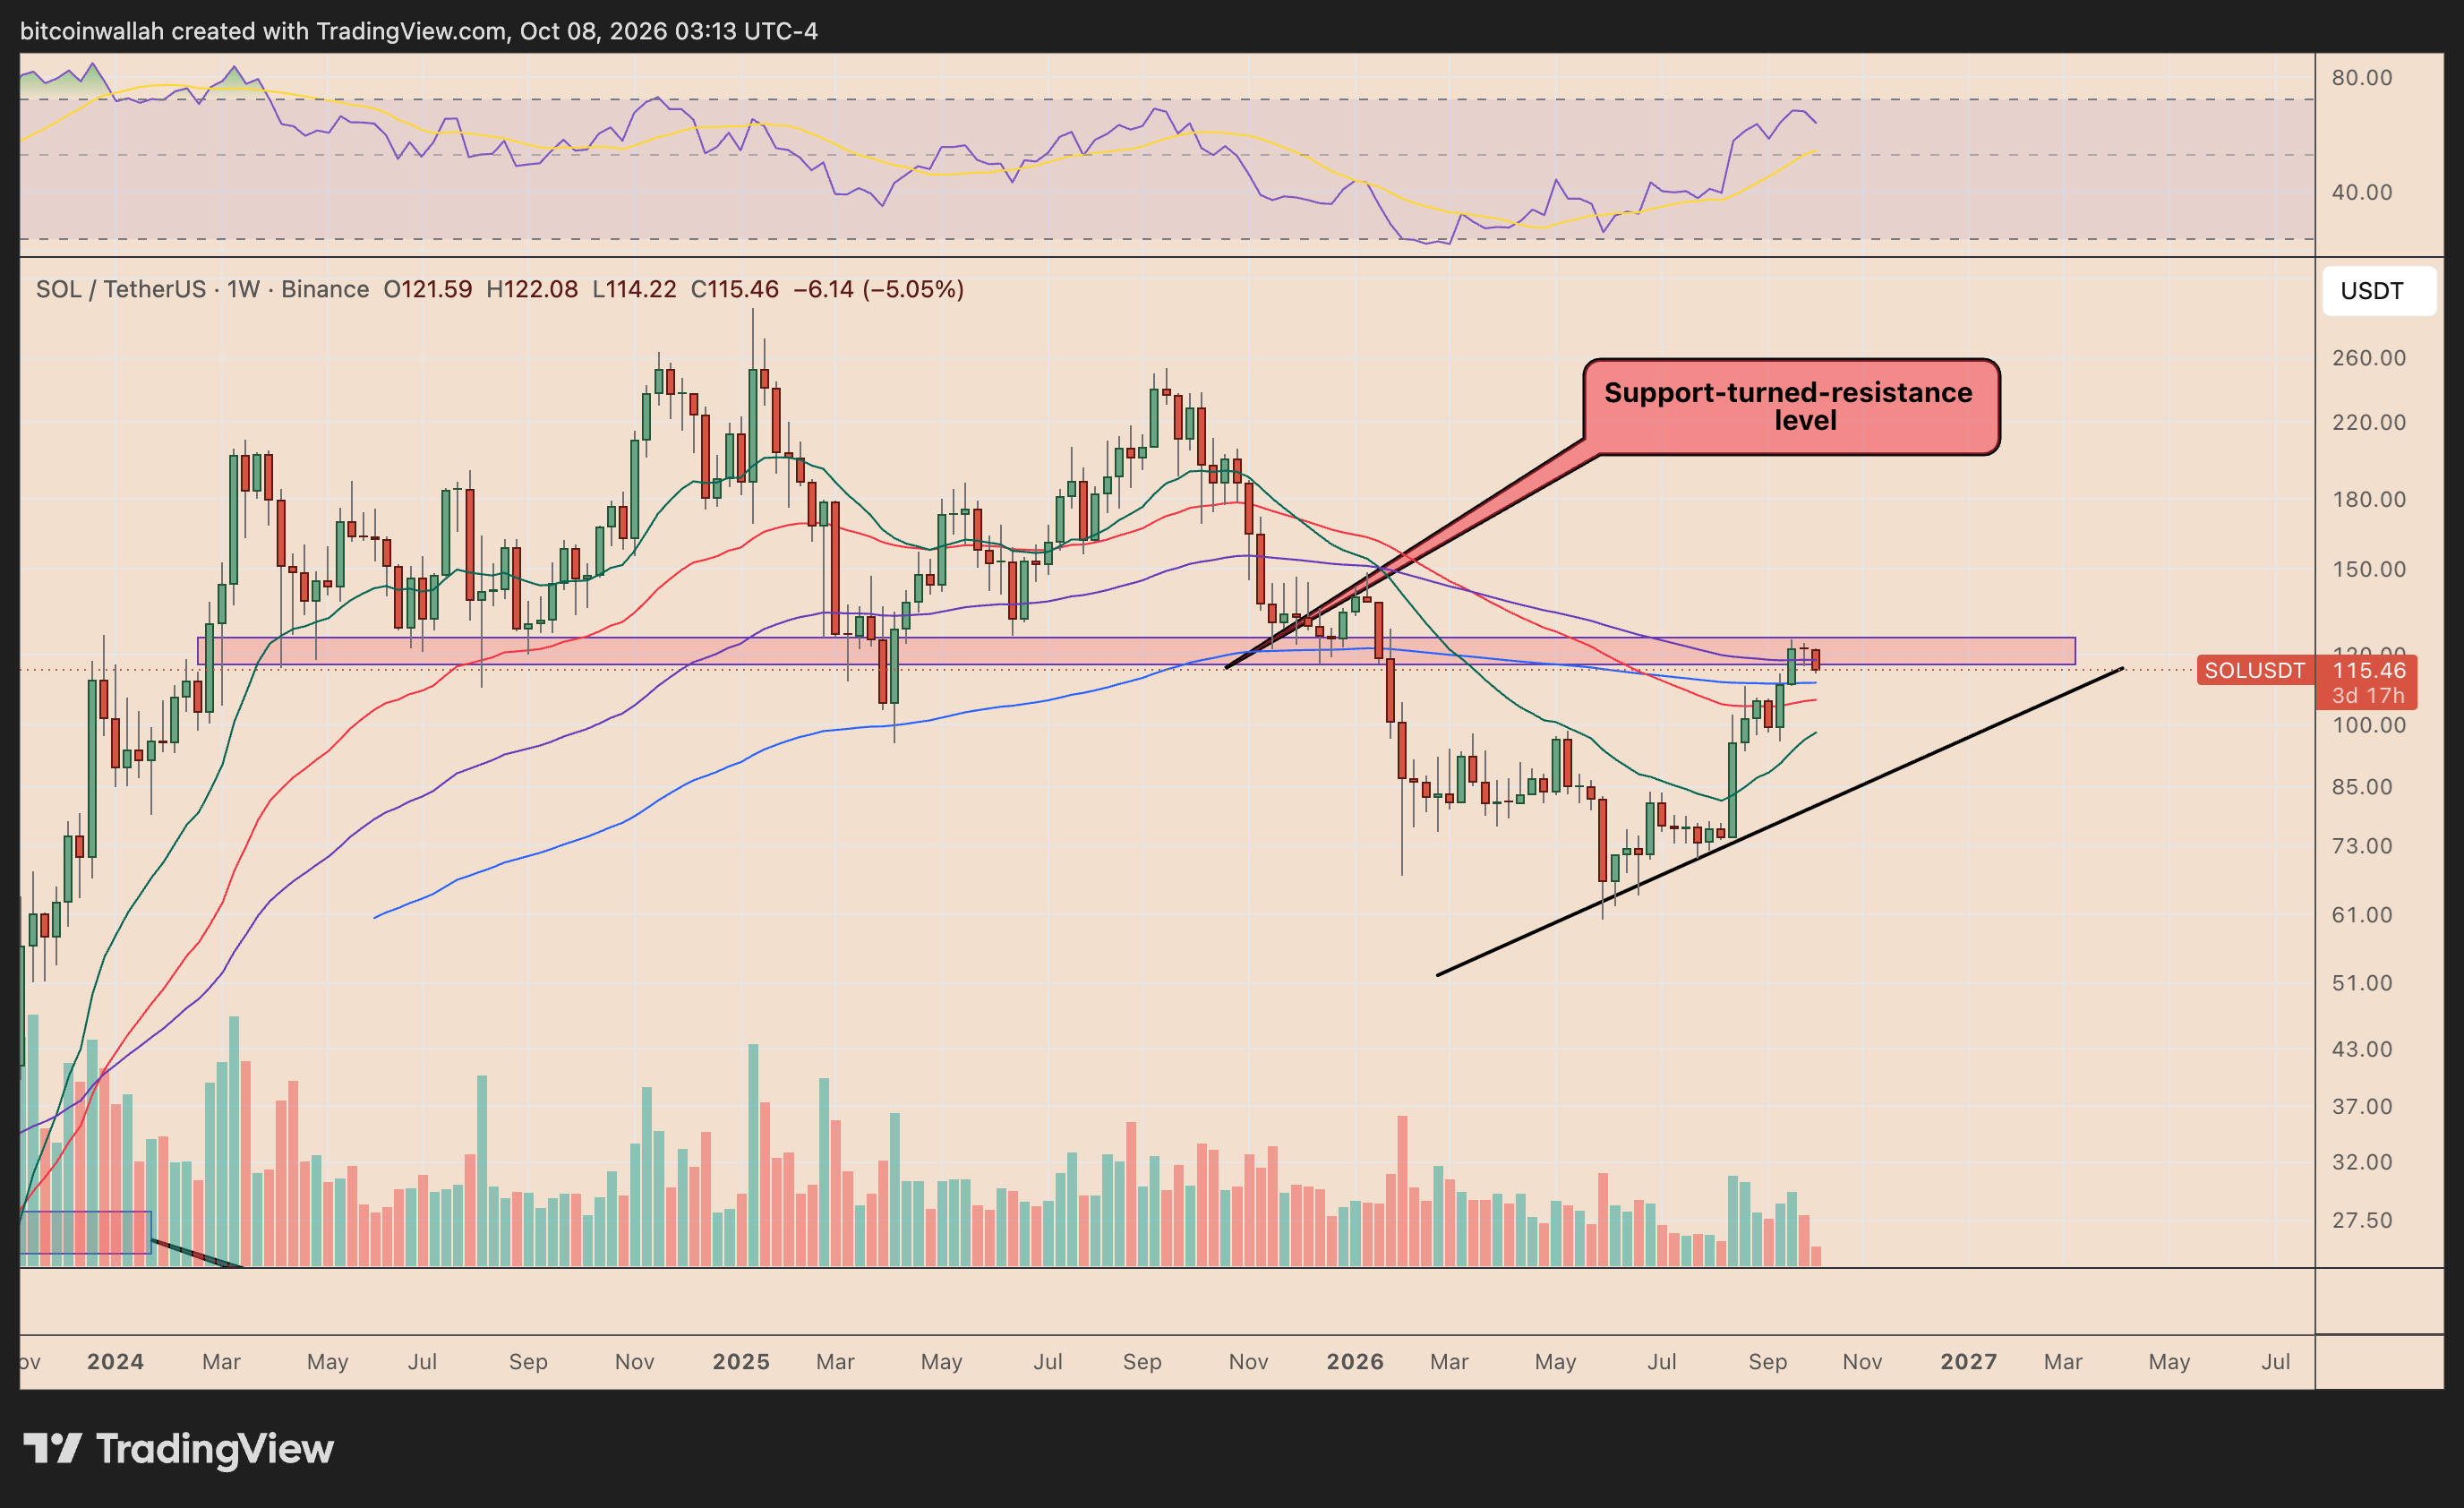
The resistance zone also overlaps with Solana’s 100-week exponential moving average (100-week EMA, purple) near $118.33, strengthening the possibility of a bearish rejection.
A failed breakout could send SOL toward its ascending support trendline, currently approaching the $95–$100 region, representing a potential decline of roughly 13%–17% from current levels.
The downside target also aligns with SOL’s 20-week EMA (green) near $97.91, making it an important area for buyers to defend.
Meanwhile, the weekly relative strength index (RSI) has climbed to around 60, suggesting improving bullish momentum. However, the indicator does not rule out a near-term pullback as SOL tests overhead resistance.
A decisive weekly close above $125 would weaken the bearish outlook and suggest that buyers have successfully absorbed the selling pressure.
Solana Price Forecast
Every new Solana analysis as it publishes, today's technical signal and key levels, live price — on one page.
See all Solana forecastsSOL’s 2023 Fractal Points to Long-Term Rally Toward $248
Despite the near-term correction risk, Solana’s broader weekly structure resembles a bullish setup that preceded its major rally in late 2023.
During that period, SOL repeatedly tested resistance around $25–$28 while establishing higher lows along an ascending support trendline.
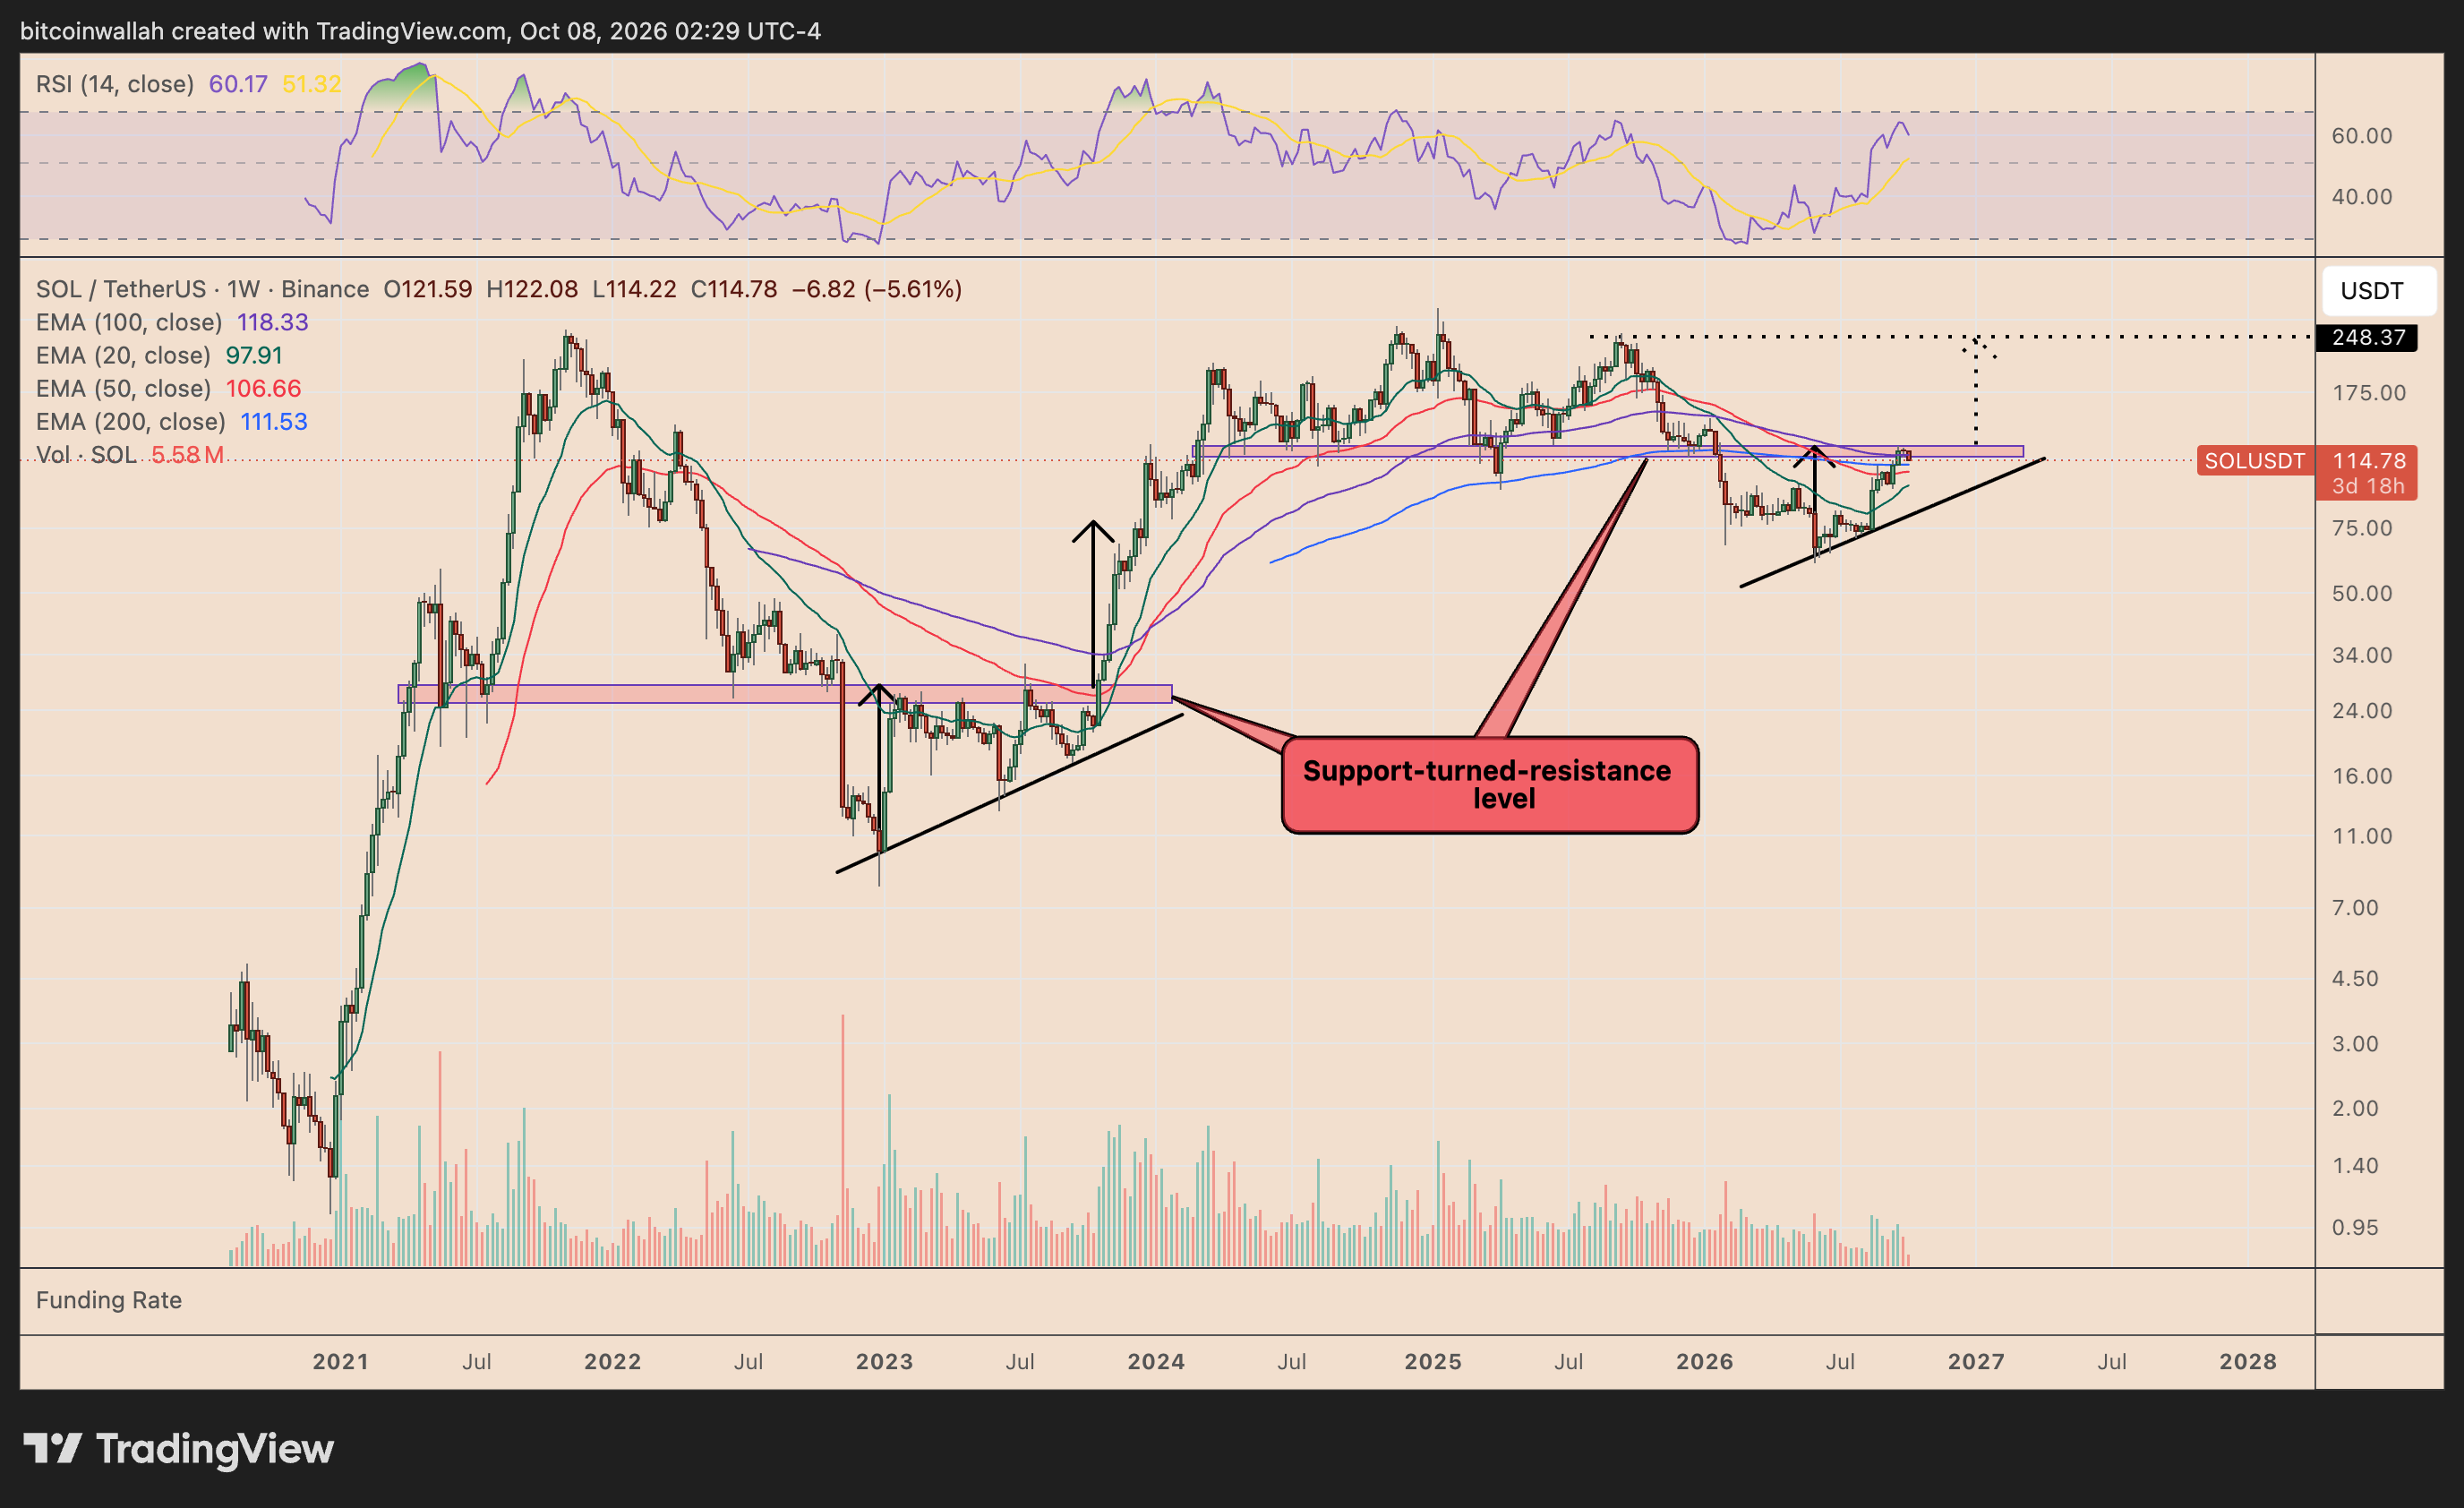
The resistance zone had previously acted as support before breaking down, much like the current $115–$125 region.
After several months of consolidation, SOL eventually reclaimed the resistance, triggering a rally toward $100 by early 2024 and subsequently toward $250.
A similar structure is developing in 2026, with SOL again forming higher lows beneath a former support-turned-resistance zone.
Under this fractal, a correction toward the rising trendline could represent another higher-low formation rather than the beginning of a sustained bearish reversal.
A successful rebound from that support, followed by a weekly breakout above $125, would strengthen the case for a longer-term advance toward $248, approximately 116% above current prices.
Conversely, a sustained breakdown below the ascending trendline would invalidate the bullish structure and increase the risk of a deeper correction.