
Russell 2000 Retreats As Traders Reposition Ahead of October FOMC
At the time of writing, the Russell 2000 is trading near $2,784, a drop of about 0.79% on the session. After reaching a high of 3,063 in August, 2026, the index has dropped more than 9% to where it is today, as many small-cap stocks experience a pullback from their record highs. Price now sits at the lower trendline of an ascending channel that has defined price action since April 2025.
The Russell 2000’s recent price drop matches the market’s current interest rate expectations, as the Fed hiked the federal funds rate on September 16 for the first time since 2023, shattering the dovish repricing that had driven the bullish rally of small caps from March into mid-August 2026. Prediction markets now show that there’s about a 72% probability that the Fed holds the already hiked rates in place, with another 24-25% probability of a further hike during the October 27-28 FOMC meeting.
It makes sense that the Fed’s hawkish faction would cool on hiking rates having secured that first increase since 2023 – a posture which strongly favors unchanged policy at the upcoming October meeting.
Small caps are rate sensitive, and seeing how the Russell 2000 is dedicated to tracking them, it makes sense that the index, along with the stocks in its portfolio, react strongly to Fed rate decisions. The index is also heavily weighted toward companies that have floating-rate debt and are dependent on refinancing for their survival – supporting a more bearish outlook for the index.

Will the Ascending Channel’s Bottom Trendline Hold?
A look at the Russell 2000’s daily chart reveals an ascending channel that has kept price within its boundaries for almost 79 weeks. Spanning as far back as April 2025, the channel’s lowest low, near $1,700, was formed as a result of price bouncing off a historic support band spanning from 1,631 to 1,715. The index has been strongly bullish ever since, breaking the 2,411 – 2,494 resistance band last December, and is poised to possibly retest it as support – if the ascending channels lower trendline fails to hold.
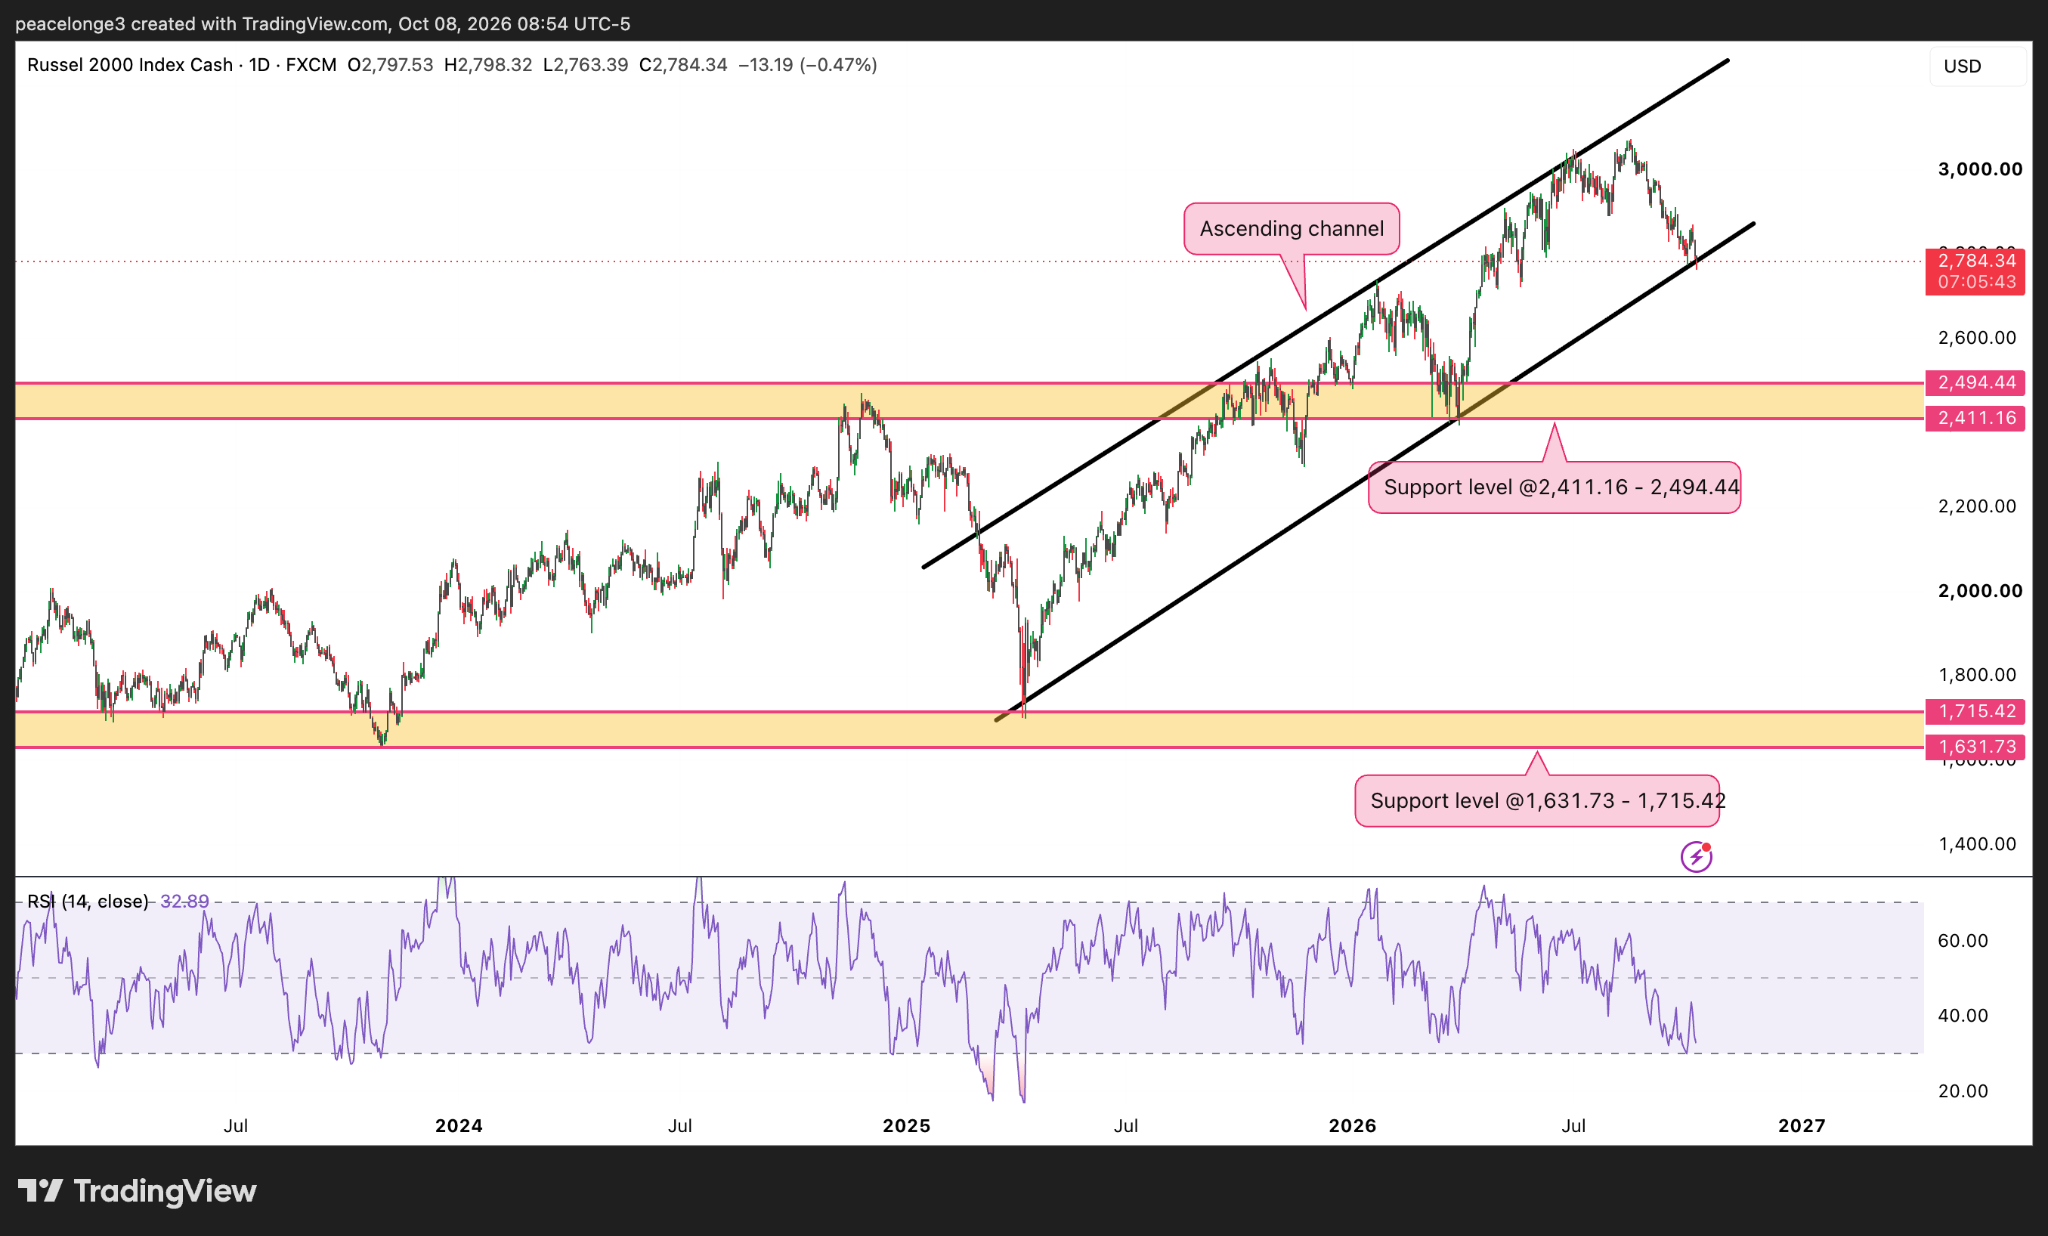
A clean break and close to the downside, below the channel’s lower trendline near 2,780, on the daily timeframe, will open the path to the 2,411 – 2,494 resistance-turned-support band. If, however, price fails to break that lower trendline and bounces upwards, we can expect a retest of the channel’s upper trendline near $3,166. A break and close above that level, beyond the upper trendline, will expose the path to price discovery, with the $3,200 psychological level being the next immediate target.
The RSI reads 32.89, way below the 50 average and sitting right at the edge of the oversold zone. This shows that near-term selling pressure is stretched and an upward bounce may soon happen. A reclaim of the 40 – 50 RSI levels will give more conviction to the bullish case.
The October FOMC and the Thesis Around It
The FOMC meeting on the 27th and 28th of October is the next key factor to watch out for, as the market is beginning to price in a higher chance of a hold on rates with a slight possibility of another hike. The Russell 2000 enters the decision meeting with little hope for a renewal of the dovish tailwind that pushed it to record highs earlier this year.
If the Fed maintains its hawkish position, we can expect price to break the channel and push lower to the 2,494 level. A dovish surprise on the other hand can raise rate cut expectations going into December, which could relieve some of the index’s selling pressure and push its price back into the 3,000 – 3,100 range.
Domestic Economic Resilience vs. Sticky Inflation
Other macroeconomic forces driving where the Russell 2000 goes are economic resilience and sticky inflation. The index is significantly exposed to industrials, financials, and materials compared to tech-heavy large-cap indexes – and the underlying U.S. economy remains resilient, with a projected GDP growth of over 2%, which supports revenue performance of the Russell’s highly domestic small caps.
The downside to this domestic strength, however, is sticky inflation, which has been exacerbated by rising energy costs and bottlenecks in the supply chain. And the higher the cost of operating a business, the thinner the company’s margins become – which usually happens much faster to small caps than they do to cash-rich multinationals.