BNB (BNB) could decline another 25% toward $540 in the coming weeks as a bearish broadening wedge pattern develops on its three-day chart.

BNB Broadening Wedge Points to $540 Downside Target
BNB was trading near $742 on Oct. 9, down about 4.8% over the latest three-day candle after failing to sustain its recovery toward $800.
The pullback comes as BNB approaches the upper boundary of a broadening wedge, a technical structure characterized by two diverging trendlines connecting progressively higher highs and lower lows.
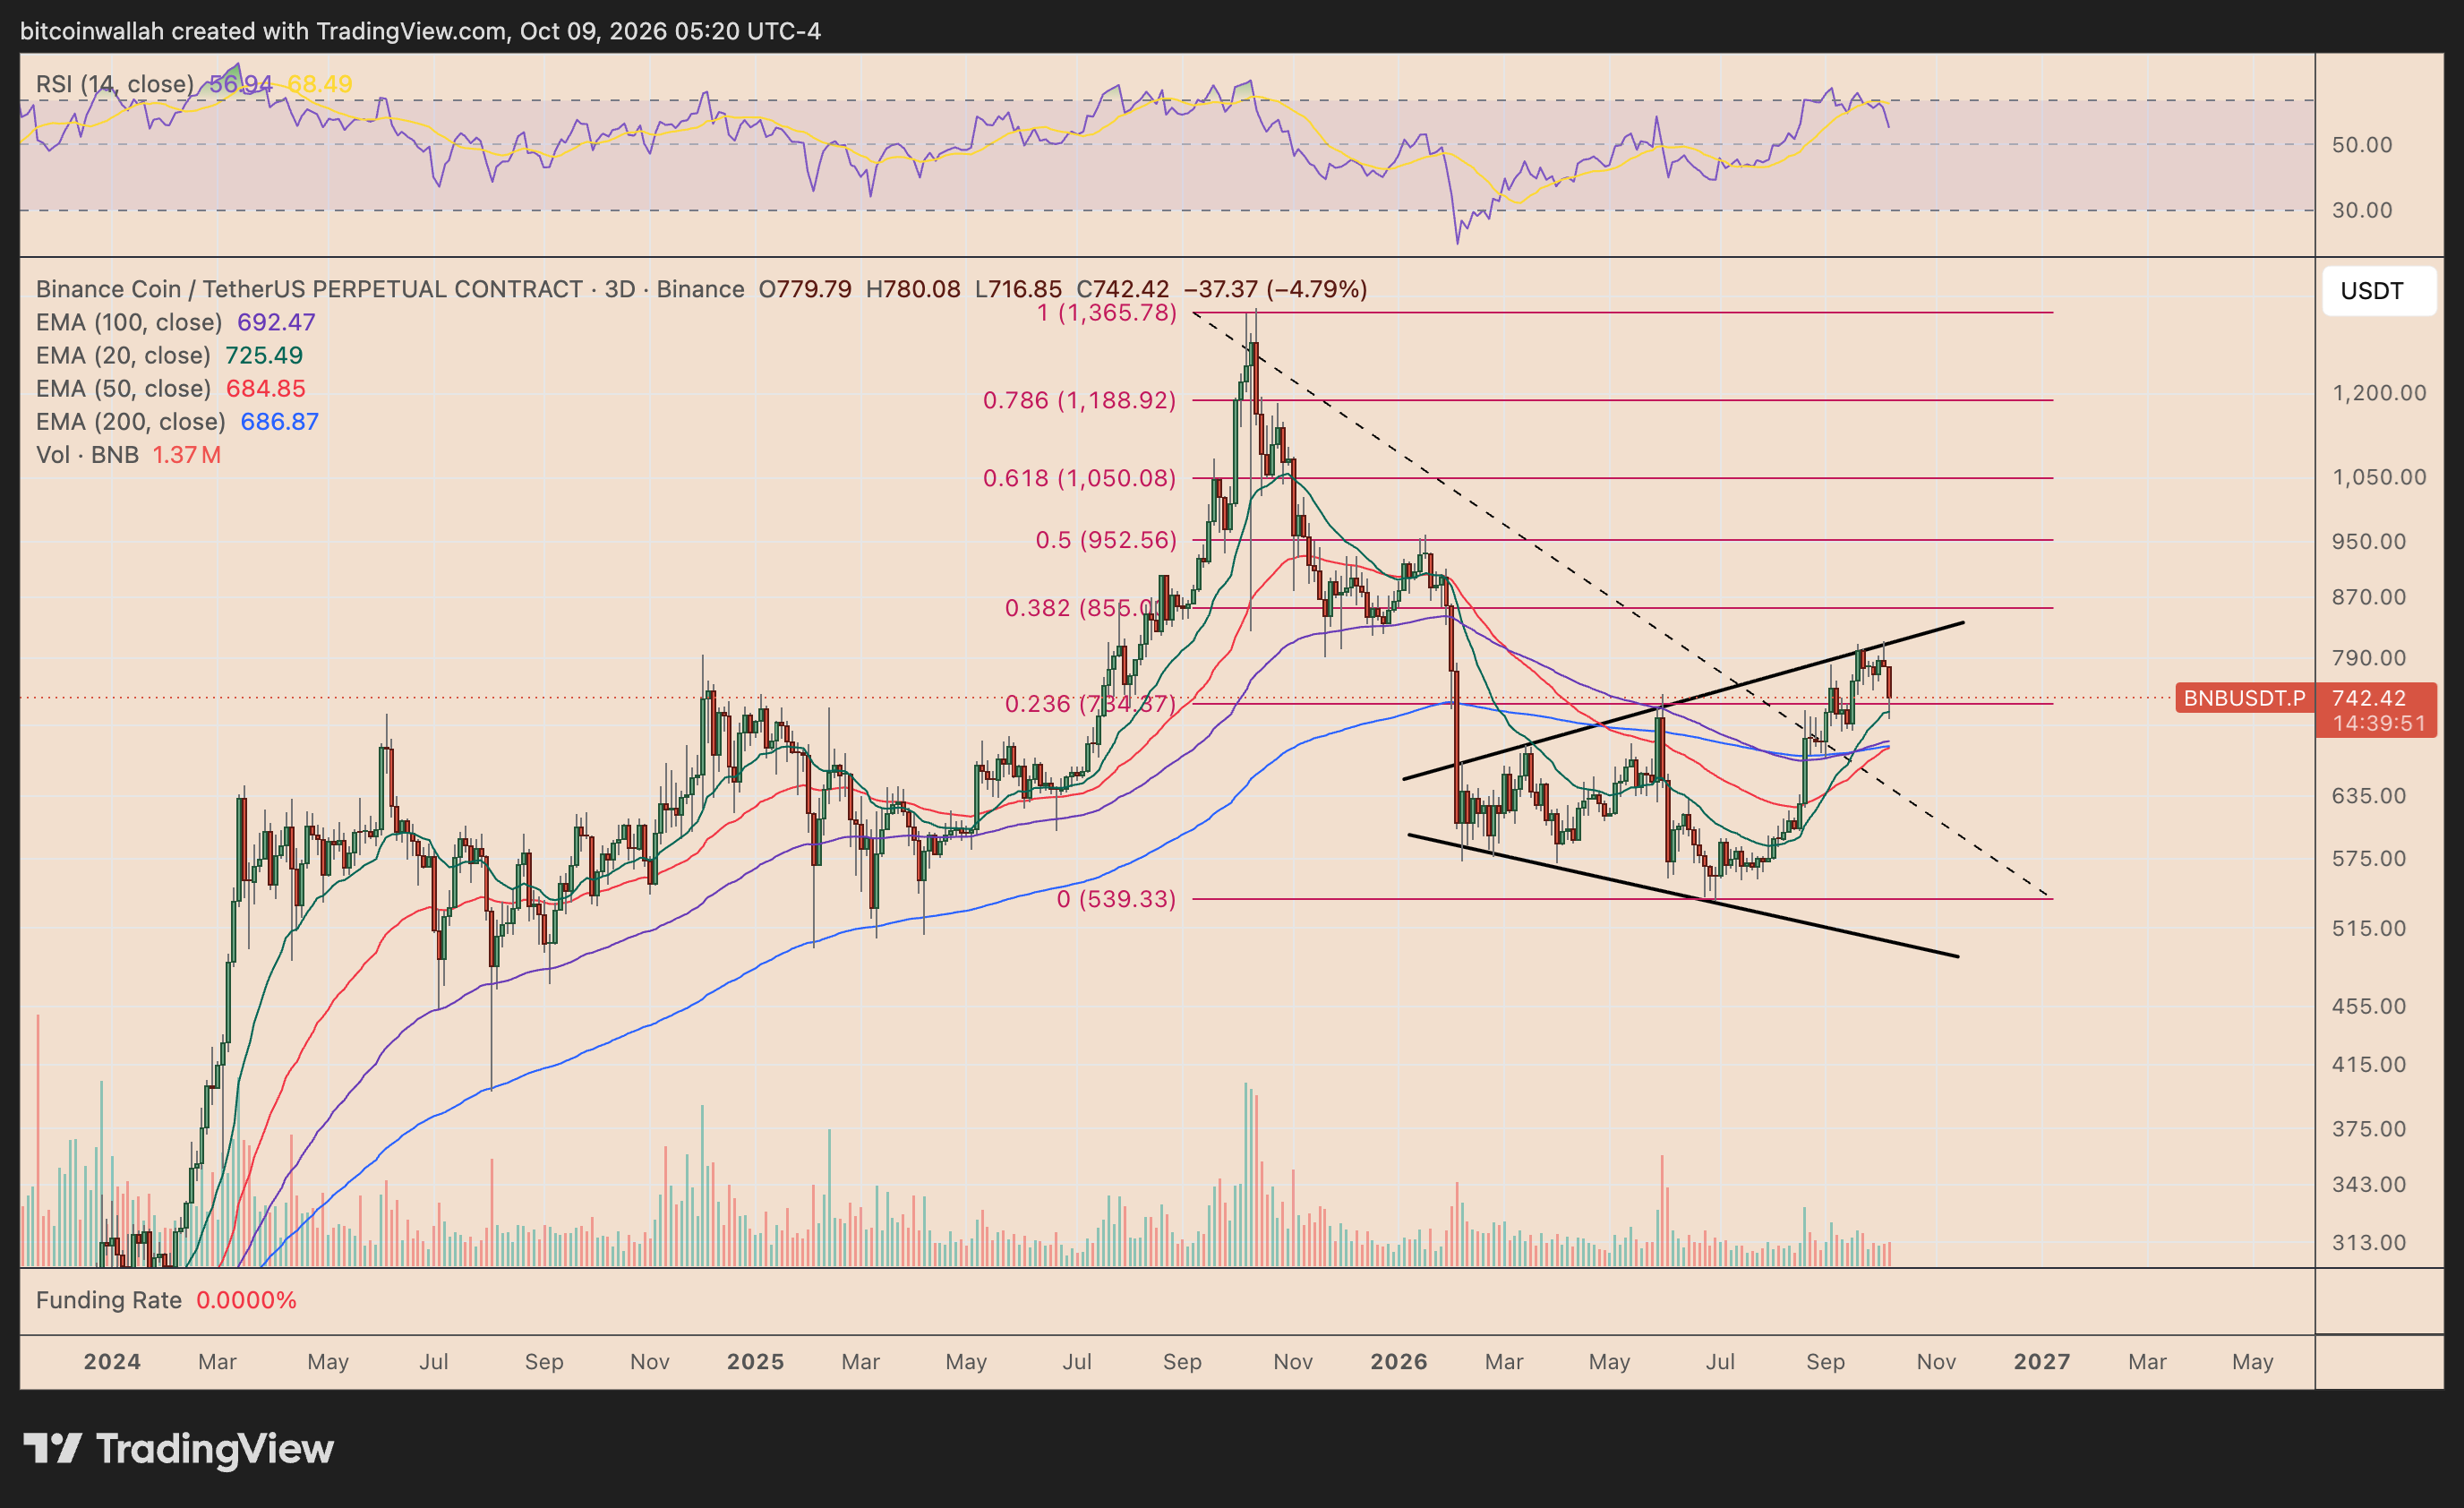
The pattern has developed since early 2026, with its upper boundary currently acting as resistance near $830–$850 and its lower trendline extending toward the $500–$540 region.
BNB’s latest rejection near $800 increases the possibility of a reversal toward the wedge’s lower boundary.
The downside target coincides with the 0 Fibonacci retracement level near $539.33, reinforcing the region as a potential support confluence.
However, sellers must first push BNB below the 0.236 Fibonacci level at $734.37 to strengthen the bearish outlook.
A decisive breakdown could accelerate selling toward the cluster of exponential moving averages between $685 and $725, followed by the $600 psychological support level.
Meanwhile, the relative strength index (RSI) has retreated from near-overbought territory, suggesting bullish momentum is weakening.
Conversely, a sustained rebound above $800, followed by a breakout past the wedge’s upper trendline, would weaken the immediate bearish scenario and put the 0.382 Fibonacci level near $855 in focus.
Federal Reserve Minutes Add to BNB Downside Risks
BNB’s bearish technical setup also coincides with renewed uncertainty over the Federal Reserve’s interest-rate outlook.
The minutes of the Fed’s September meeting, released on Oct. 7, showed that policymakers unanimously raised interest rates by 25 basis points to 3.75%–4.00%.
Most officials also anticipated another rate hike before year-end, as persistent inflation remained a concern.
The hawkish outlook has contributed to rising US Treasury yields, increasing the opportunity cost of holding non-yielding assets such as BNB.
Higher borrowing costs can also reduce liquidity and speculative demand across the cryptocurrency market, potentially reinforcing BNB’s broadening wedge correction.
However, policymakers appear reluctant to rush into another increase at their Oct. 27–28 meeting, with market expectations favoring a pause and a possible December hike.
A less aggressive Fed could help BNB defend its nearby support levels. Conversely, stronger inflation data or increasingly hawkish policy signals would strengthen the case for a decline toward the wedge’s $540 downside target.