Yield Pressure Pulled Stocks Off the Records
The stock market is lower Wednesday because the bond market started moving again. Treasury yields climbed back toward their highs, oil pushed higher and buyers stopped chasing Tuesday’s record session in the Nasdaq and S&P 500.
A small rebound is building ahead of the Fed minutes. It doesn’t look like buyers are taking control. The selling was broad, rate-sensitive groups got hit and the internal numbers were weak well before the afternoon events.
The 10-year Treasury yield reached 5.356%, more than 8 basis points higher on the session and above Monday’s high. The 30-year yield climbed to 5.725%, its highest level since 2002. Brent crude moved back above $100 a barrel, while U.S. crude held near $90.
That’s enough to make traders question how much more upside is left in the record-setting indexes with the cost of money still moving higher.
At 17:59 GMT, the Dow Jones Industrial Average is trading at 51,210.20, down 311.08 or -0.60%. The S&P 500 Index is at 7,801.26, down 17.67 or -0.23%, while the Nasdaq Composite Index is trading at 27,491.51, down 105.373 or -0.38%.
The Long End Is Back in Charge
Friday’s weak payrolls report cut the odds of an October hike and took the steam out of short-term rates. Long-dated Treasuries never got that relief.
The 10-year and 30-year are trading a different set of worries, mainly inflation and heavy government borrowing. That trade is putting pressure on stocks again.
The New York Fed’s September consumer survey gave bond sellers another reason to stay active. The median one-year inflation outlook jumped to 3.9% from 3.6% in August, the highest since May 2023. Expected household spending growth hit 5.5%, also the highest since May 2023.
Nobody’s rushing to buy 10-year notes around 5.35% off numbers like that.
Oil is part of the same trade. Brent above $100 keeps inflation concerns alive while the Middle East supply situation remains unsettled. Stocks got their records Tuesday on cheaper oil and softer yields. Both turned on them Wednesday.
S&P 500 Price Forecast
Every new S&P 500 analysis as it publishes, today's technical signal and key levels, live price — on one page.
See all S&P 500 forecastsWednesday’s Bond Auction Gets the First Word
Treasury is selling $39 billion of 10-year notes Wednesday into a bond market that’s been holding out for higher yields for weeks.
The auction puts real demand in front of the market. Traders get to see in one afternoon whether buyers are ready to step in at these levels.
The Federal Reserve releases minutes from its September meeting at 18:00 GMT. Everybody knows about the 25-basis-point hike. The interest is in how much support it had and what officials made of the climb in long-term yields.
Both matter because a December increase is still priced in, even with October looking much quieter.
Chips, Banks and Housing Felt the Yield Move
Technology was under pressure again, especially the chip group that helped carry the Nasdaq to Tuesday’s record. Nvidia was down 0.9% and the Philadelphia Semiconductor Index fell 1.9%.
SpaceX dropped 2.1% after reports said the company is seeking $40 billion in financing to fund purchases of Nvidia chips. The report gave traders another reason to take money out of a group that has already had a strong run.
Higher long-term yields make the AI buildout a tougher sell. Traders get a lot more selective with the 10-year at a 24-year high.
Banks were lower as well. Goldman Sachs and Citigroup fell nearly 2%, while Bank of America, Wells Fargo and JPMorgan each lost around 1%. Higher rates don’t help much when they start raising questions about lending and growth.
Housing stocks took a harder hit. The housing index fell 3.1% to a 17-month low. That’s the rates trade in its purest form. Mortgage-sensitive stocks don’t need a new earnings problem when the 10-year yield is above 5.35%.
The Selling Was Broader Than the Index Move
Eight of the 11 S&P 500 sectors were lower, led by materials and industrials. The decline was not limited to a few megacap technology names.
Decliners beat advancers by more than four-to-one on the New York Stock Exchange and better than two-and-a-half to one on the Nasdaq. The Nasdaq logged 193 new lows against just 15 new highs.
That is not strong breadth for a market that was making records a day earlier.
The equal-weight S&P 500 is still almost 6% below its own record high. The Russell 2000 remains more than 10% below its August high. The capitalization-weighted indexes can keep moving when the largest technology names lead. The rest of the market is not confirming the move.
There are still stock-specific trades working. That is different from a broad risk-on bid. The index trade needs buyers comfortable owning the whole market with yields at these levels. Wednesday says they are not there yet.
Earnings Have a High Bar to Clear
Third-quarter earnings season begins next week. Analysts expect aggregate S&P 500 earnings growth of 30.6% from a year ago, led by an estimated 114.7% gain for energy companies and a 66.5% increase for technology.
That’s a bar companies have to clear with very little room for misses.
The AI group has already been rewarded for the revenue potential tied to data centers, chips, software and power demand. Energy companies are heading into earnings with crude above $100. The numbers are good. A market trading against 5%-plus long-term yields needs companies to prove the optimism was justified.
Daily December E-mini Nasdaq-100 Index Futures Technical Analysis
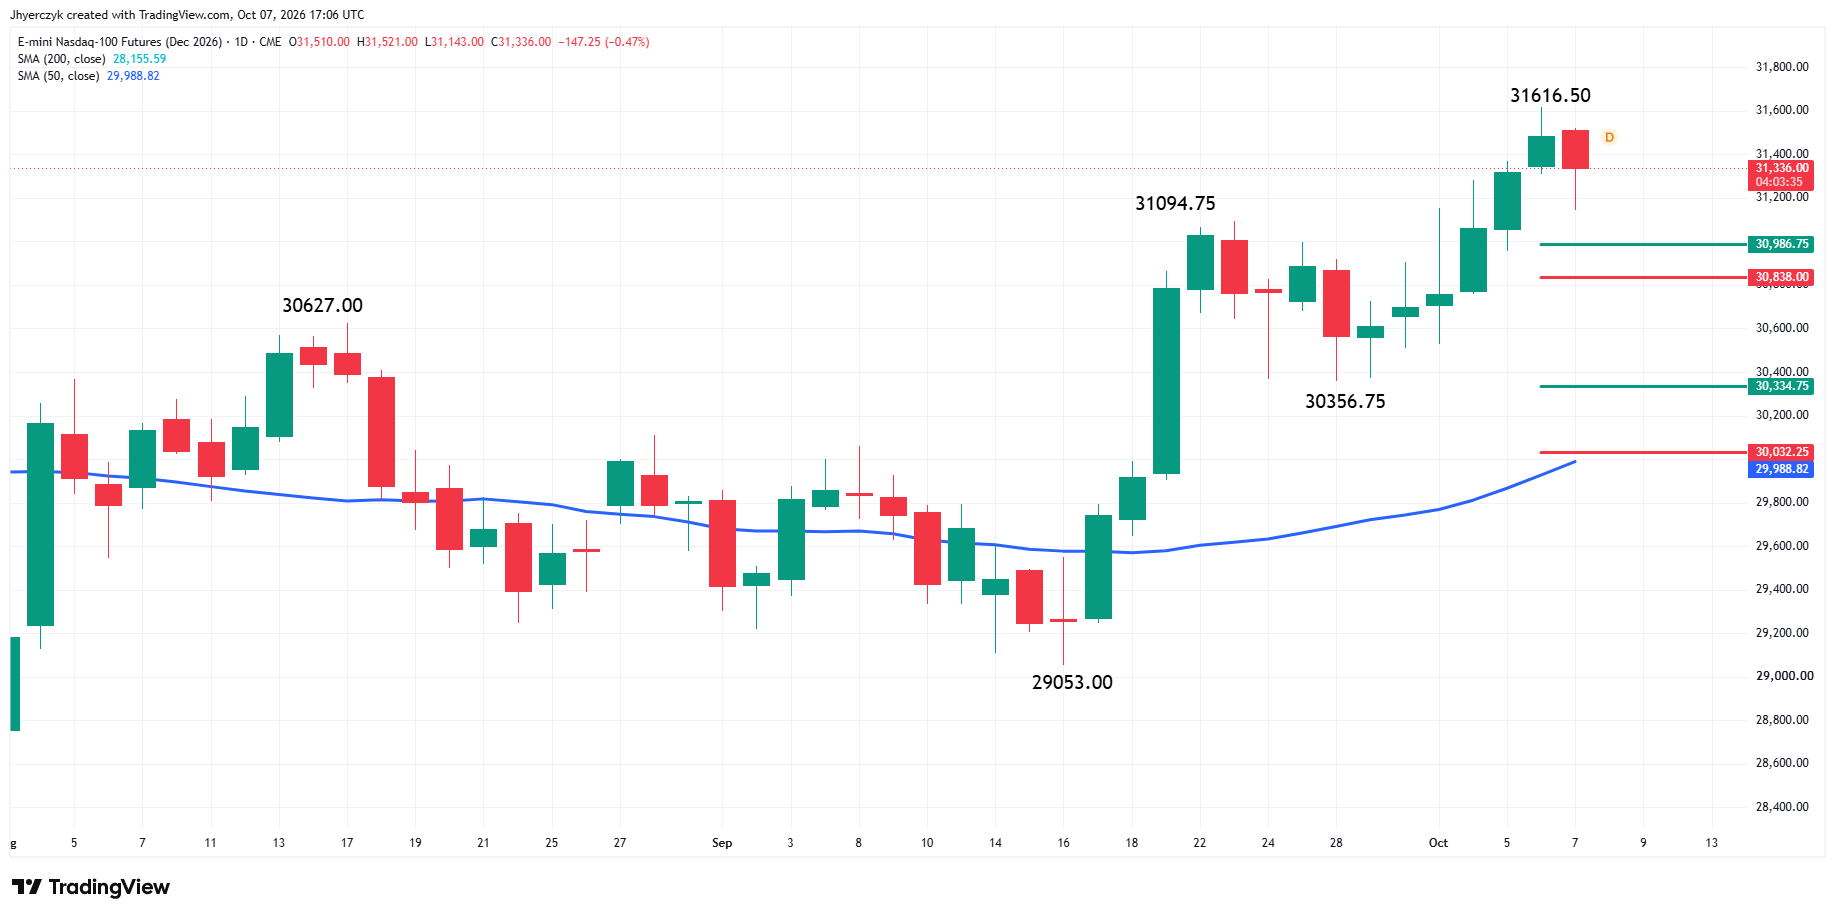
December E-mini Nasdaq-100 Index futures are trading lower Wednesday after posting a new record high at 31,616.50. The main trend is up according to the daily swing chart. A trade through 31,616.50 will reaffirm the uptrend, while a move through the main bottom at 30,356.75 will change the main trend to down.
The current weakness looks like a counter-trend pullback inside the uptrend. The first downside target is the retracement zone at 30,986.75 to 30,838.00. This is the 50% to 61.8% retracement area of the rally from 30,356.75 to 31,616.50.
If buyers defend that area, the pullback remains contained and the focus stays on a retest of 31,616.50. A break through 30,838.00 could extend the correction into 30,334.75, followed by the 50-day moving average at 29,988.82.
Daily December E-mini S&P 500 Index Futures Technical Analysis
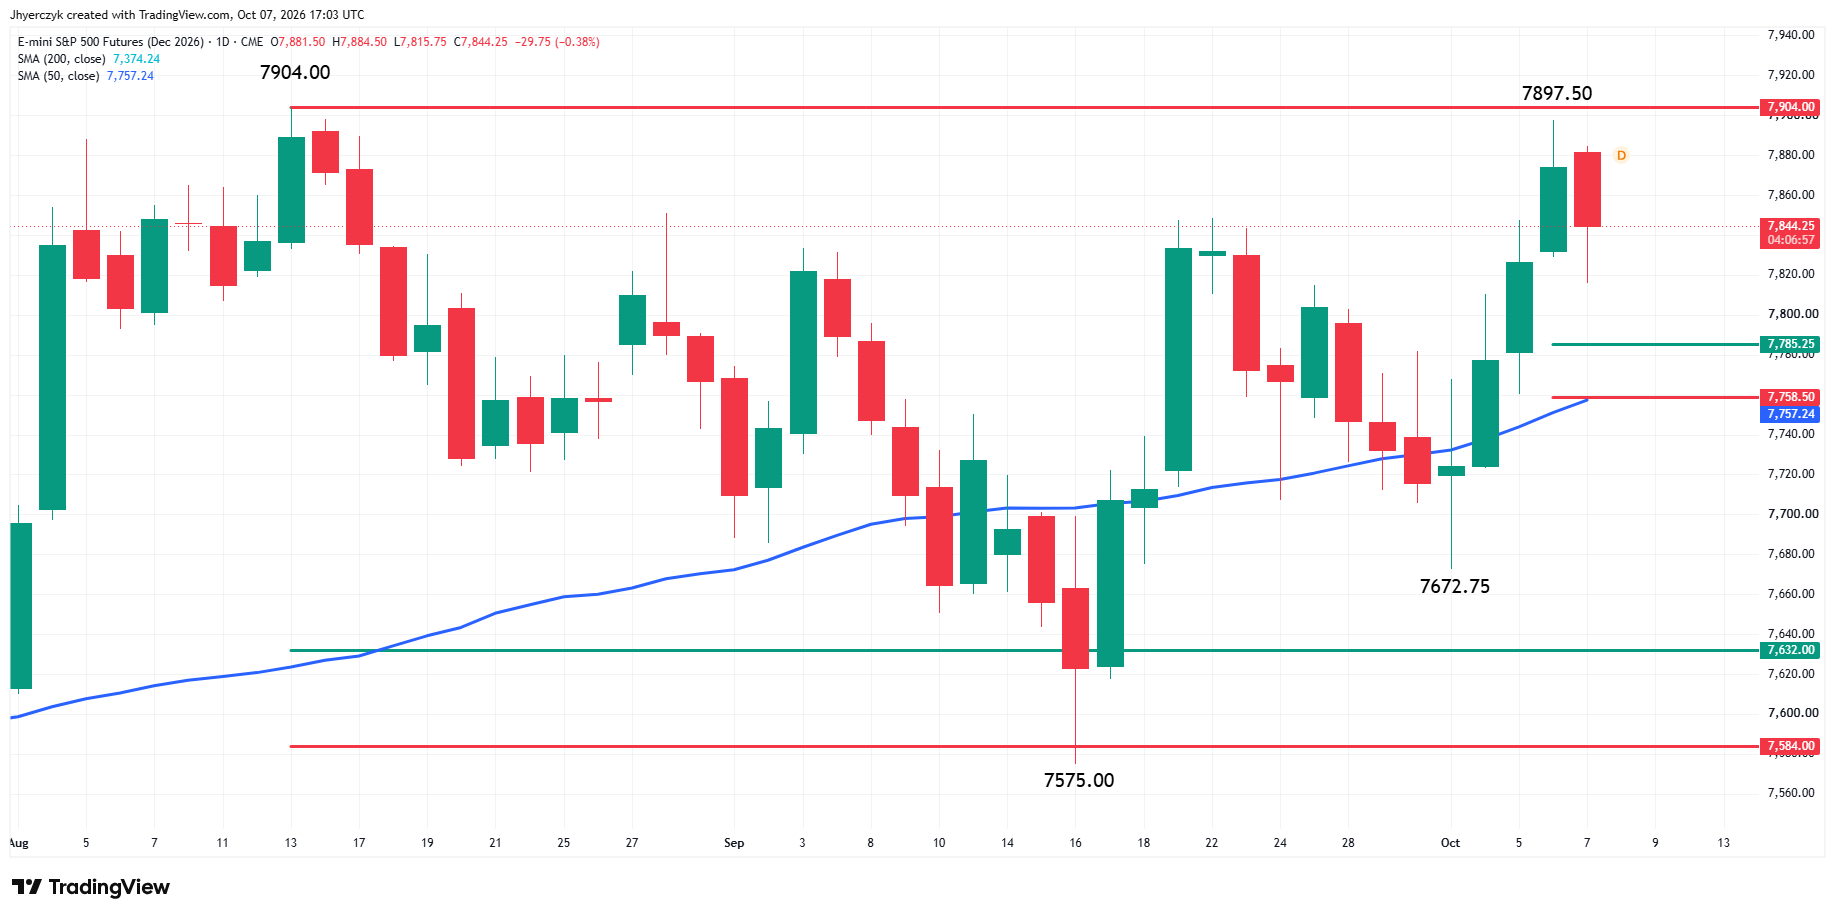
December E-mini S&P 500 Index futures are lower Wednesday after falling short of the August 13 main top at 7,904.00. The main trend is up according to the daily swing chart. A trade through 7,904.00 will reaffirm the uptrend. A move through the swing bottom at 7,672.75 will change the main trend to down.
Wednesday’s high at 7,897.50 creates a new minor top. The current selling is a counter-trend pullback unless the market takes out the main bottom.
The first downside target is the retracement zone at 7,785.25 to 7,758.50. The 50-day moving average at 7,757.24 is sitting just under the lower boundary, creating a key support cluster.
A recovery through 7,897.50 puts 7,904.00 back in play. A break through 7,758.50 would signal a deeper correction toward 7,672.75, but it would not change the main trend unless that bottom fails.
What to Watch
Bonds speak first Wednesday with the 10-year auction. The Fed minutes land after it, with a December hike still in the price and consumers telling the New York Fed they expect more inflation. The stock market is reacting to the yield move, not breaking down on an earnings story. The small bounce ahead of the minutes hasn’t brought the broad market with it.
December E-mini Nasdaq-100 futures are pulling back from the 31,616.50 record. The bias is bullish while the market holds above the 30,986.75 to 30,838.00 retracement zone. Sellers need to take out 30,356.75 to change the main trend.
December E-mini S&P 500 futures stalled at 7,897.50 Wednesday, just short of the August 13 top. The bias is bullish while buyers hold the retracement zone and the 50-day moving average.
More Information in our Economic Calendar.