
Rare Bollinger Band Signal Points to Short-term Caution
On August 4 and 5, the Dow recorded two consecutive daily sessions in which both the open and close were entirely above the upper 20-day, 2-standard-deviation Bollinger Band. The second session formed a classic shooting star candlestick—small real body near the lows of the range and a long upper wick. See Figure 1 below.
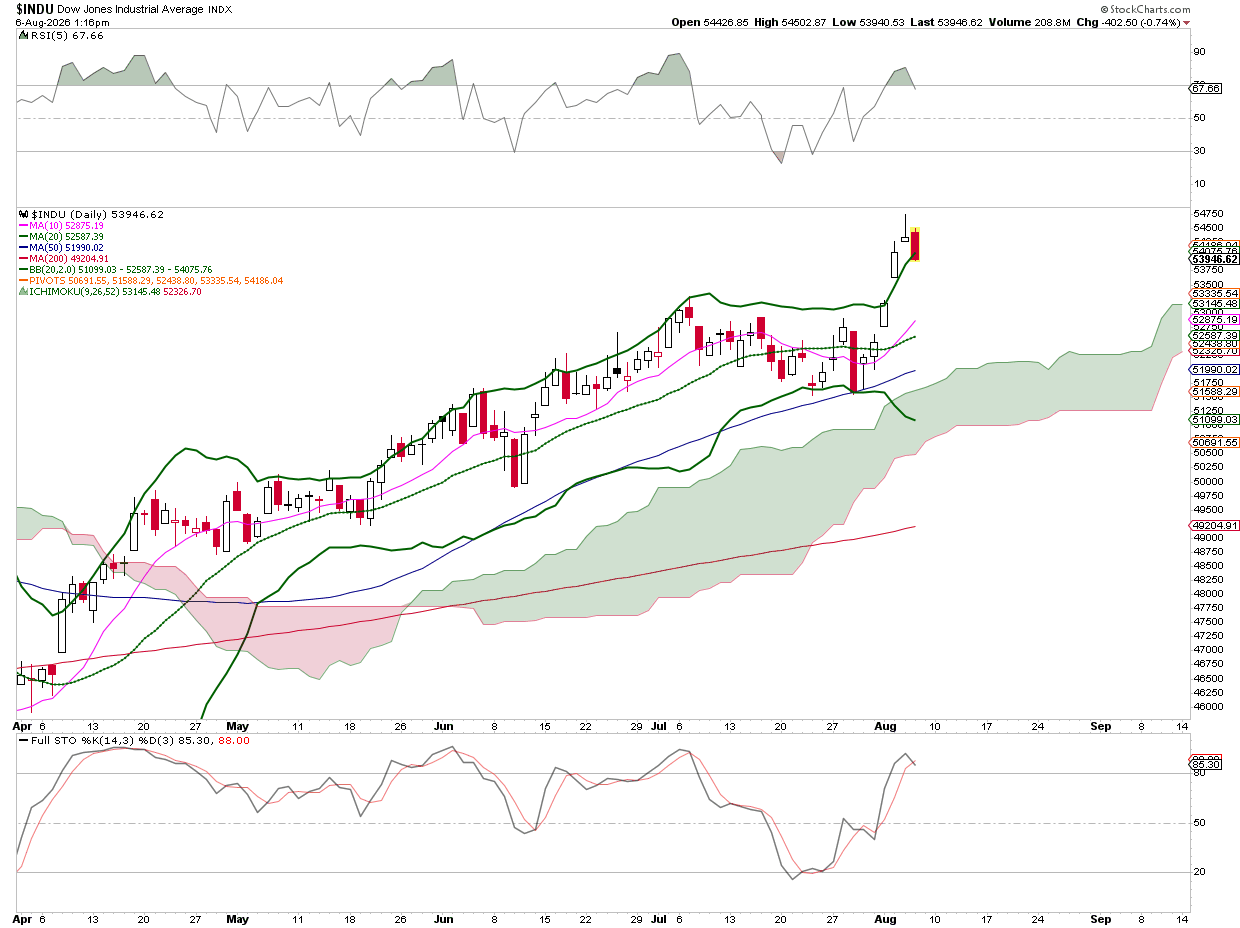
This exact combination is extremely rare. Historical scans of the Dow (and its ETF proxy, DIA) since the early 1990s, using GROK and CHATGPT, reveal only a handful of comparable instances. In the completed cases, the index showed mild-to-average weakness over the subsequent 1- to 20-day periods, consistent with short-term mean reversion after an extreme stretch. See Table 1 below.
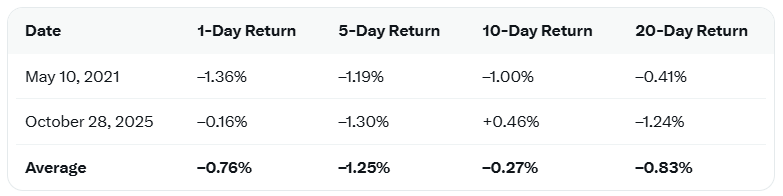
The August 5 shooting star closed fully outside the upper band, and short-term momentum indicators were also stretched (RSI-5 near 81 and the full stochastic near 92). Volume in that session was slightly below its longer-term average, reducing conviction in the rejection but not eliminating the warning. By the following session, the Dow was already trading lower, with price moving back inside the upper Bollinger Band—early confirmation of the pattern’s typical follow-through.

Breadth Adds Another Layer of Caution
Supporting the technical caution is the NYSE McClellan Oscillator (Ratio-Adjusted). See Figure 2 below. The indicator did not reach the deep oversold levels (highlighted by green boxes on the accompanying chart) last week or in May that have historically marked lasting market bottoms: below at least -60; preferably<-80 to -100. Instead, it is currently at neutral levels—as seen in early 2026 (black boxes).
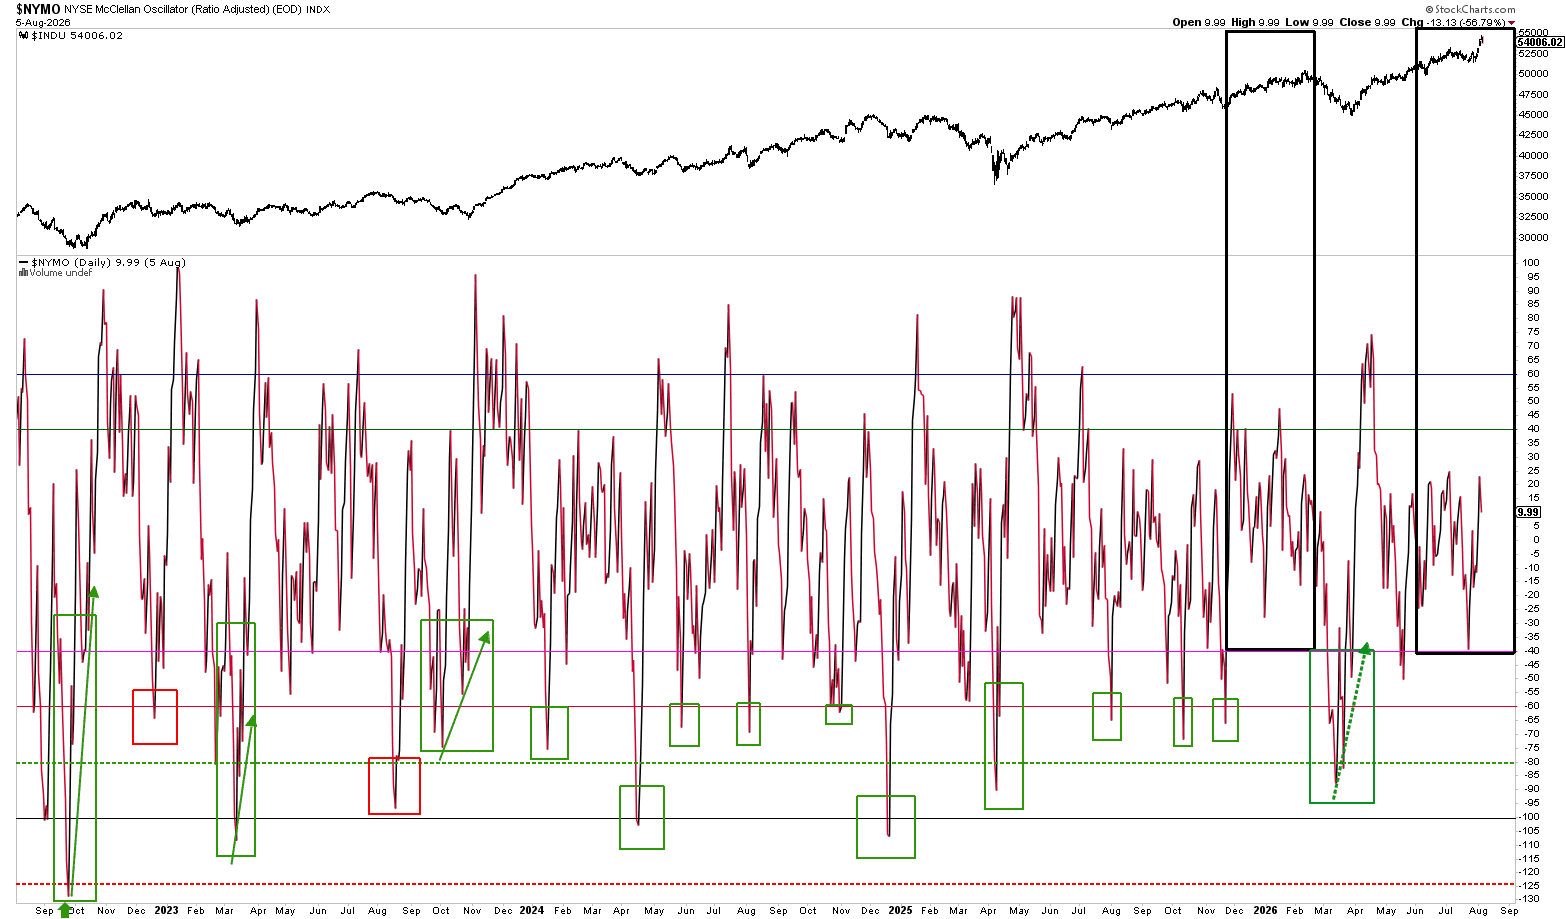
Those earlier neutral periods coincided with advances that ultimately stalled due to lack of broad participation. The same dynamic appears to be unfolding now: price strength in the Dow is occurring without the kind of widespread buying that typically sustains a durable rally.
Thus, the rare two-day Bollinger Band extreme capped by a shooting star, paired with neutral and non-oversold breadth readings, points to a short-term cautionary setup. While the primary trend remains higher, the combination suggests the recent rally is vulnerable to a pause or mild pullback, as participation remains limited. Investors may want to watch for further confirmation via a break below the shooting-star low or a continued drift toward the middle Bollinger Band.