Ethereum’s native token, Ether (ETH), has staged a sharp V-shaped recovery from its June lows. Still, the rebound is now running into a major long-term resistance level that previously preceded a deeper market correction.

ETH Tests 2020-Era EMA Resistance
As of Tuesday, Sept. 1, Ether was trading near $2,460, up approximately 70% from its 2026 lows.
In doing so, the price came closer to its 100-week exponential moving average (100-week EMA, purple) near $2,554. The level could determine whether ETH’s recovery develops into a broader bullish reversal or loses momentum in the coming weeks.
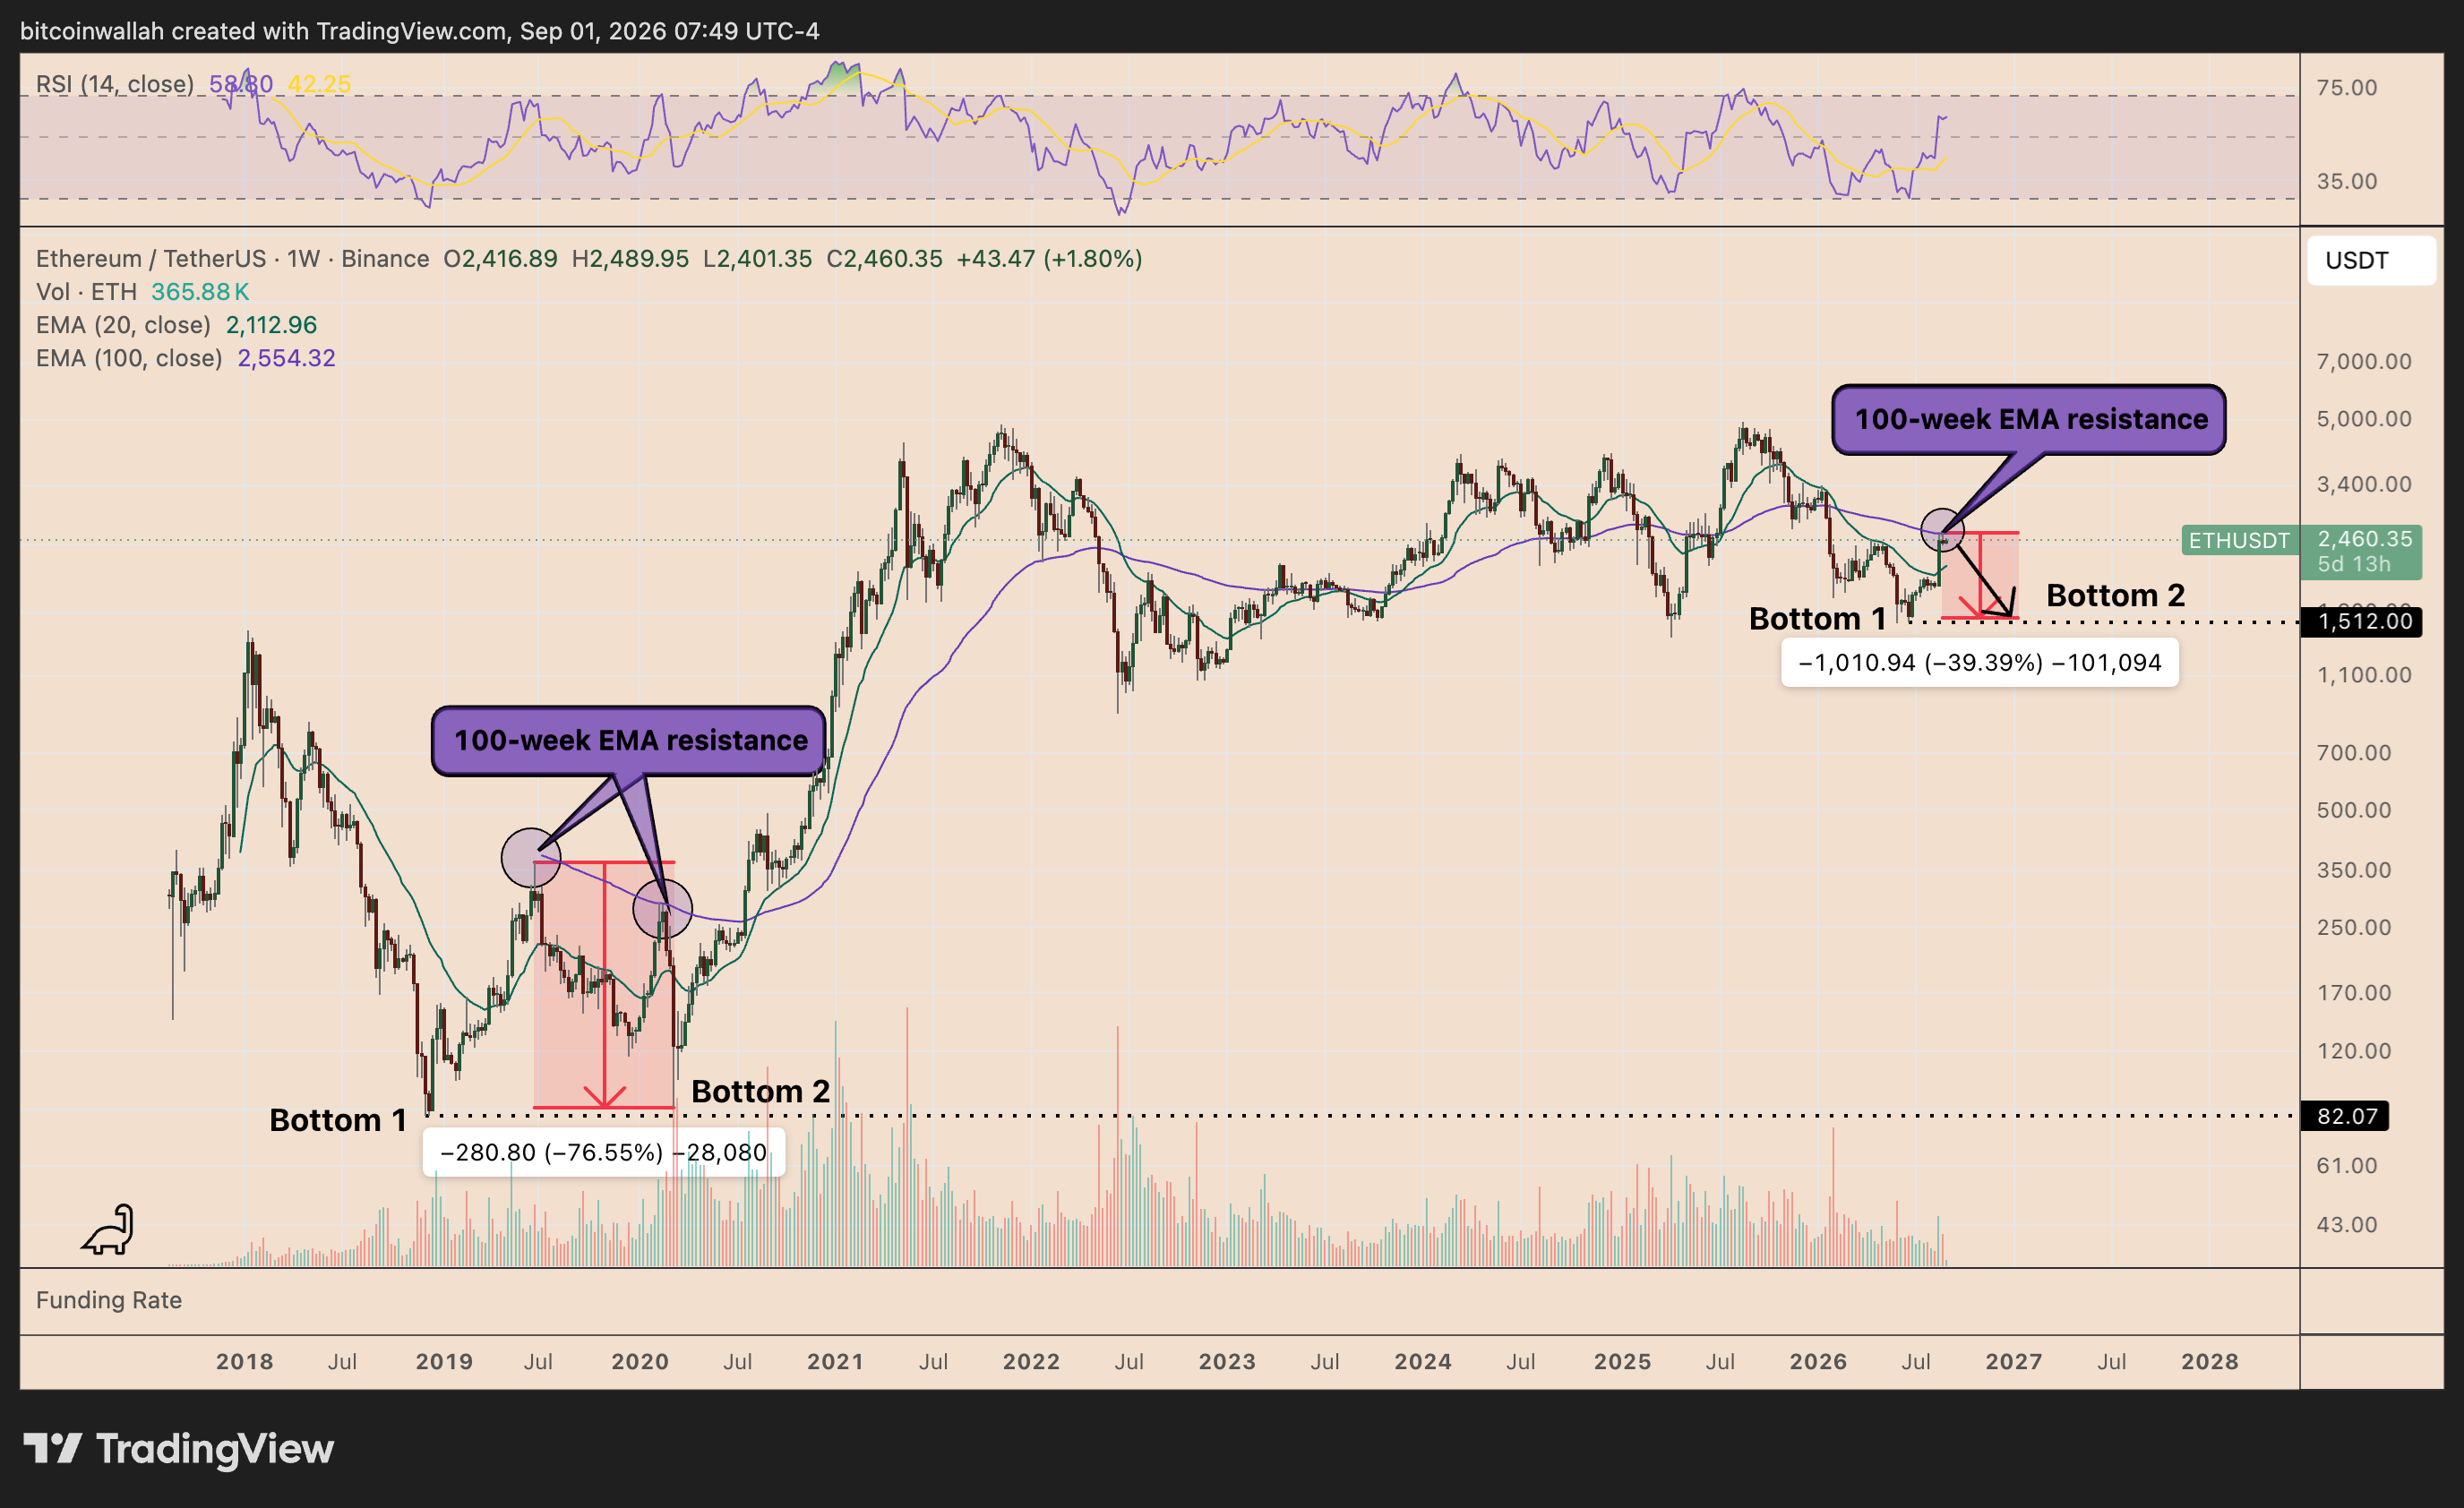
A similar setup appeared during Ethereum’s 2019–2020 market cycle. ETH rebounded sharply after bottoming near $82 in late 2018 but struggled to sustain gains above its 100-week EMA during subsequent recovery attempts.
Repeated rejection from the moving average eventually preceded another major selloff, culminating in Ethereum revisiting roughly the same $82 support region during the March 2020 market crash.
Ethereum’s current structure bears some resemblance to that period.
After establishing what could become its first major bottom around $1,500, ETH has recovered toward the 100-week EMA but has yet to reclaim it convincingly.
A rejection near $2,500–$2,550, followed by a break below the 20-week EMA near $2,113, could strengthen the bearish fractal.
That could expose ETH to a deeper correction toward $1,500–$1,550, roughly 40% below the 100-week EMA resistance.
Still, the weekly relative strength index (RSI) remains constructive near 59. A decisive close above the 100-week EMA would weaken the bearish setup and favor further recovery.
Ethereum Price Forecast
Every new Ethereum analysis as it publishes, today's technical signal and key levels, live price — on one page.
See all Ethereum forecastsETH Liquidity Map Strengthens Downside Risk
Ethereum’s one-month liquidation heatmap adds another bearish layer to the technical setup, showing substantially more leveraged liquidity below the current price than above it.
A rally toward $2,650 could liquidate more than $856 million in short positions. However, a decline toward $1,760 could wipe out roughly $3.79 billion in leveraged longs, creating a much larger downside liquidity pool.
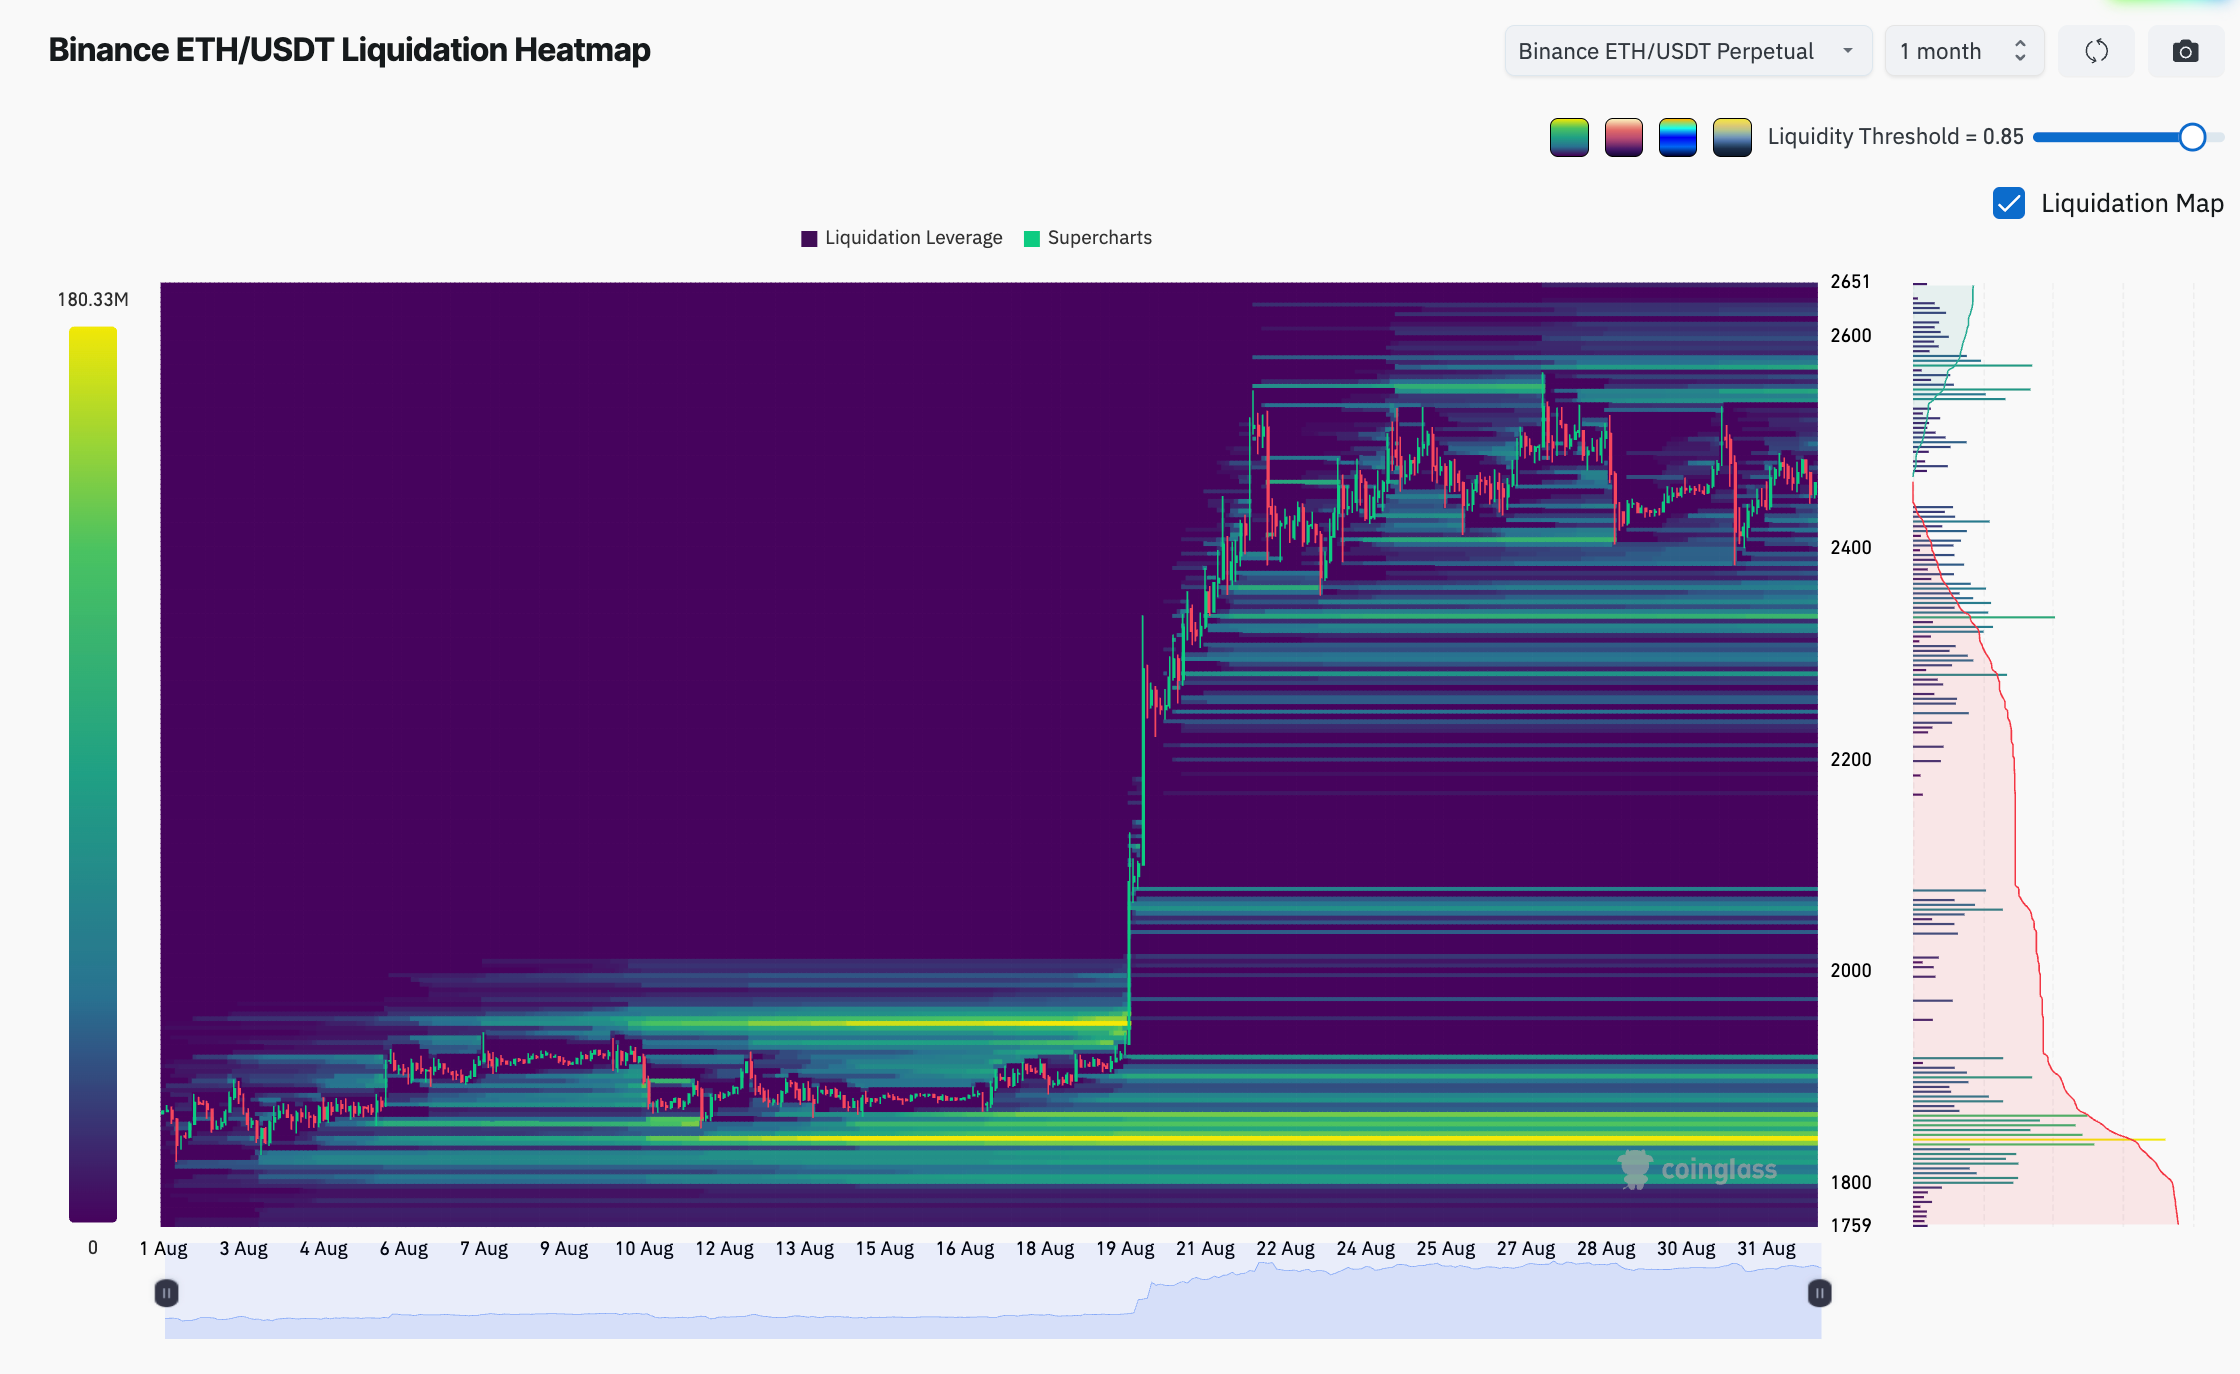
The strongest individual liquidation cluster sits near $1,840 (the yellow zone), where about $180.33 million in long positions are at risk. This concentration could act as a potential liquidity magnet during a broader correction.
Therefore, a breakdown below key technical support could accelerate ETH toward the $1,840–$1,760 region before the deeper $1,500 fractal target comes into focus.