


EUR/USD Technical Analysis
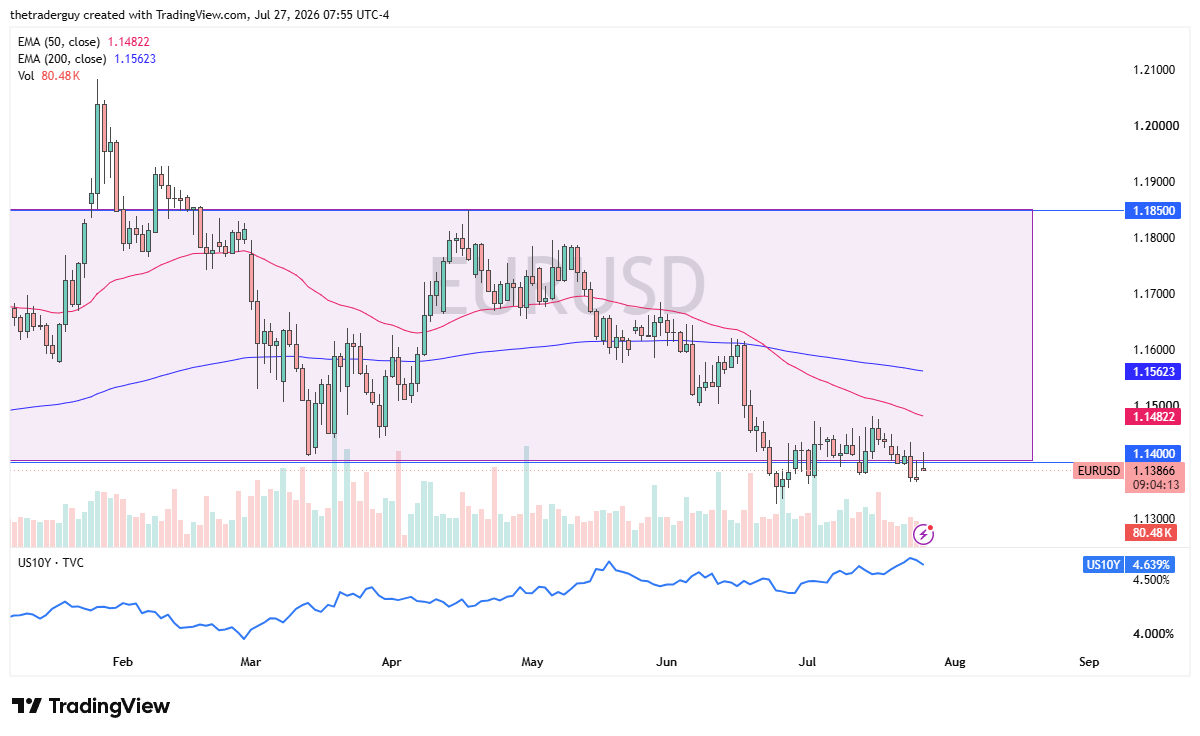
The euro gapped higher against the US dollar and then took off as the conflict in the Middle East seems to be slowing down again. That being said, with those falling yields in America, it makes sense that the dollar lost a little bit of strength, but we’ve seen selling of the euro come back into play, which makes sense. And now it looks like we are possibly continuing this choppy and volatile negative behavior. The 1.14 level continues to be an area of interest as we are just simply bouncing around with the latest headlines.
GBP/USD Technical Analysis
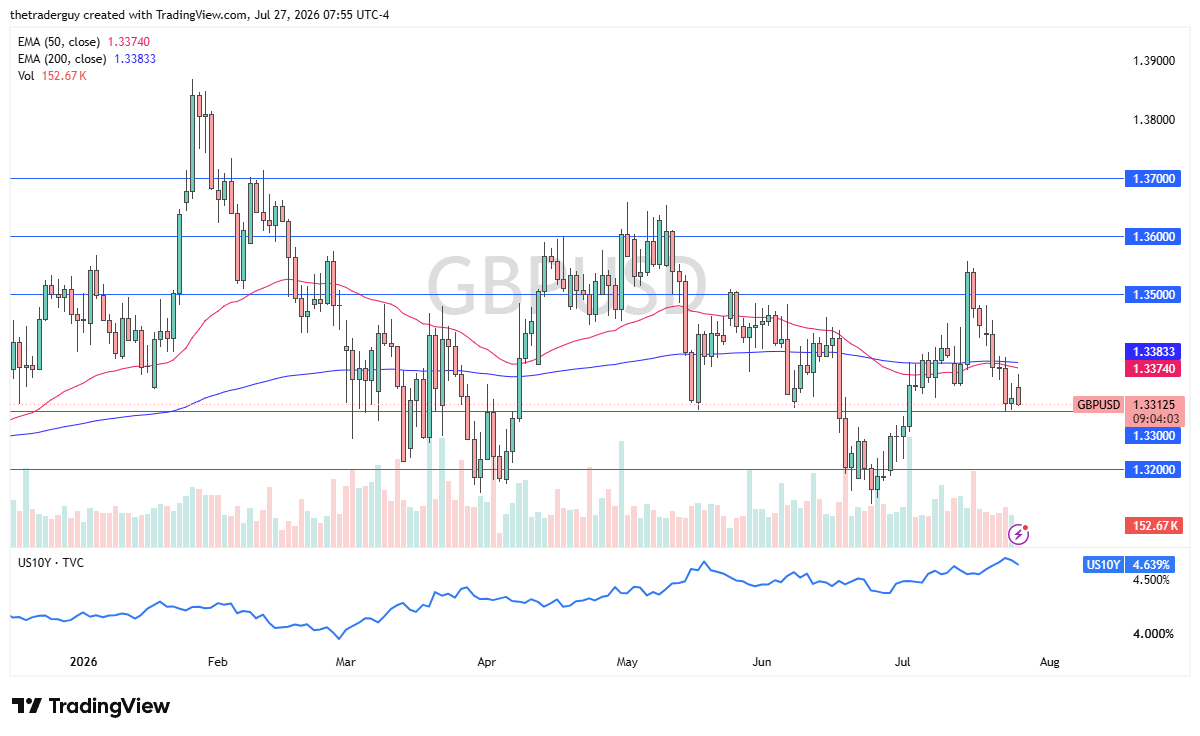
The British pound took off to the upside, gapped higher to kick off the session, reached the area of the 50-day EMA, and then turned around to show signs of negativity. We find ourselves sitting just above the 1.33 level again. This is an area that has been important multiple times. At this juncture, it looks like support, but if the market breaks down below there, it could lead to fresh selling. We’ll just have to wait and see. Rallies at this point continue to see selling pressure, as we have earlier this morning, based on the last week or so.
USD/JPY Technical Analysis
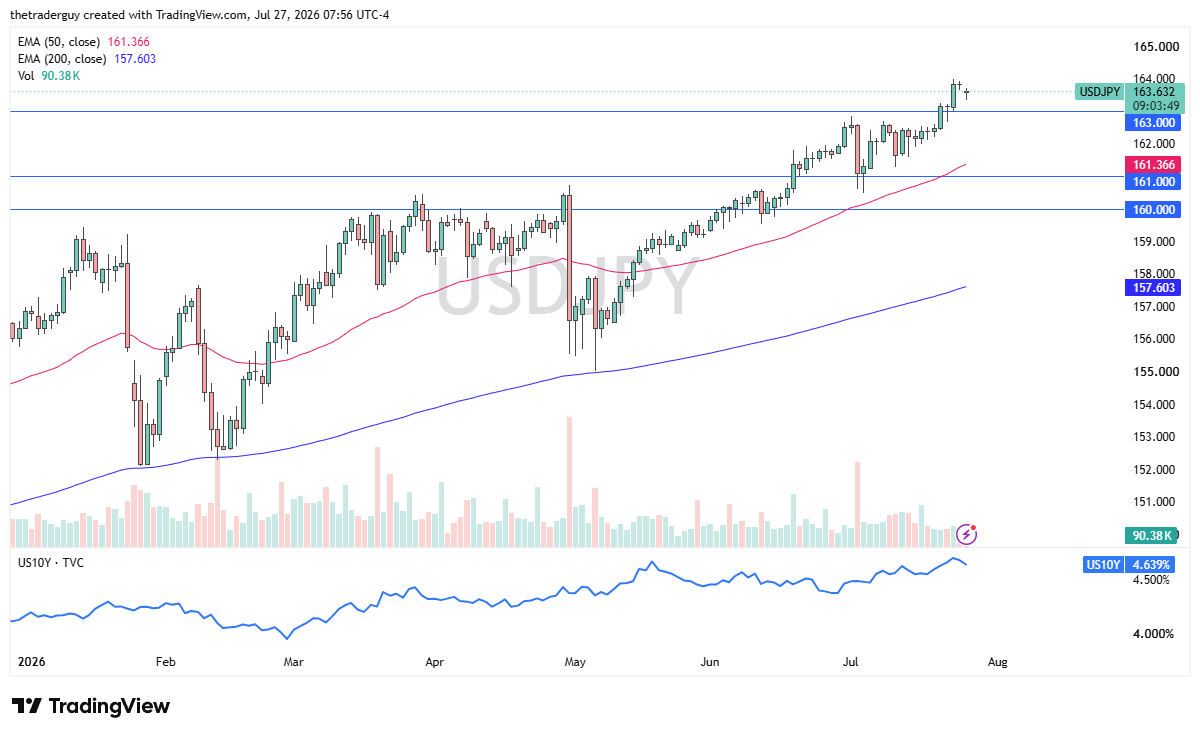
The US dollar has gapped lower to kick off the trading session on Monday against the Japanese yen, but turned around to show signs of strength again as despite the fact that rates are falling in America; the interest rate differential between these two currencies is still very wide, so that boosts the carry trade. We’ve broken above massive swing highs going back to the 1980s, so it’s difficult to imagine this market’s going to turn around on a dime. And ultimately, we’re in a nice 45-degree bullish trend, so by all accounts, the chart looks just as bullish now as it did a few days ago.
If you’d like to know more about how to trade forex, please visit our educational area.