



Gold (XAU) price remains under pressure near $4,000 as the conflict between the United States and Iran escalates. Higher oil prices may keep the inflationary pressure elevated and push the Federal Reserve to keep interest rates higher. The markets now expect greater odds of a September rate hike, with over 50% probability of a 25-bps increase.
Moreover, the higher interest rates and energy prices may slow manufacturing activity and reduce the demand for silver (XAG). Therefore, the silver price also remains under pressure below $60. But the escalating geopolitical crisis creates a safe-haven demand that may trigger strong rallies in precious metals once this correction is over.
Gold Technical Analysis: Bearish Momentum Tests $4,000 Support
XAUUSD Daily Chart: Weak Rebound Keeps Downside Risk Alive
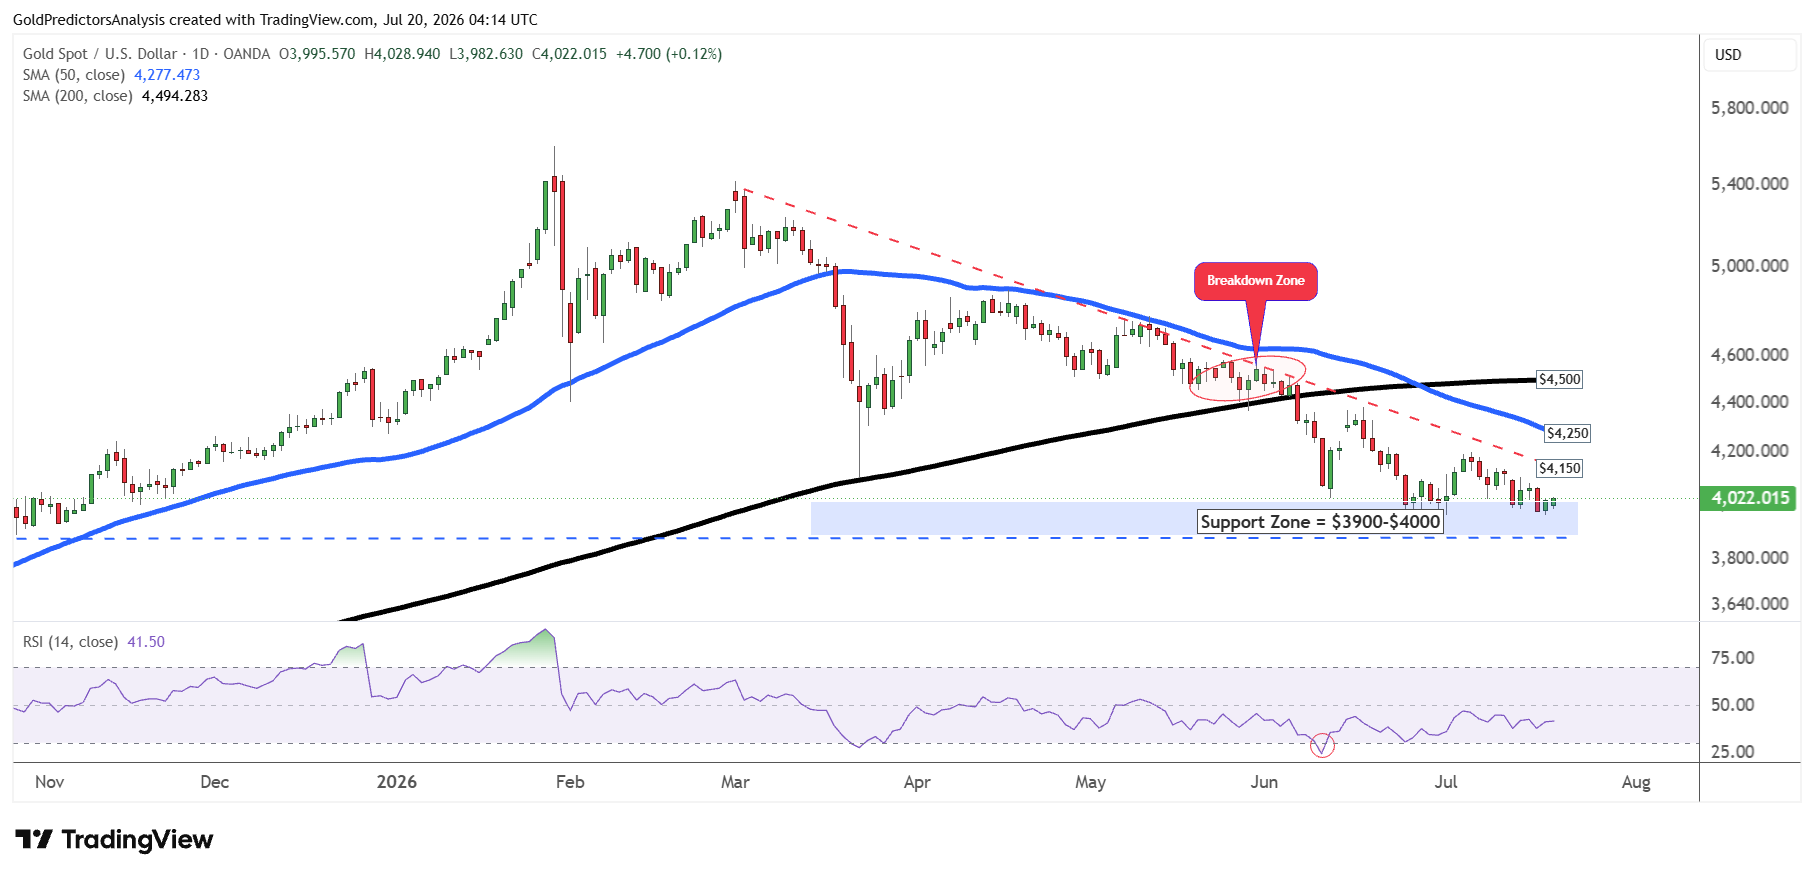
The daily chart for spot gold shows that the price is consolidating in the strong support zone of $3,900 to $4,000. This support zone is defined by the October 2025 lows. The price may trigger a rebound from this support zone. But the $4,150 level protects the rally.
A break above $4,150 may push spot gold to $4,250, which is defined by the 50-day SMA. A break above the 50-day SMA may push the spot gold to the 200-day SMA at $4,500. Overall, the rebound from $4,000 is quite weak which indicates further downside in the short term. The RSI indicator also remains below the midpoint, which points to further pressure.
The 50-day SMA remains below the 200-day SMA, which points to the negative trend in the gold market. A recovery above $4,500 in spot gold may change the overall outlook and initiate a rally to $5,000.
Gold Price Forecast
Every new Gold analysis as it publishes, today's technical signal and key levels, live price — on one page.
See all Gold forecastsXAUUSD 4-Hour: Key Breakout Levels at $3,800 and $4,200
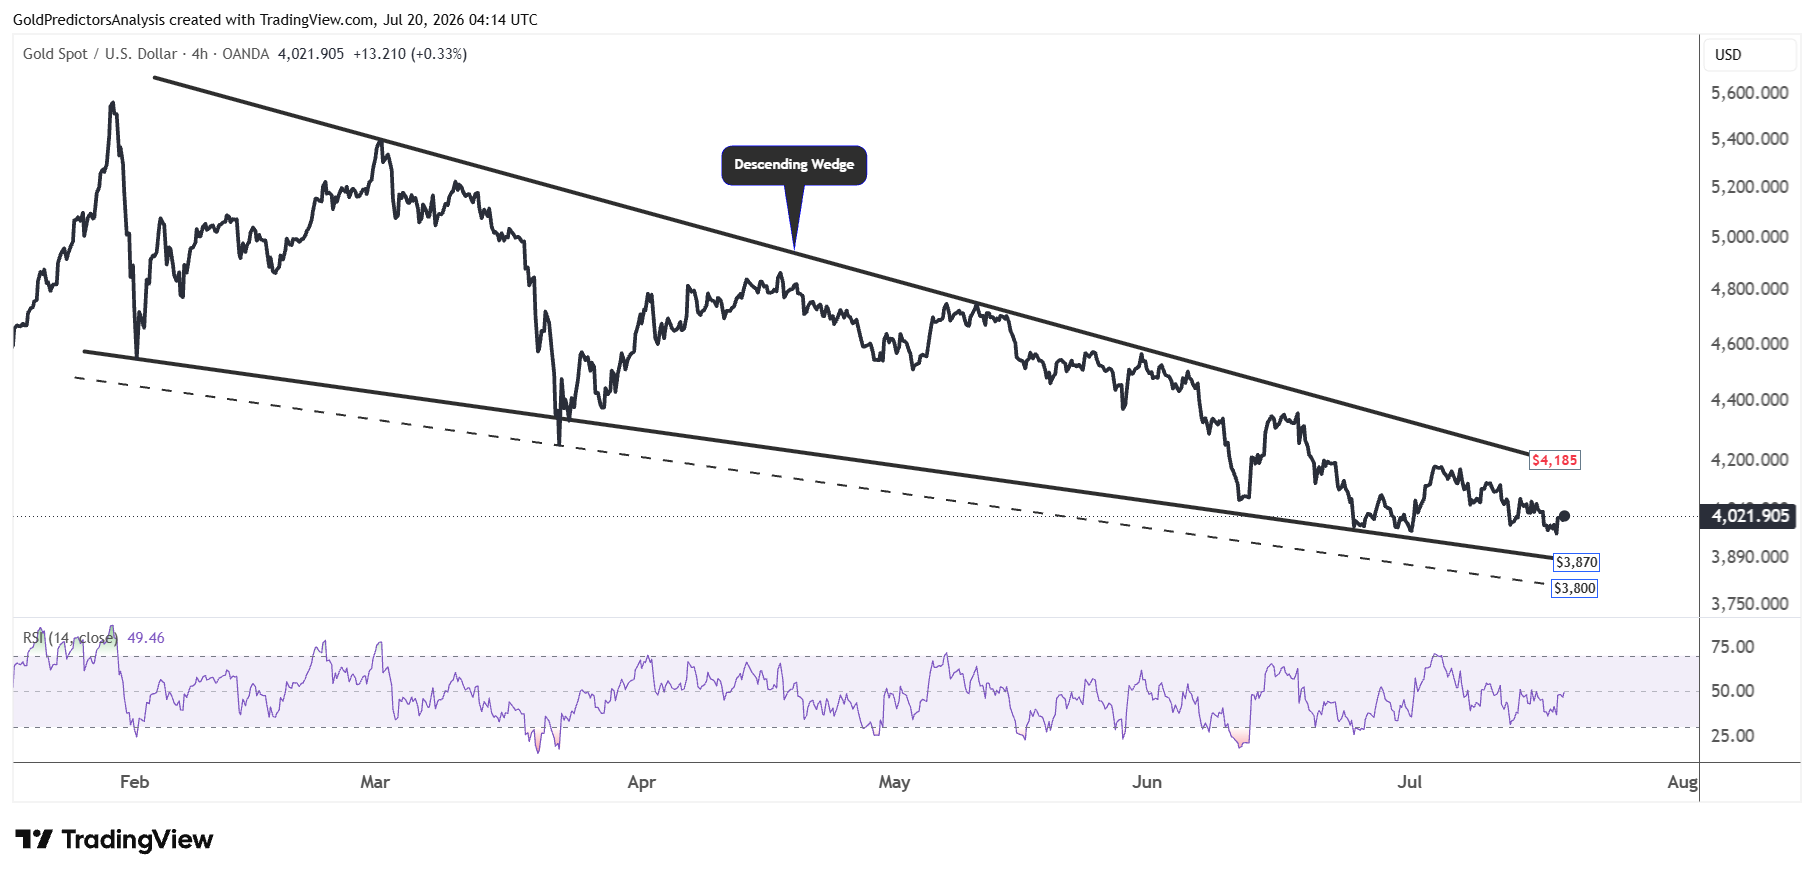
The 4-hour chart for spot gold also shows price compression within the edge of the wedge. The price is now consolidating between $4,200 and $3,800. A break of these levels will likely define the next move.
The RSI remains below the midpoint and is looking for its next direction. A break above $4,185 may ease the short term pressure and initiate a rally toward $4,500.
Silver Technical Analysis: Bearish Momentum Builds Below $60
Silver Daily Chart: $45–$55 Remains a Major Support Zone
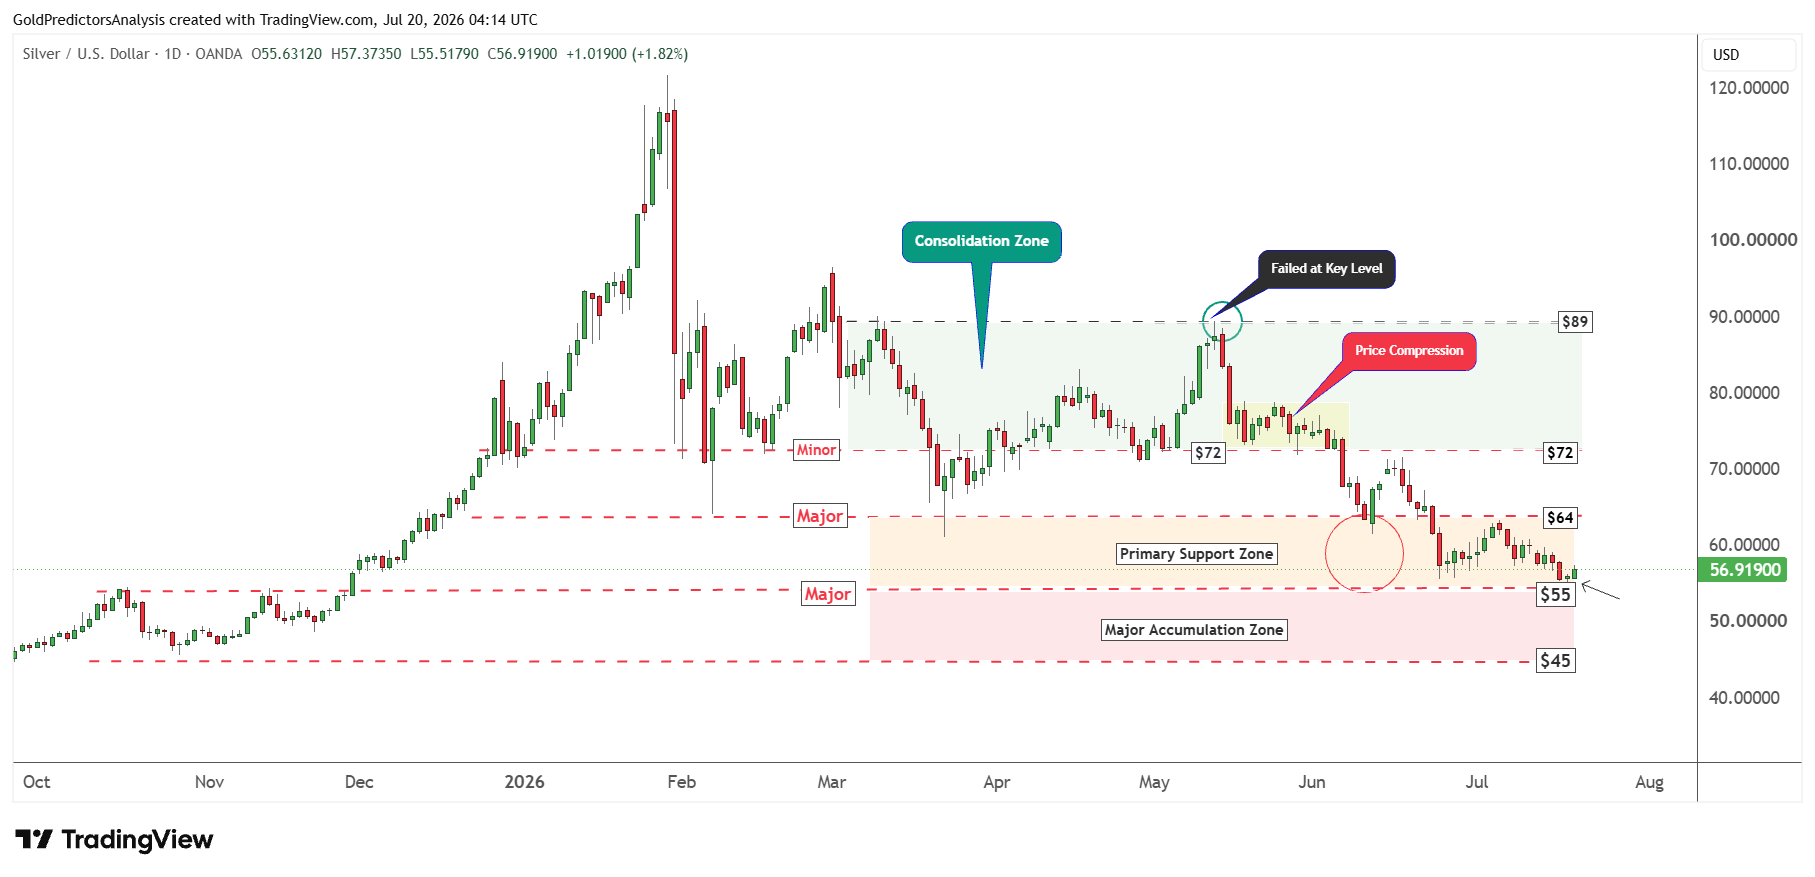
The daily chart for spot silver also shows strong price consolidation between $55 and $64. This support zone is referred to as the primary support. A break below $55 may push the price toward the major support zone between $45 and $55.
As long as the price holds at $45, it may attract buying interest and move higher. The immediate resistance in spot silver remains at $64. A break above $64 may push the price toward $72.
Silver 4-Hour: Descending Wedge Signals a Possible Breakout
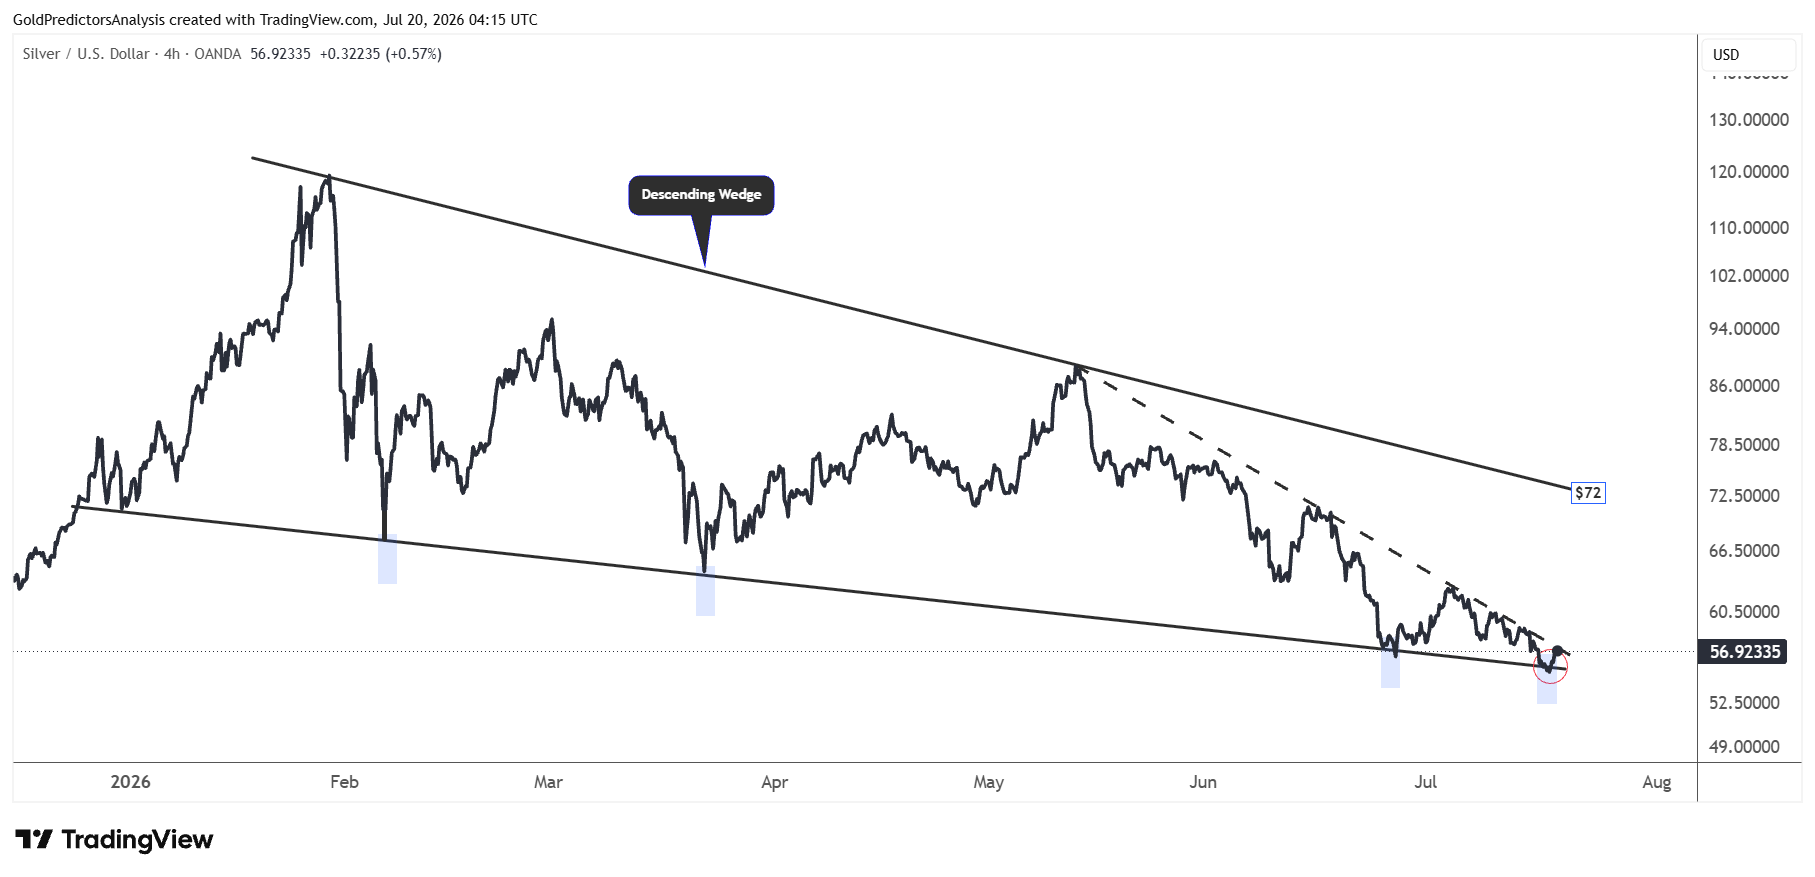
The 4-hour chart for spot silver also shows that the price is consolidating at the lower boundary of the descending wedge pattern.
This wedge pattern extends from the January 2026 highs while the price has now reached extremely oversold condition in the short term. But a break below $55 may trigger further drop in silver prices toward $50. A break above $60 is required to ease the bearish pressure and push prices to $72.
It is interesting to note that the $72 region now aligns with the resistance of wedge pattern. A break above this level may confirm the silver bottom and push prices to $100.
Bottom Line
Gold and silver may remain under pressure as higher oil prices and rising expectations of interest rates support the US dollar and hurt the demand for precious metals. Gold must defend the $3,900-$4,000 support zone to prevent a deeper decline. But a break above $4,185 may pave the way towards $4,500.
Silver price also remains under pressure below $60. A break below $55 may push the price to $45. But a break above $64 could open the door for a rally to the $72 level. The ongoing geopolitical tensions can drive up the demand for safe havens and lift prices once the correction is over.
Read more: Silver Eyes $50 After Breaking Below $60