Gold (XAU) had given up some of its early gains and was near $4,244 an ounce on Friday. After a more than 4% gain on Wednesday, the metal was at its highest since June 18. But oil prices have rebounded from the support following Iran’s consideration of a bill that would limit the use of the Strait of Hormuz by “hostile” vessels. The news renewed concerns about oil supply and inflation. The higher energy costs can increase production and transport costs, which businesses can charge to customers.
The threat of inflation also bolstered the view that the Fed may keep rates elevated or hike again. The market now waits for the US employment report this Friday to get a better sense of Fed policy. The strong employment data can increase pressure on gold, whereas weaker data can reduce the prospects of rate hikes and support prices.

Gold Price Forecast: $4,300 Breakout Could Open the Path to $4,500
XAUUSD Holds Above 50-Day SMA but Faces $4,500 Resistance
The daily chart for spot gold shows that the price broke wedge pattern on Wednesday and closed above the 50-day SMA. This breakout was significant and opened the door for positive consolidation in gold. But the 50-day SMA remains below the 200-day SMA. The price also remains below the 200-day SMA, which keeps the short term rebound in question. To maintain strong rallies in the gold market, the price must overcome the 200-day SMA near $4,500.
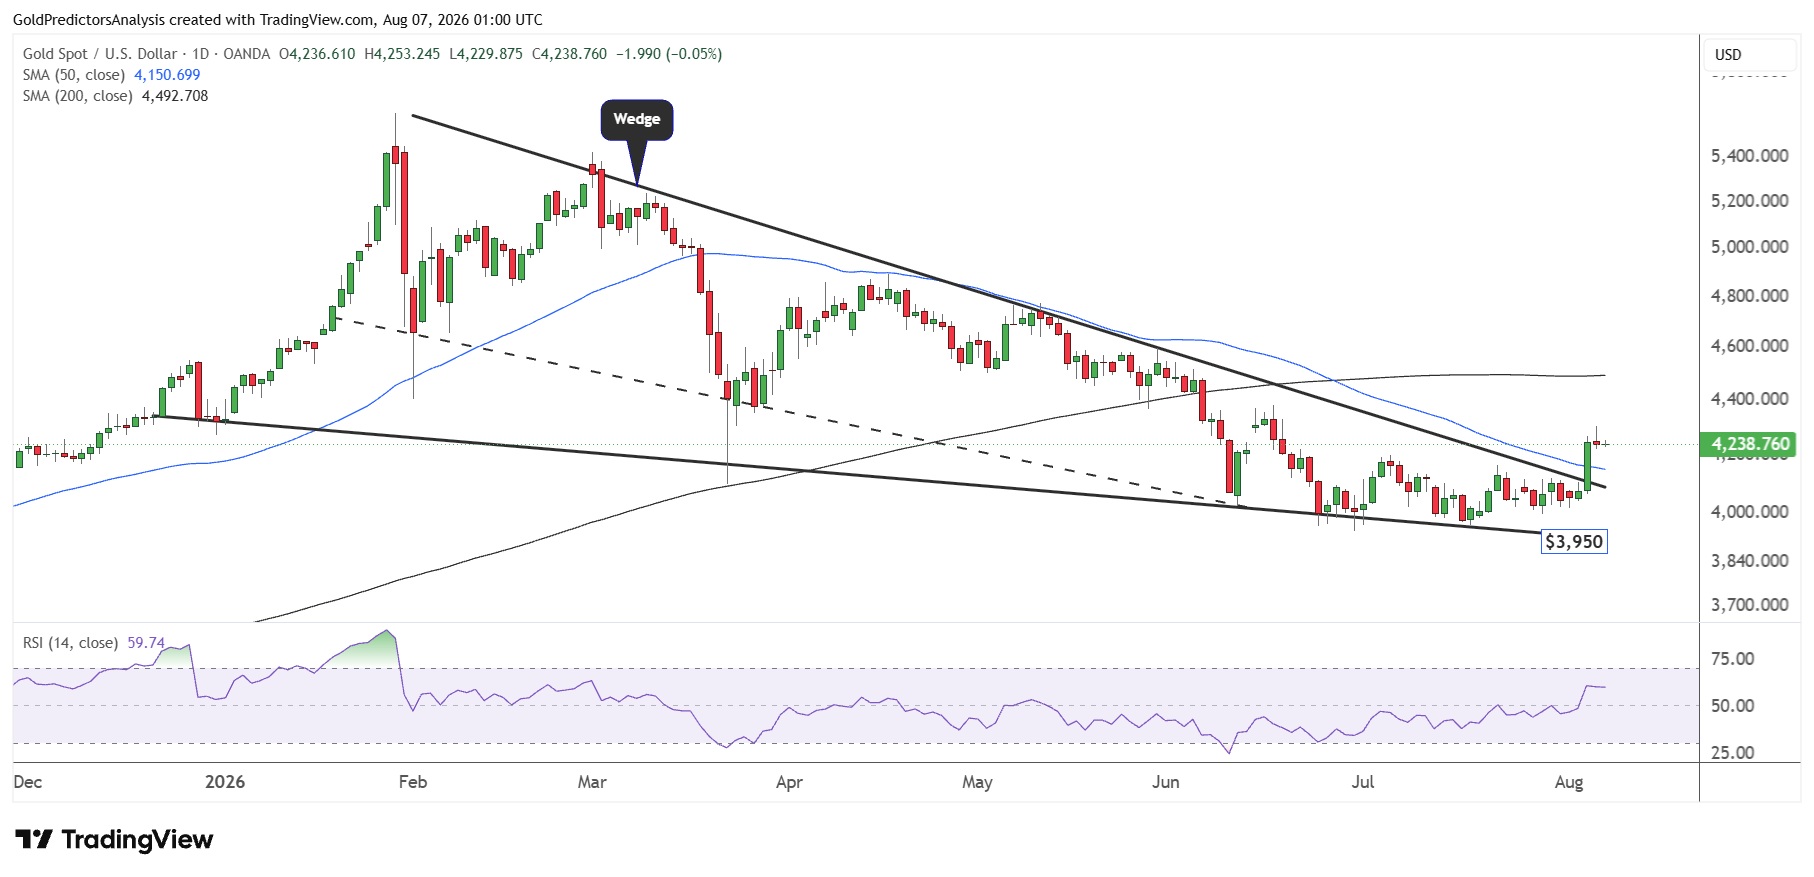
However, the upcoming employment data will be key to gold prices. Strong job numbers can push the gold price back below the 50-day SMA and push prices towards the $4,000 region. A break below $3,900 will indicate negative price action and open the door for a strong drop. On the other hand, the weak jobs data may keep the rallies in gold prices to $4,500.
Gold Price Tests Descending Trend-Line Resistance Near $4,300
The importance of the current resistance is seen on the 4-hour chart, which shows that the price hit the descending trend line at $4,300 that stretches from the April 17, 2026, high.
Gold Price Forecast
Every new Gold analysis as it publishes, today's technical signal and key levels, live price — on one page.
See all Gold forecastsA break above this descending trend line will open the door for a strong rally to $4,450. On the other hand, $4,120 is seen as important support. A break below $4,120 will indicate that this was just the short term rebound and that the price remains negative and continues to move downward.
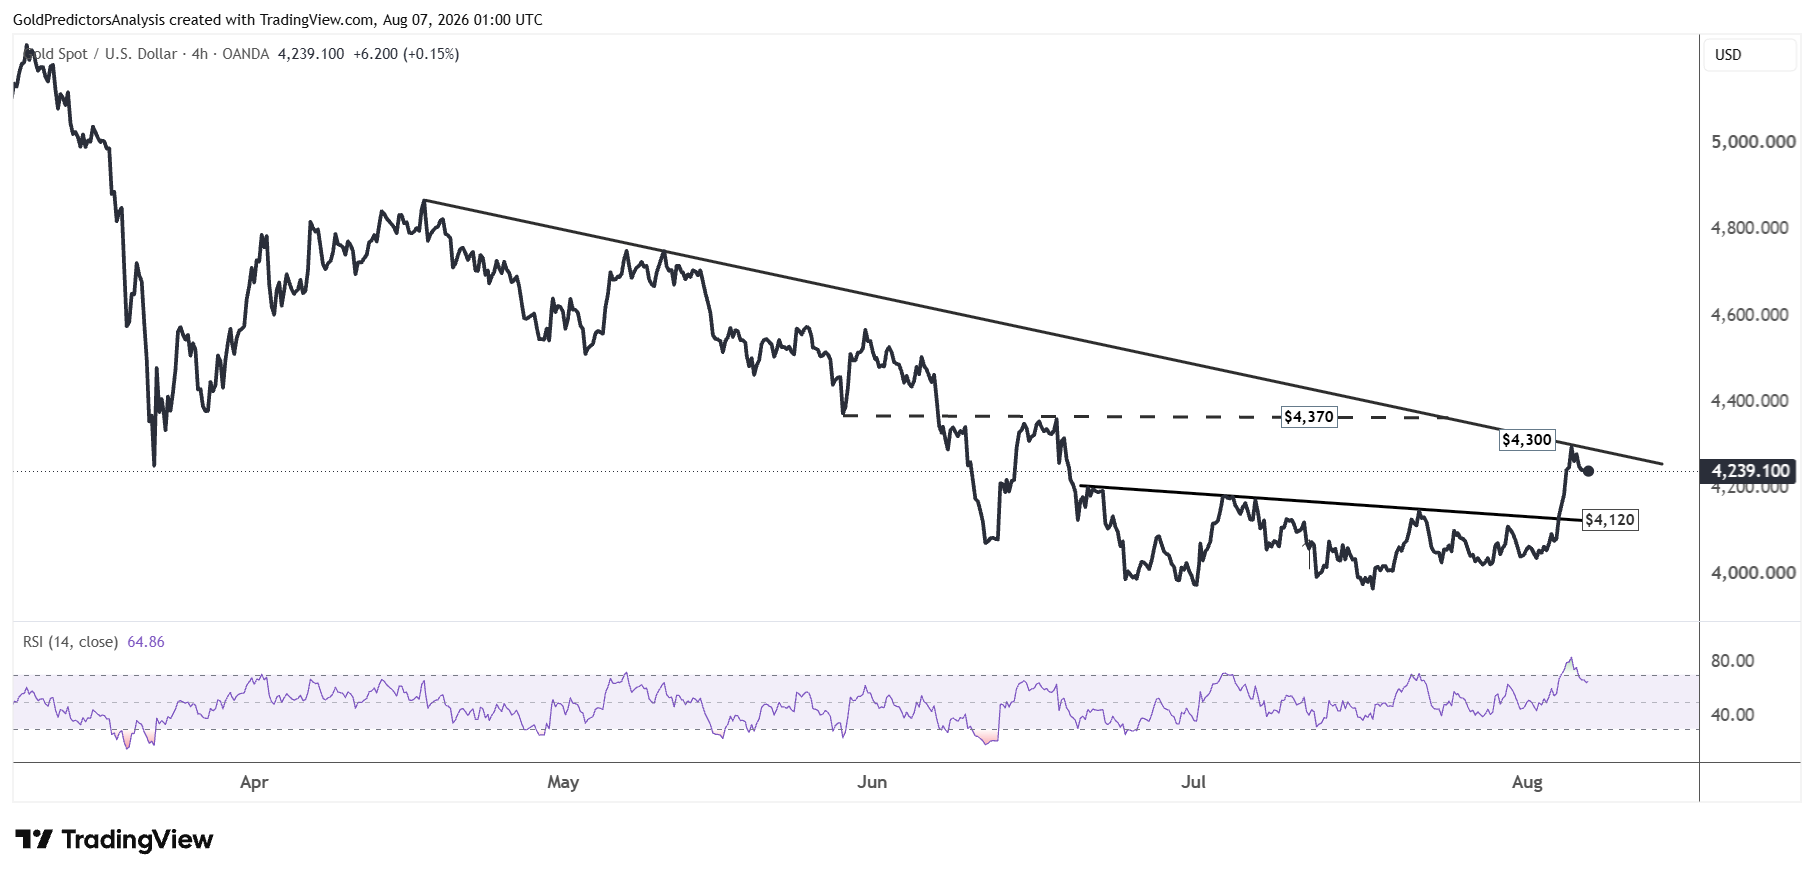
The RSI indicator also shows the overbought conditions in the short term and suggests a correction before the next rally. But the price must break above the descending trend line to maintain bullish momentum in gold.
Silver Price Forecast: $62-$64 Resistance Holds the Key
XAGUSD Needs a Break Above $64 to Target $72
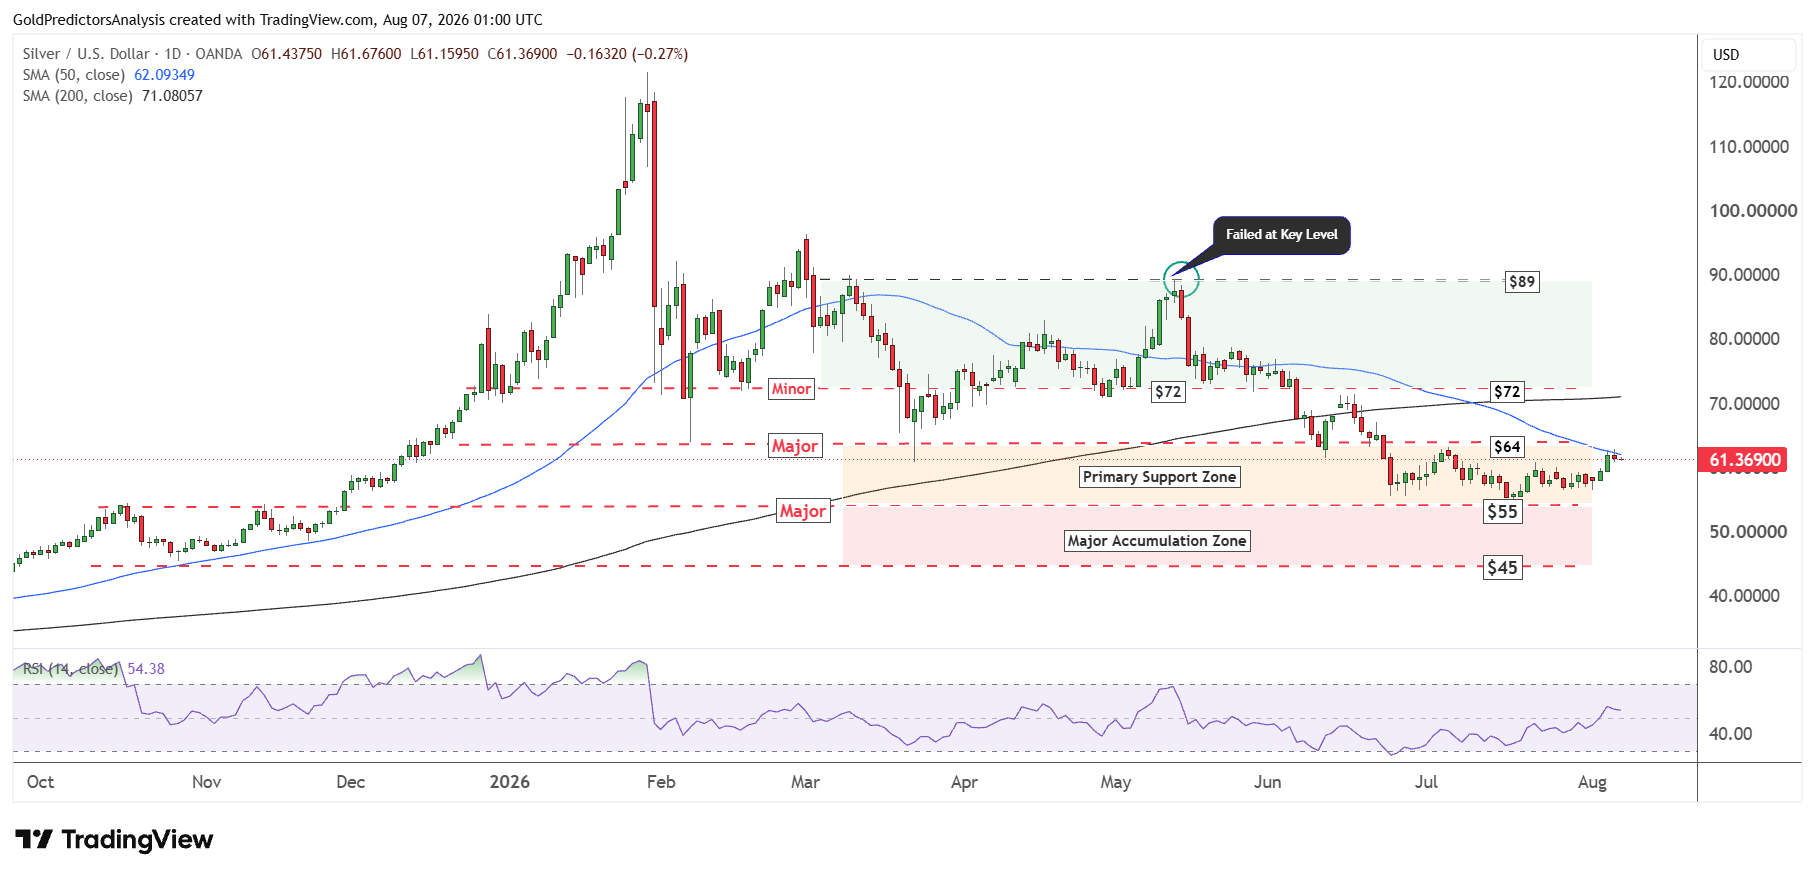
The daily chart for spot silver also shows that the price hit the 50-day SMA resistance. The 50-day SMA currently lies at $62. A confirmed break above this level will keep the silver rally open towards $64.
A break above $64 is required to maintain the rally towards the $72 area. On the other hand, if prices fail to break higher and drop below the $55 support, it will bring the negative trend in silver back towards $45-$50.
But the RSI indicator has broken above the midpoint and continues to accelerate higher, which indicates that the short term direction for silver remains upward.
Silver Tests Descending Wedge Resistance Near $62.50
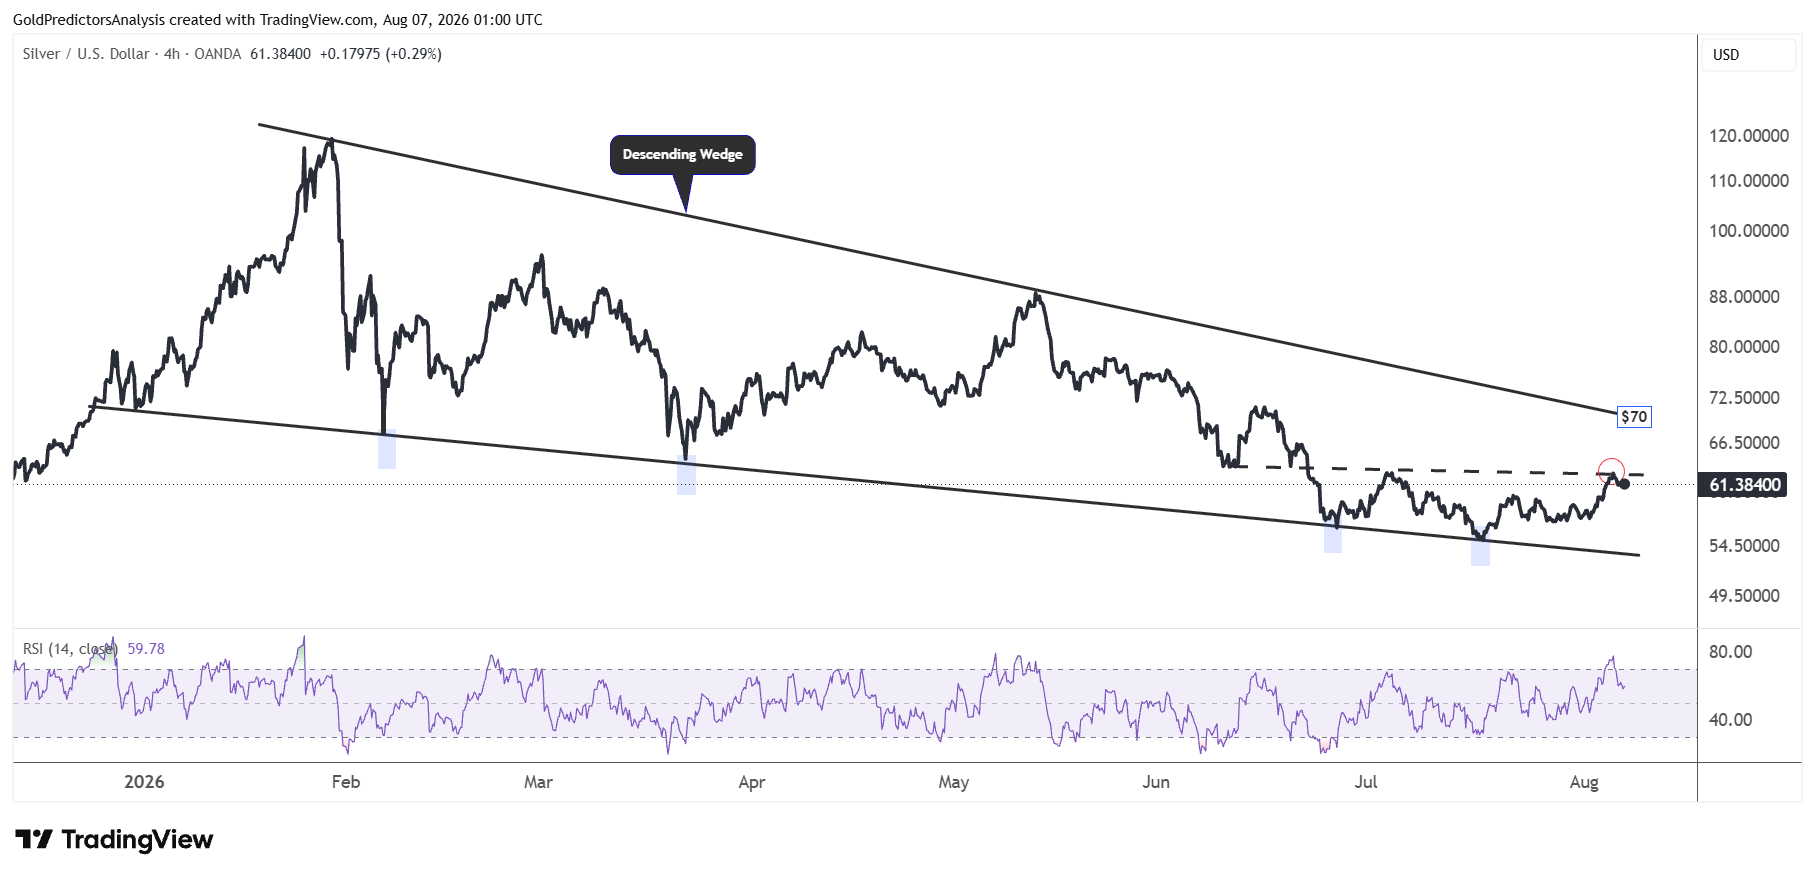
The current resistance in the silver market is evident on the 4-hour chart. The chart shows the formation of descending wedge pattern. The price is currently trading at the black dotted trend line at $62.50.
A break above this resistance is required to push the price towards the resistance at $70. A break above $70-$72 will break the descending wedge pattern and maintain the strong rally in the silver market.
What Is Next for Gold and Silver Prices?
Gold and silver prices are testing key resistance levels as investors wait for the U.S. employment report. The spot gold price needs to break above $4,300 to target $4,500. A break below $4,120 may weaken the rebound and bring $4,000 back into focus. The spot silver price must break above the $62-$64 resistance zone to extend the recovery towards $70-$72. But a break below $55 may push the silver to the $45-$50 region. The strong employment data may pressure both metals while weaker numbers may reduce the rate hike expectations and support further gains.
Read more: Can US Payrolls Trigger a Gold Breakout Toward $5,000?