
Gold (XAUUSD) price rose toward $4,540 on Friday as the U.S. Treasury prepared to increase purchases of longer-dated bonds. Treasury Secretary Scott Bessent said that the buybacks could increase in excess of $4 billion. That could help to ease pressure on the long term yields and lower borrowing costs. The drop in the yields supports the gold outlook as they make it less costly to maintain a non-yielding asset. The policy signal could also help to boost demand for silver (XAGUSD), which tends to follow the gold price with any major precious metals rally.
But the energy induced inflation still remains the main risk for both metals. The increase in energy prices may help maintain inflation at a higher level and provide a reason for the Federal Reserve to further increase rates. There is a 36.2% chance of the rate hike during the next meeting, compared to 45% a month ago. The easing expectations of the rate hike during the next meeting have supported the gold and silver prices for now. But the increase in these expectations again may limit the gold and silver rally. Gold could perform well if investors look for inflation protection while silver could face pressure if the higher rates reduce industrial activity.

Gold Technical Analysis: Break Above $4,400 Opens Path to $5,000
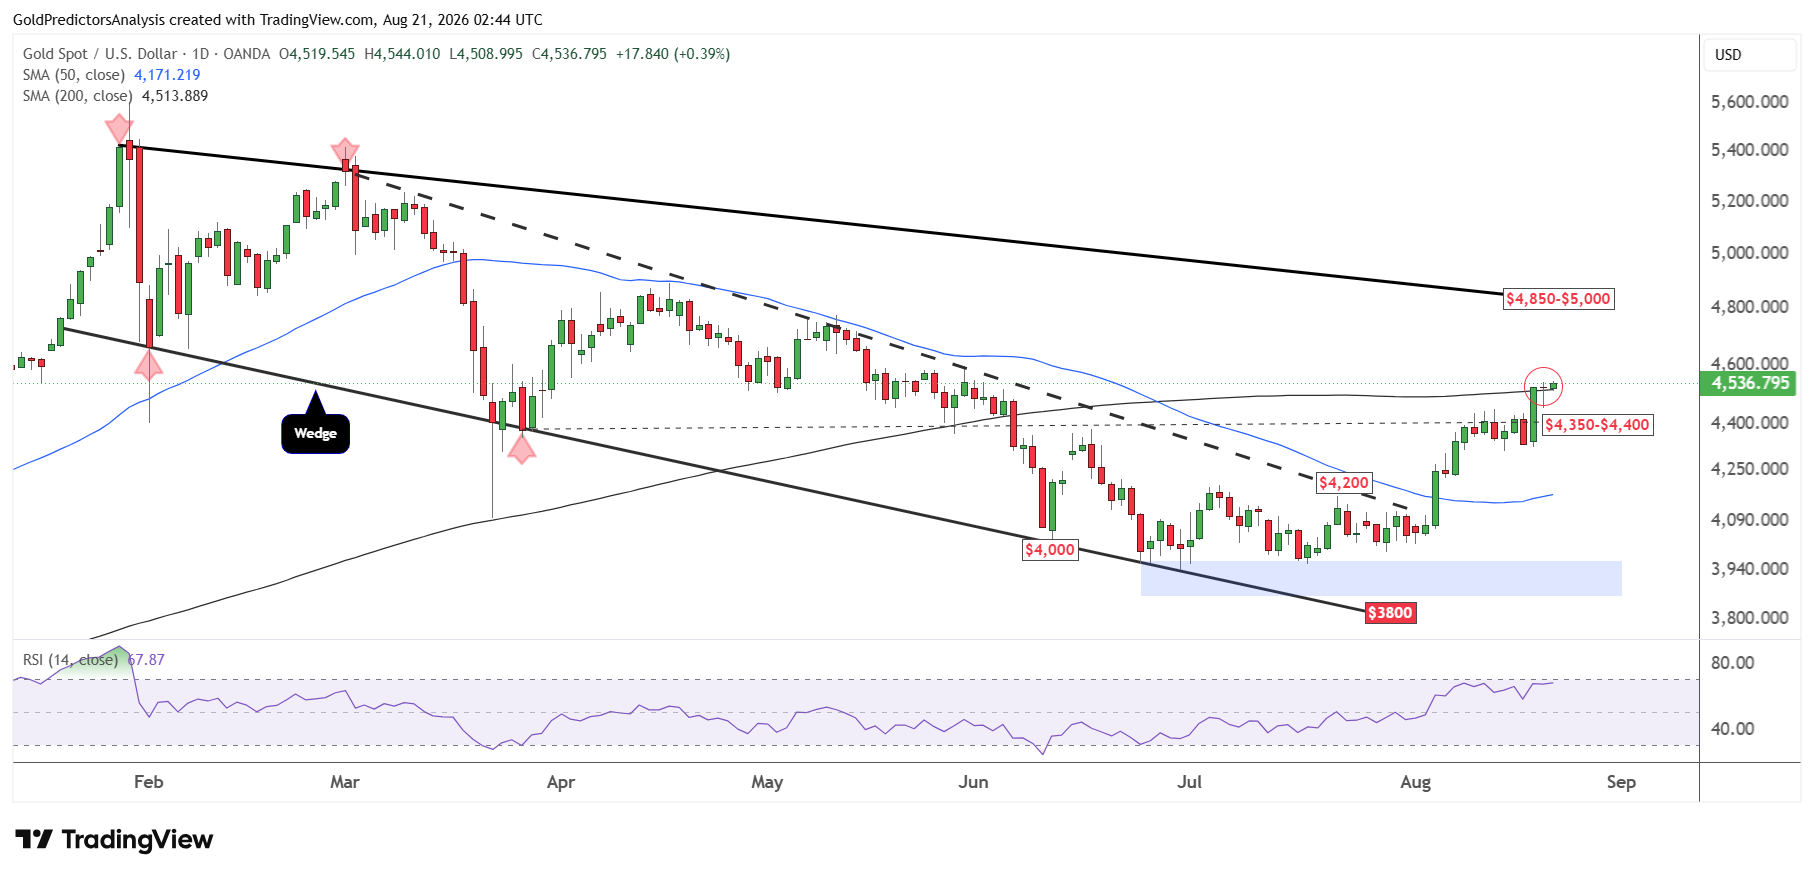
The daily chart for spot gold shows that the price broke above $4,400 on Wednesday and closed above the 200-day SMA. The positive price action on Thursday and Friday suggests that the price will likely remain strong in the short term.
A break above $4,400 has opened the door for a move to descending trend line of the wedge pattern in the $4,850 to $5,000 area. The RSI remains elevated at 67 but there is still potential for gold to rise due to its strong momentum.
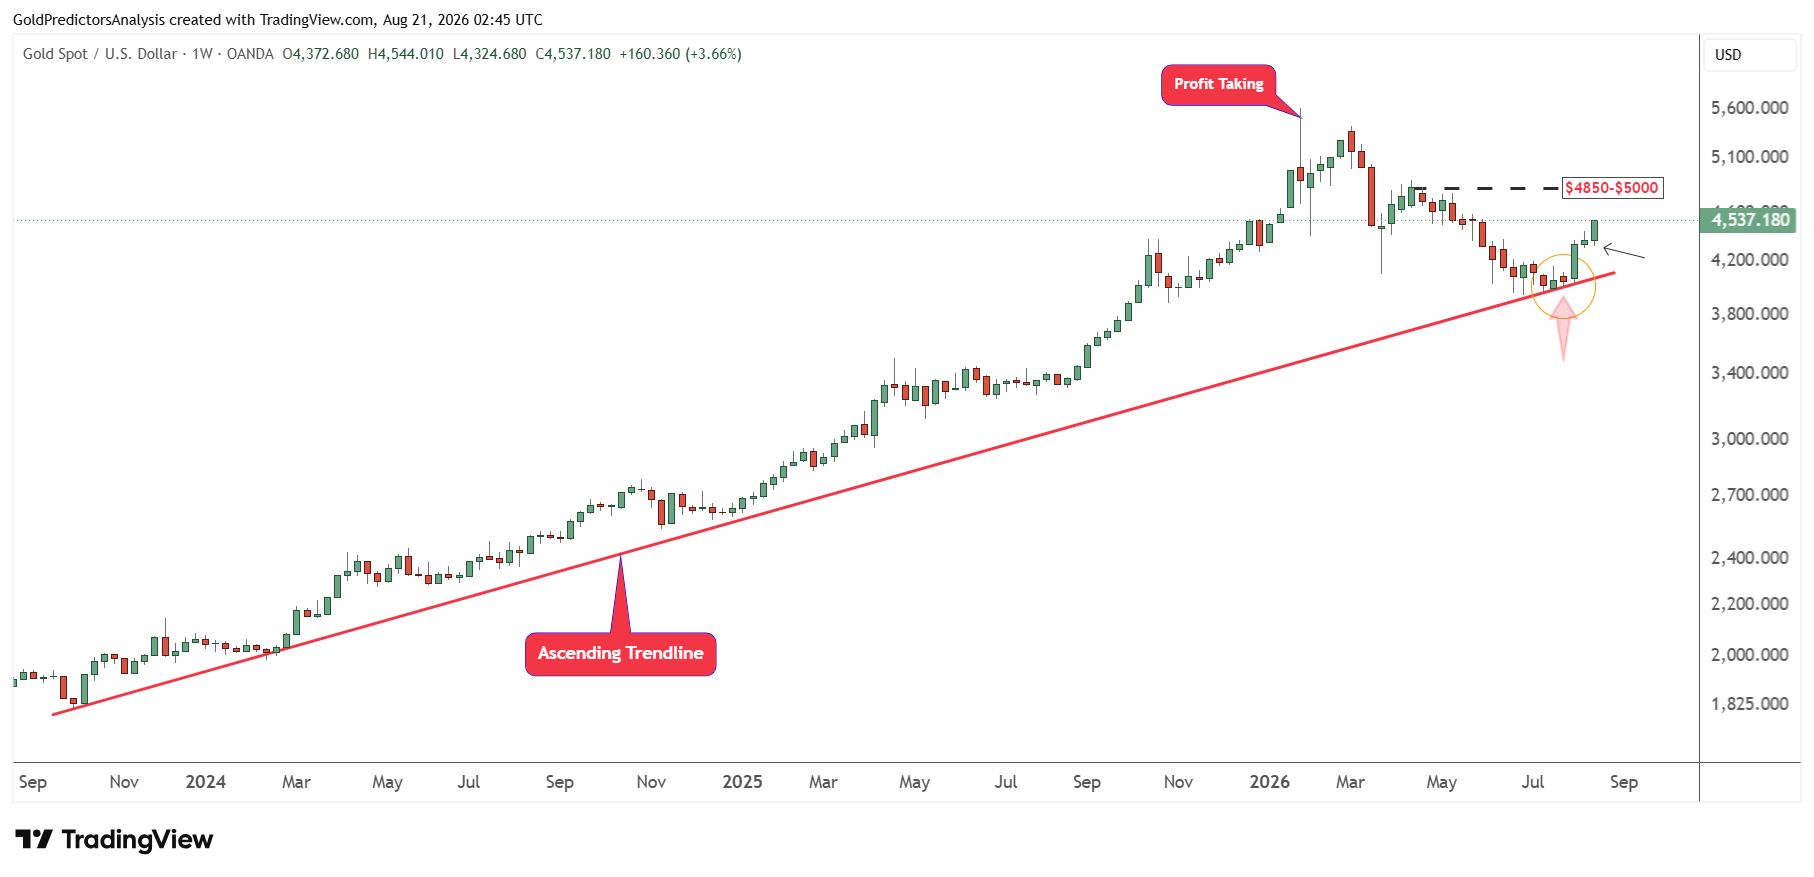
This strength in gold is observed on the weekly chart. The chart shows that the rebound in the gold price developed exactly at the support of the ascending trend line. The positive weekly candle in August indicates sustained upside movement in the short term. The immediate target on the weekly chart remains the $4,850 to $5,000 area, which is the April 2026 highs.
Gold Price Forecast
Every new Gold analysis as it publishes, today's technical signal and key levels, live price — on one page.
See all Gold forecastsSilver Technical Analysis: Break Above $72 Could Trigger Rally Toward $90
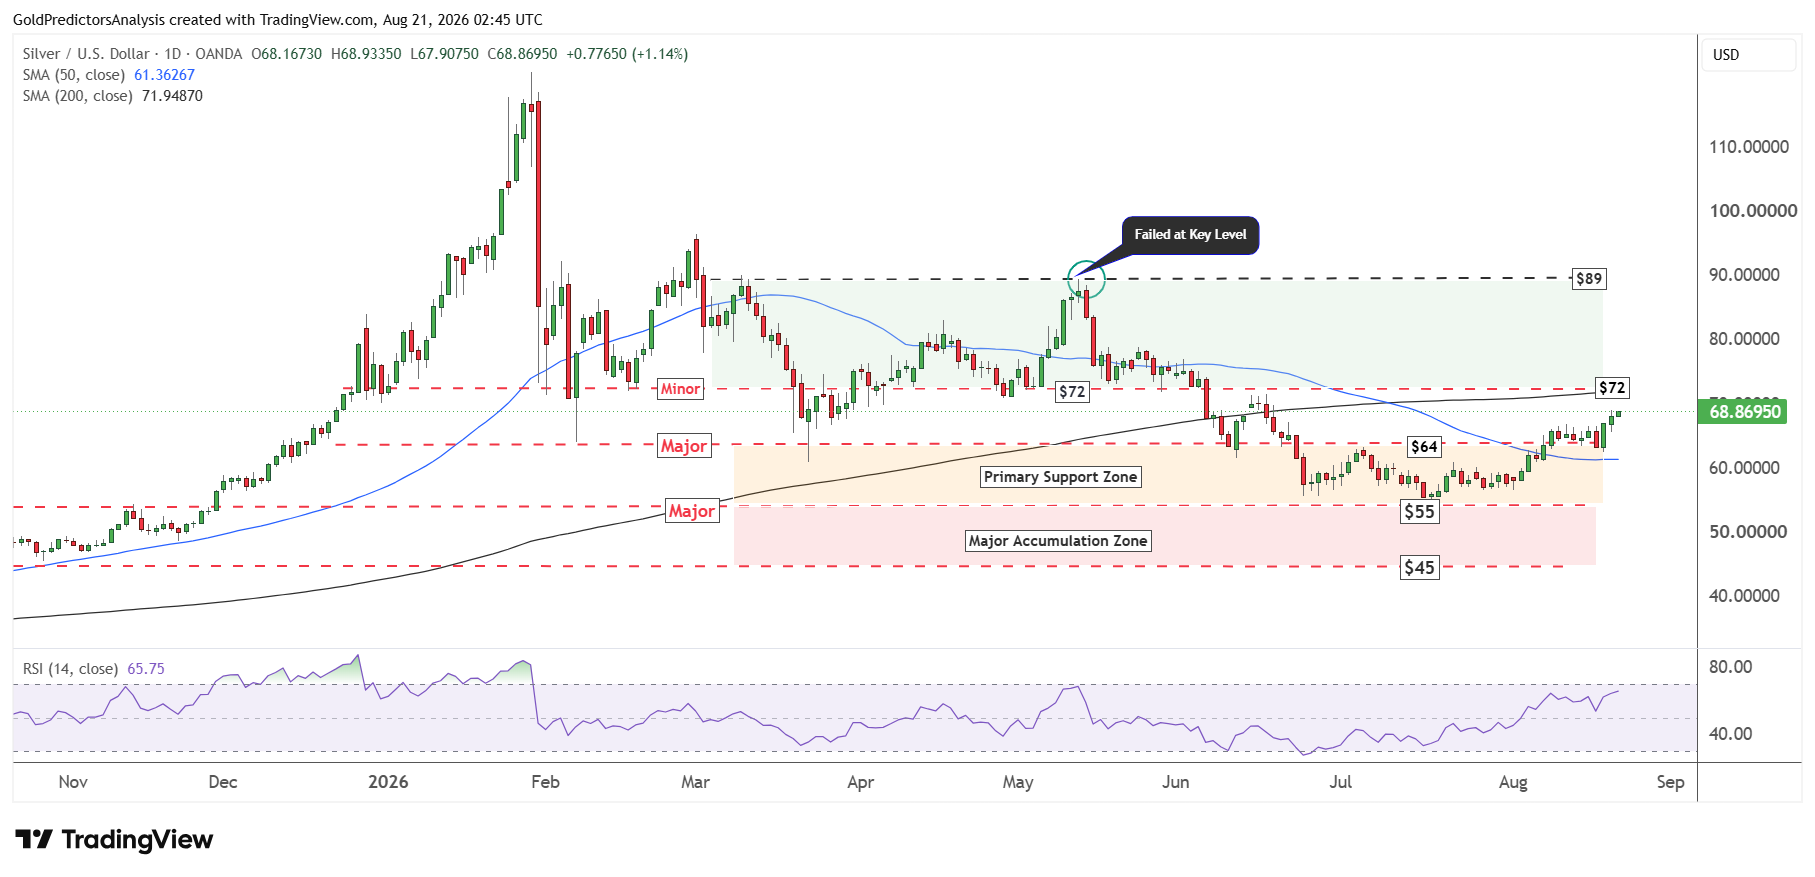
The daily chart for spot silver also shows strong constructive price action after the breakout above $64. The price has formed strong constructive price action within the primary support zone between $55 and $64. This constructive price action was formed in June and July by strong consolidation within this band.
The price is now looking to move toward the $72 resistance. This key resistance is also marked by the 200-day SMA. Therefore, a break above this level will likely open the door for strong rally toward the $89 area in the spot silver market.
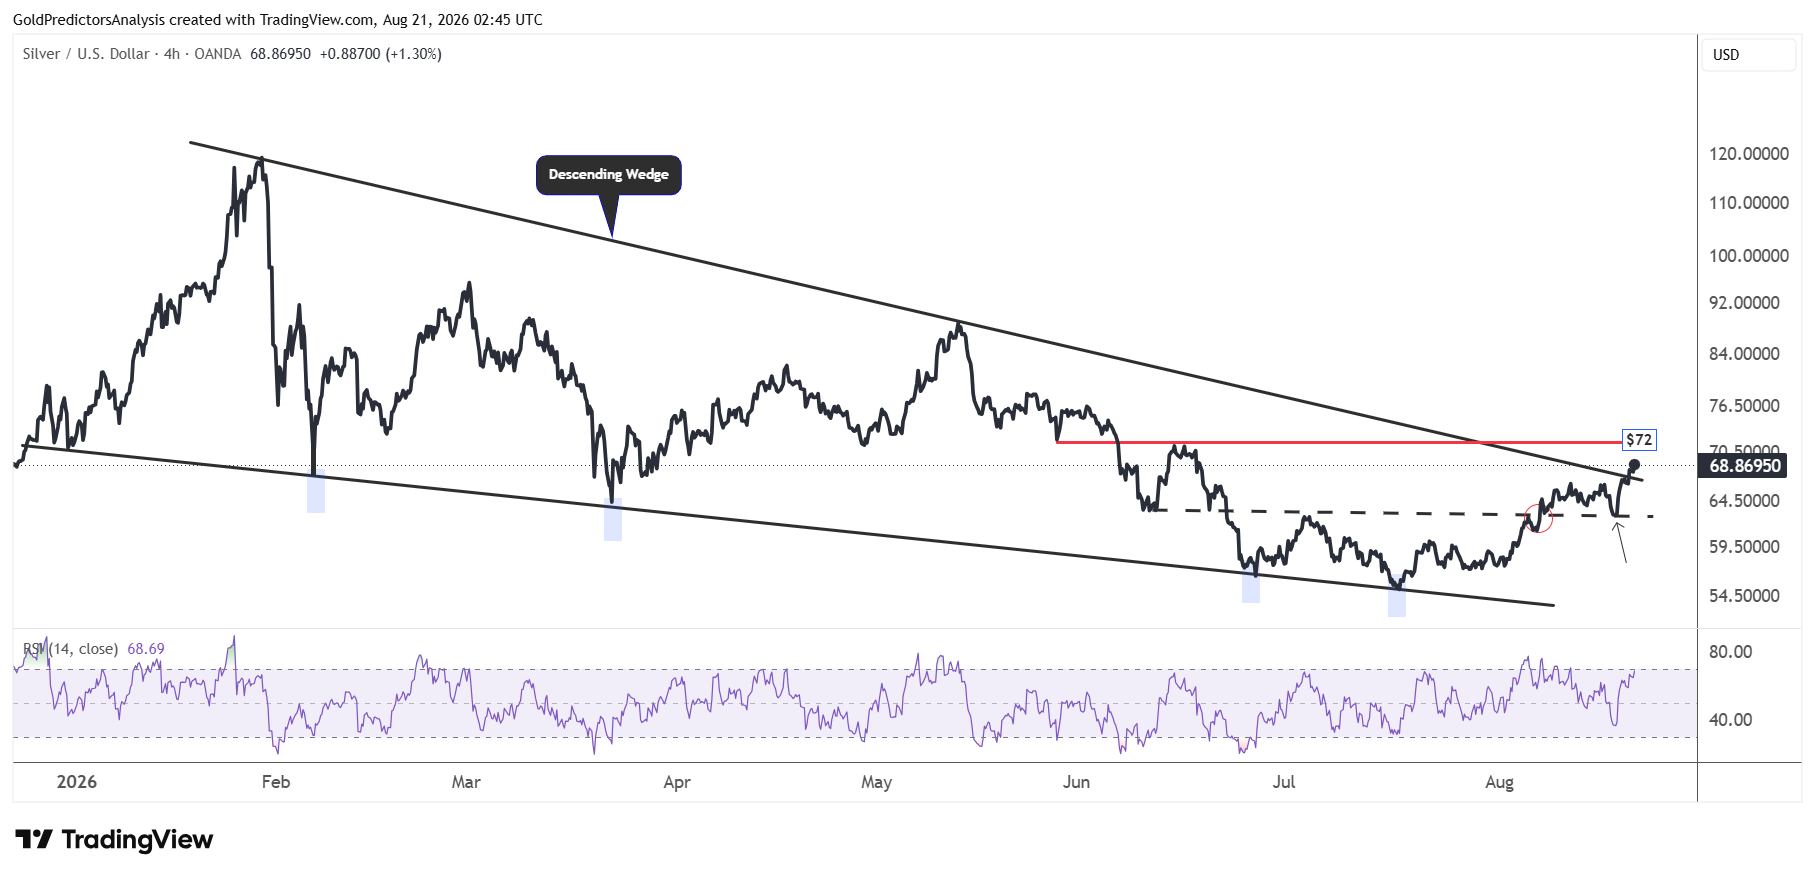
The importance of $72 is also observed on the 4-hour chart, which shows that the price has already broken above the descending wedge pattern. The breakout above this pattern indicates an immediate move toward the $72 area. A breakout above $72 will likely indicate sustained move toward the $90 area, which marks the May 2026 highs.
Bottom Line
Gold and silver maintain the positive outlook in the short term as Treasury bond buybacks ease pressure on long term yields. Gold has strengthened above $4,400 and could now test the $4,850 to $5,000 area. Silver also remains strong above the primary support zone and it must break $72 to target the $90 area. But higher energy prices could keep inflation elevated and revive expectations of another Fed rate hike. This risk may limit the rally but the current price action still favors further gains in both metals.
Read more: Will Lower Yields Drive Gold to $5,000?